Sample vs Population Standard Deviation: When to Use Each
By Dr. Zubair Khalid, DVM, MS, PhD ·
The difference between sample standard deviation vs population standard deviation comes down to one question: do you have data for every member of the group, or only a subset of it? If you measured every value in the population, divide by $N$. If you measured a sample and want to estimate the population's spread, divide by $N-1$. The formulas differ by a single denominator, but that denominator changes both the size of the result and the meaning of the number you report.
Quick Answer
- Use the population standard deviation when your data set contains every member of the group you care about. Divide the sum of squared deviations by $N$.
- Use the sample standard deviation when your data is a subset drawn from a larger group and you want to estimate that group's spread. Divide by $N-1$.
- The sample formula always gives a slightly larger value, because dividing by a smaller number inflates the result.
- In Excel,
=STDEV.P()computes the population version and=STDEV.S()computes the sample version. In Python,statistics.pstdev()andstatistics.stdev()do the same. - If you are unsure, ask whether the five (or fifty, or five thousand) values in front of you are the entire group. If not, use the sample formula.
Key Differences
| Feature | Population standard deviation | Sample standard deviation |
|---|---|---|
| Symbol | $\sigma$ | $s$ |
| Denominator | $N$ | $N-1$ |
| Applies when | You have all members of the group | You have a subset of the group |
| Purpose | Describe the spread exactly | Estimate the population's spread |
| Result size | Smaller | Larger |
| Excel function | STDEV.P | STDEV.S |
| Python function | statistics.pstdev | statistics.stdev |
| Bias | Exact for the data at hand | Corrected to reduce underestimation |
The denominator $N-1$ is called the degrees of freedom. When you compute deviations from the sample mean, the deviations are forced to sum to zero, so the last deviation carries no new information. Dividing by $N-1$ instead of $N$ compensates for that constraint and makes the sample variance an unbiased estimator of the population variance [1].
Population Standard Deviation Explained
The population standard deviation measures how far the values in a complete group spread around the group mean. You use it when the data set is the whole story: every measurement you care about is present.
$$\sigma = \sqrt{\frac{\sum_{i=1}^{N}(x_i - \mu)^2}{N}}$$
Here $\mu$ is the population mean, $N$ is the number of values, and $x_i$ is each individual value. The numerator sums the squared distances from the mean. Dividing by $N$ turns that total into an average squared deviation, and the square root returns the result to the original units.
A concrete case: a production line stamps out exactly 200 metal washers in a batch, and you measure the diameter of all 200. That batch is your population. There is no larger group you are trying to infer about, so you divide by 200. The result describes the batch exactly, with no estimation involved.
The same logic applies whenever the group is closed and fully observed. If a class of 30 students takes a quiz and you want the spread of those 30 scores, that is a population. If you want to generalize to all students who might take the quiz, it is a sample. The distinction is about scope, not size. A population can be small, and a sample can be large. What matters is whether the group is complete for your question.
For a fuller treatment of how the mean and standard deviation work together, see mean and standard deviation.
Sample Standard Deviation Explained
The sample standard deviation estimates the spread of a population using only the values you collected. You use it whenever your data is a subset and your real target is the larger group behind it.
$$s = \sqrt{\frac{\sum_{i=1}^{n}(x_i - \bar{x})^2}{n-1}}$$
Here $\bar{x}$ is the sample mean and $n$ is the number of values in the sample. The structure mirrors the population formula. Only the denominator changes.
Why does that matter? Sampling naturally tends to miss extreme values, so a sample usually looks a little tighter than the population it came from. Dividing by $n-1$ widens the estimate to offset that tendency. The more observations you take, the more your sample resembles the population, and the closer the two formulas get [2]. With $n = 100$, the difference between dividing by 100 and dividing by 99 is about 1 percent. With $n = 5$, it is 25 percent.
The sample formula is the default in most inferential work. When you run a t-test, build a confidence interval, or feed a standard deviation into a sample size calculation, you are almost always working with $s$, not $\sigma$. If you want to see how that value feeds into planning, the sample size standard deviation formula walks through the connection.
Worked Example
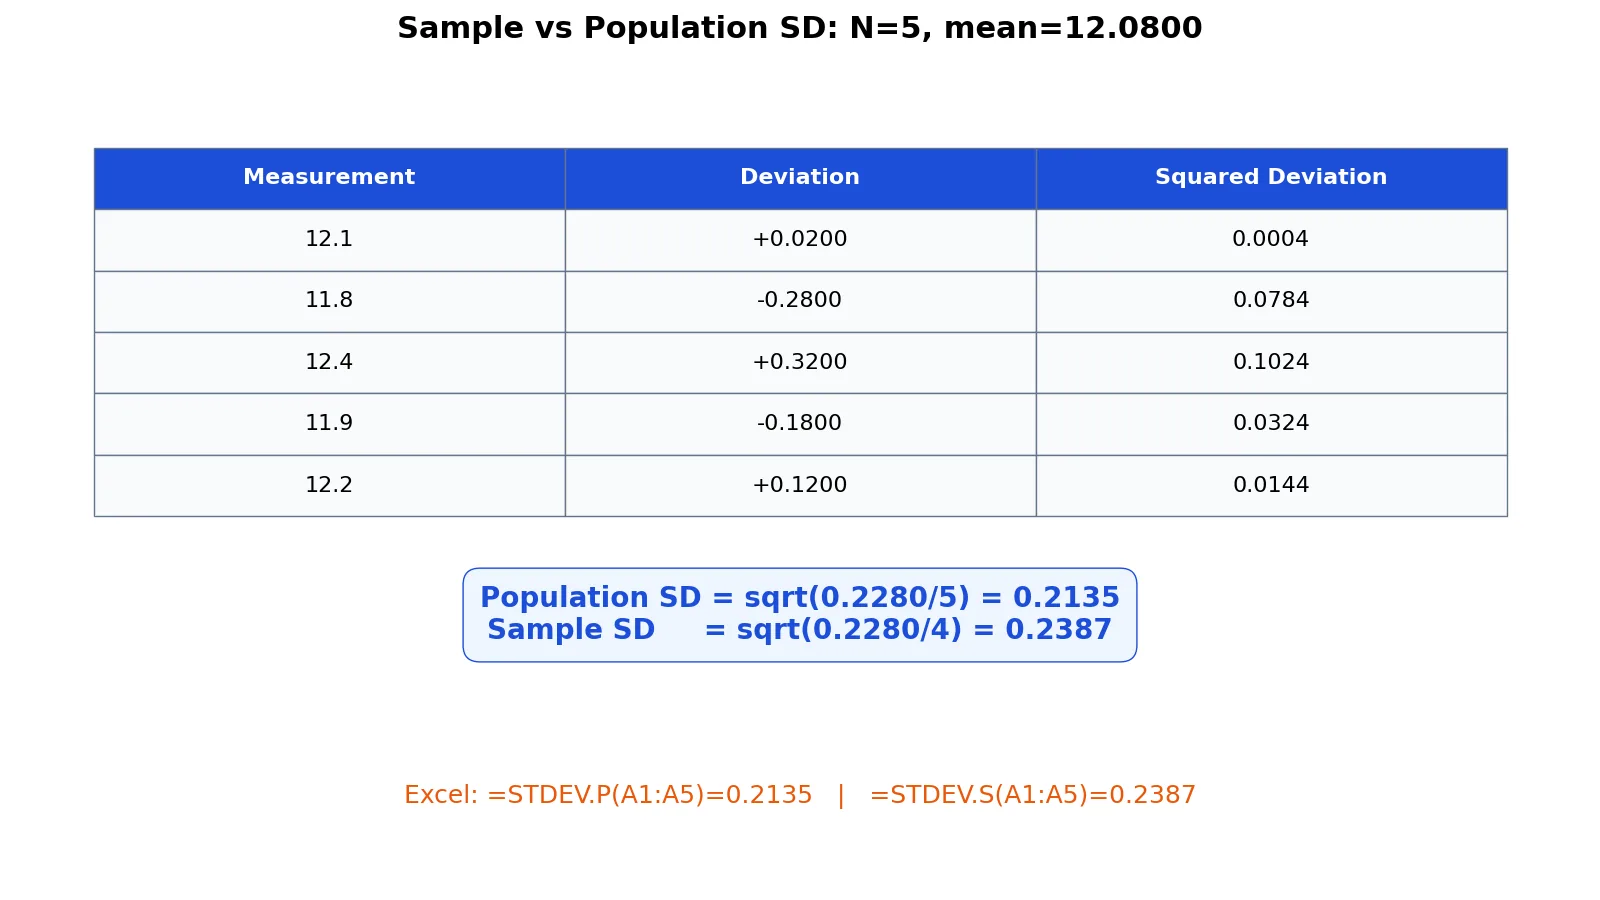
Five lab measurements (grams) of the same specimen were recorded. The question is whether to treat them as a population or a sample.
| Measurement | Deviation from mean | Squared deviation |
|---|---|---|
| 12.1 | 0.0200 | 0.0004 |
| 11.8 | -0.2800 | 0.0784 |
| 12.4 | 0.3200 | 0.1024 |
| 11.9 | -0.1800 | 0.0324 |
| 12.2 | 0.1200 | 0.0144 |
Step 1. Count the values.
$$N = 5$$
Step 2. Compute the mean.
$$\bar{x} = \frac{12.1 + 11.8 + 12.4 + 11.9 + 12.2}{5} = 12.0800$$
Step 3. Sum the squared deviations.
$$0.0004 + 0.0784 + 0.1024 + 0.0324 + 0.0144 = 0.2280$$
Step 4. Population variance and standard deviation.
$$\sigma^2 = \frac{0.2280}{5} = 0.0456 \qquad \sigma = \sqrt{0.0456} = 0.2135$$
Step 5. Sample variance and standard deviation.
$$s^2 = \frac{0.2280}{4} = 0.0570 \qquad s = \sqrt{0.0570} = 0.2387$$
Step 6. Compare.
$$\frac{0.2387}{0.2135} = 1.1180$$
The sample standard deviation is about 11.8 percent larger than the population standard deviation on the same five numbers. That gap is entirely a function of the denominator, not of the data.
import statistics
data = [12.1, 11.8, 12.4, 11.9, 12.2]
pop_sd = statistics.pstdev(data)   # 0.2135
samp_sd = statistics.stdev(data)   # 0.2387
print(f"Population SD (N=5): {pop_sd:.4f}")
print(f"Sample SD (N-1=4): {samp_sd:.4f}")
Output:
Population SD (N=5): 0.2135
Sample SD (N-1=4): 0.2387
You can reproduce these numbers with the standard deviation calculator or by pasting the snippet above.
Which One Should You Use?
Work through these questions in order.
Is the data set the complete group? If you measured every unit in the group you are describing, use the population formula. This is common in quality control on a finished batch, in a census, and in any situation where the group is closed and fully observed.
Are you estimating something larger? If the values are a subset and your goal is to say something about the wider group, use the sample formula. This covers most survey data, most experiments, and most process monitoring where measurements continue over time.
Are you reporting to someone who will run a test? Statistical tests assume the sample version. Reporting $\sigma$ where $s$ belongs understates uncertainty and can make results look more precise than they are [3].
Still unsure? Use the sample formula. It is the safer default because it does not pretend you have information you do not have. The cost of using it when the population formula was correct is a slightly conservative number. The cost of the reverse is an overconfident one.
The distinction between a sample and the population it represents is foundational across statistics, and it shapes how you interpret every summary measure you compute. For background on defining the group itself, see what is a population in statistics.
Common Mistakes
- Using the population formula on sample data. This is the most frequent error. It produces a standard deviation that is too small, which shrinks confidence intervals and inflates test statistics. Fix: check whether the data is a subset before you choose a function.
- Assuming "large sample" means "population." Size does not determine the formula. A 10,000-row survey is still a sample if it came from a larger group. Fix: base the choice on scope, not row count.
- Mixing the two in one report. Quoting a population standard deviation in one table and a sample standard deviation in another makes the numbers incomparable. Fix: state which formula you used, and use the same one throughout.
- Confusing standard deviation with standard error. The standard error describes the spread of a sample mean across repeated samples, not the spread of individual values. Fix: report the standard deviation for describing data and the standard error for describing an estimate. The differences are covered in standard deviation vs variance vs standard error.
- Letting software defaults decide for you. Excel's
STDEVandSTDEV.Sreturn the sample version, whileSTDEV.Preturns the population version. Python'sstatistics.stdevis the sample version. Fix: name the function explicitly in your code and your write-up. - Reporting too many decimal places. A standard deviation of 0.2135 grams implies precision the measurements may not support. Fix: round to the same precision as the raw data.
Limitations
Neither formula tells you whether your sample is representative. A sample standard deviation computed from a biased sample, such as a convenience sample or one with high nonresponse, estimates the wrong thing no matter how carefully you apply the $n-1$ correction. The formula corrects for the mathematical effect of sampling, not for flaws in how the sample was drawn [2].
Both measures are also sensitive to outliers. A single extreme value can dominate the sum of squared deviations and inflate the result substantially. When your data has heavy tails or obvious outliers, the standard deviation may misrepresent typical spread, and the interquartile range or median absolute deviation can be more informative. These alternatives sit alongside the standard deviation in the broader family of measures of variability.
Finally, the $n-1$ correction assumes independent observations drawn from a single population. For clustered data, repeated measures on the same subject, or time series with autocorrelation, the effective sample size is smaller than the count of rows, and neither formula accounts for that on its own.
Frequently Asked Questions
Is sample standard deviation always larger than population standard deviation?
Yes, for the same data set. The only difference between the two formulas is the denominator, and $n-1$ is always smaller than $n$ when $n$ is greater than 1. A smaller denominator produces a larger variance, so the square root is larger too. In the worked example above, the sample value was 0.2387 against a population value of 0.2135.
Why do we divide by n-1 instead of n?
Dividing by $n$ in a sample systematically underestimates the population variance, because sample values cluster closer to the sample mean than to the true population mean. Dividing by $n-1$ corrects that downward bias, making the sample variance an unbiased estimator [1]. The correction matters most for small samples and becomes negligible as $n$ grows.
Which standard deviation does Excel calculate by default?
Excel's STDEV, STDEV.S, and STDEVA functions all return the sample standard deviation using $n-1$. The population versions are STDEV.P and STDEVPA, which use $N$. If you want the population value, you must call it explicitly. The same split exists in Python, where statistics.stdev is the sample version and statistics.pstdev is the population version.
Can I use the population formula if my sample is very large?
You can, and the numerical difference will be tiny, but the interpretation is still wrong. A large sample is still a sample, and the value you compute is still an estimate of the population spread. Reporting it as $\sigma$ claims a certainty you do not have. Use the sample formula and let the narrow gap between the two speak for itself.
What is the difference between sample standard deviation and standard error?
The sample standard deviation describes how much individual values vary around the mean. The standard error describes how much the sample mean itself would vary if you repeated the study many times, and it equals the standard deviation divided by the square root of the sample size. They answer different questions and belong in different places in a results section.
References
- Altman DG, Bland JM (2005). Standard deviations and standard errors. BMJ
- 3.1.3.4. Populations and Sampling
- 7.3.2. Do two processes have the same standard deviation?
Further Reading
- NIST/SEMATECH e-Handbook of Statistical Methods
- OpenStax. Introductory Statistics 2e
- Krzywinski M, Altman N (2013). Importance of being uncertain. Nature Methods
Related Articles
- Mean vs Median: Differences and When to Use Each
- Sample Datasets for Practice: Where to Find and How to Use Them
- Standard Deviation of a Binomial Distribution: Formula and Example
- Mean and Standard Deviation: Definition, Formula and Examples
- Correlation vs Covariance: Differences and When to Use Each
- Standard Deviation vs Variance vs Standard Error: What Each Measures and When to Report It
- ANOVA vs. t-Test: Choosing the Right Statistical Test
- Sample size standard deviation formula