Percentage Increase Formula in Excel: How to Calculate
By Dr. Zubair Khalid, DVM, MS, PhD ·
The percentage increase in Excel formula is =(new value - old value) / old value. Excel returns a decimal such as 0.25, and you format that cell as a percentage to display 25%. The same formula handles decreases, which appear as negative percentages.
Quick Answer
- The formula is
=(new value - old value) / old value, where the old value is the starting point you divide by. - In a table, the new value is usually the current row and the old value is the row above, for example
=(B3-B2)/B2. - Excel shows the raw result as a decimal. Format the cell as Percentage to display it as 25% or -10%.
- A positive result means an increase, a negative result means a decrease.
- Copy the formula down the column so each row compares against the previous row.
The Formula
The percent change formula compares two values and expresses the difference as a share of the starting value.
$$ \text{Percent change} = \frac{\text{New value} - \text{Old value}}{\text{Old value}} $$
Each part does a specific job:
- New value: the later or current number, such as this month's sales.
- Old value: the earlier or baseline number, such as last month's sales.
- New value minus old value: the absolute change. Positive means growth, negative means decline.
- Divide by old value: converts that change into a fraction of where you started.
The result is a decimal. Multiply by 100 to get a percentage, or let Excel's Percentage format do it for you. This is the same logic behind the general percentage formula, applied to two points in time.
How to Calculate It Step by Step
- Put your old value in one cell and your new value in another. For a time series, list them down a column in date order.
- Click the cell where you want the result.
- Type the formula with your own cell references, for example
=(B3-B2)/B2. - Press Enter. Excel returns a decimal such as 0.25.
- Select the result cell, then go to Home > Number Format dropdown and choose Percentage.
- To show more precision, click Home > Number Format > Increase Decimal. Two clicks give two decimal places.
- Copy the formula down the column so each row compares with the row above it.
If you need to subtract values first, the mechanics are the same as any Excel subtraction formula. The division step is what turns a plain difference into a percentage.
Worked Example
This example uses a six-month sales table where each month is compared with the month before it.
| A | B | C | |
|---|---|---|---|
| 1 | Month | Sales | MoM % Change |
| 2 | Jan | 12000 | |
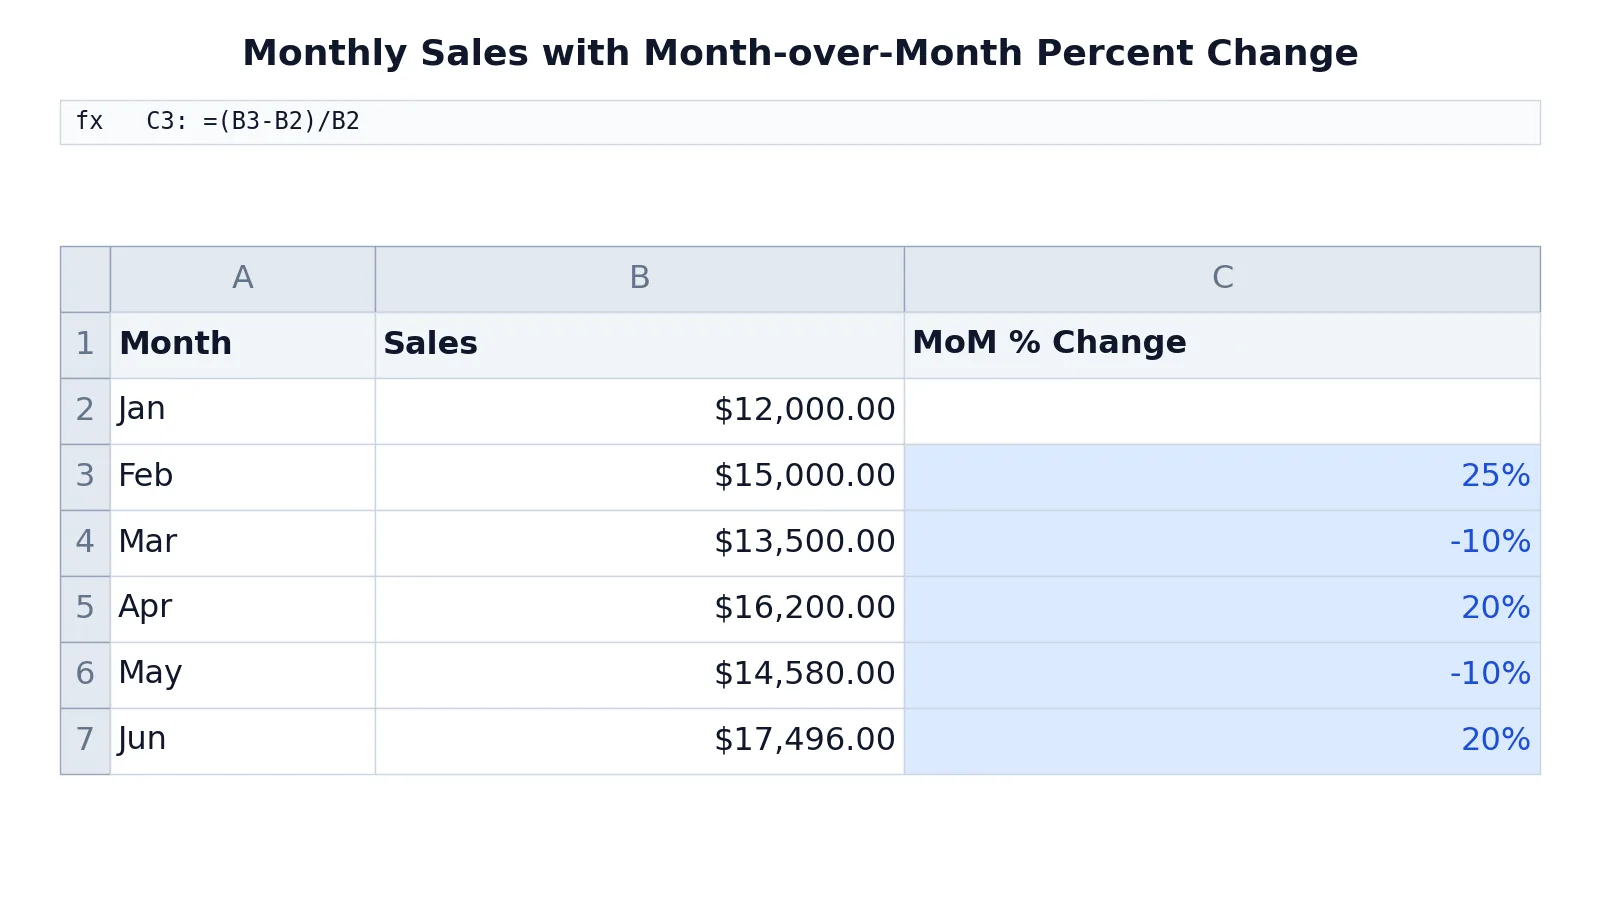
| 3 | Feb | 15000 | =(B3-B2)/B2 -> displays 25% |
| 4 | Mar | 13500 | =(B4-B3)/B3 -> displays -10% |
| 5 | Apr | 16200 | =(B5-B4)/B4 -> displays 20% |
| 6 | May | 14580 | =(B6-B5)/B5 -> displays -10% |
| 7 | Jun | 17496 | =(B7-B6)/B6 -> displays 20% |
The steps that produce this sheet:
- Subtract January sales from February sales, then divide by January sales to get the month-over-month change in C3.
- Copy the same formula down to each row so each month is compared with the previous month.
- Format the result as a percentage so 0.25 displays as 25%.
The interface steps:
- Select C3:C7, then go to Home > Number Format dropdown and choose Percentage.
- With C3:C7 still selected, click Home > Number Format > Increase Decimal twice to show two decimal places.
The figure below shows the finished table. Notice that February's 25% gain and March's 10% drop use the identical formula. Only the inputs change. That is the whole point of a relative measure: it scales the change to the size of the starting value.
How to Interpret the Result
A positive percentage means the value grew from the old period to the new one. A negative percentage means it fell. In the example, February sales rose 25% over January, then March sales dropped 10% from February.
The size of the percentage depends on the base. A 3,000-unit jump from 12,000 is 25%, but the same 3,000-unit jump from 30,000 would be only 10%. Always check what the denominator is before you compare two percentages.
When a value falls and then rises by the same percentage, you do not return to the starting point. In the table, sales drop from 15,000 to 13,500, a 10% decline, then rise 20% to 16,200. The 20% is applied to the smaller base, so the recovery is larger than the drop in percentage terms. This is why percentage decrease and increase are not symmetric.
Doing It in Software (Excel, R or Python)
In Excel, the formula is plain arithmetic. There is no built-in percent change function, so you write the division yourself. The same pattern works in Google Sheets.
In R, you can compute a vector of percent changes directly:
sales <- c(12000, 15000, 13500, 16200, 14580, 17496)
pct <- diff(sales) / head(sales, -1) * 100  # percent change between consecutive values
pct
In Python with pandas, the pct_change method does the same job:
import pandas as pd
sales = pd.Series([12000, 15000, 13500, 16200, 14580, 17496])
pct = sales.pct_change() * 100  # percent change from the previous row
print(pct)
Both produce the same sequence of changes as the Excel column. If you want to check a single pair of numbers by hand, a percentage and percent change calculator is faster than rebuilding the sheet.
Common Mistakes
- Dividing by the new value instead of the old one. The base must be the starting value.
=(B3-B2)/B3gives a different, wrong number. Fix it by always dividing by the earlier cell. - Forgetting to format as a percentage. The cell shows 0.25 instead of 25%. Select the range and choose Percentage from the Number Format dropdown.
- Mixing up the order of subtraction.
=(B2-B3)/B2flips the sign, so an increase looks like a decrease. Keep new minus old. - Dividing by zero or a blank cell. If the old value is 0 or empty, Excel returns a
#DIV/0!error. Handle it with a check such as=IF(B2=0,"",(B3-B2)/B2). - Comparing percentages with different bases. A 50% rise on a small number can be a tiny absolute change. Report the raw values alongside the percentages.
- Copying a formula without locking references. If you reference a fixed baseline cell, use
$B$2so the reference does not shift as you fill down.
Limitations
Percent change only works when the base is a meaningful, non-zero number. If the old value is zero, the change is undefined, and Excel will error out. If the old value is negative, the percentage can be misleading because the sign flips in ways that are hard to read.
Percentages also hide absolute size. A 100% increase from 2 to 4 is trivial in real terms, while a 5% increase on a million units is large. Always pair the percentage with the underlying numbers before you draw a conclusion. For very small bases, the percentage can swing wildly from one period to the next and say more about the base than about any real trend.
Frequently Asked Questions
What is the formula for percentage increase in Excel?
The formula is =(new value - old value) / old value. Put the new value and old value in separate cells, then reference them. Format the result cell as a percentage to display the answer as a percent instead of a decimal.
How do I format the result as a percentage in Excel?
Select the cells with your results, then go to Home > Number Format dropdown and choose Percentage. To control decimal places, use Home > Number Format > Increase Decimal or Decrease Decimal. The underlying value does not change, only how it is displayed.
Why does my percentage increase show a negative number?
A negative result means the new value is smaller than the old value, so it is a decrease. If you expected an increase, check that you subtracted in the right order. The formula must be new minus old, divided by old.
Can I use the same formula for percentage difference?
The percent change formula compares two values over time or across a baseline. A percentage difference formula often compares two values without a clear baseline, and it may divide by the average of the two instead. Pick the version that matches your question.
How do I calculate percentage increase across a whole column?
Enter the formula in the first result cell, then copy it down the column. Each row compares its own value with the row above. If you reference a single fixed baseline, lock that cell with dollar signs, for example $B$2, before filling down.
References
This article draws on the standard references listed under Further Reading.
Further Reading
- McCullough B, Heiser DA (2008). On the accuracy of statistical procedures in Microsoft Excel 2007. Computational Statistics & Data Analysis
- Broman KW, Woo KH (2018). Data Organization in Spreadsheets. The American Statistician
- Ziemann M, Eren Y, El-Osta A (2016). Gene name errors are widespread in the scientific literature. Genome Biology
- Microsoft Support: Excel help and learning
- Abeysooriya M, Soria M, Kasu MS et al. (2021). Gene name errors: Lessons not learned. PLOS Computational Biology
- Wilson G, Bryan J, Cranston K et al. (2017). Good enough practices in scientific computing. PLOS Computational Biology