Percentage Decrease Formula: How to Calculate
By Dr. Zubair Khalid, DVM, MS, PhD ·
The percentage decrease formula measures how much a value has fallen relative to where it started. You subtract the new value from the original value, divide by the original value, and multiply by 100. This article shows the formula, walks through a real calculation, and covers how to run it in Excel and Python.
Quick Answer
- Percentage decrease = $(\text{Original} - \text{New}) \div \text{Original} \times 100$.
- The denominator is always the original (starting) value, never the new value.
- A result of 22.5% means the value fell by 22.5% of its starting amount.
- The same formula gives a negative number if the value actually rose, which signals an increase instead.
- You can check the answer by multiplying the original value by $(1 - \text{decrease})$ to recover the new value.
The Formula
The percentage decrease formula compares the size of a drop to the value you started with:
$$ \text{Percentage Decrease} = \frac{\text{Original Value} - \text{New Value}}{\text{Original Value}} \times 100 $$
Each symbol and term means the following:
| Term | Meaning |
|---|---|
| Original Value | The starting value, before the change. This is the base of the comparison. |
| New Value | The value after the change, which is smaller than the original for a decrease. |
| Original Value - New Value | The absolute difference, or the raw size of the drop. |
| Original Value (denominator) | The reference point. Dividing by it converts the drop into a fraction of the starting amount. |
| × 100 | Converts the decimal fraction into a percentage. |
If you want the change as a decimal instead of a percent, stop before multiplying by 100. The fraction $\frac{\text{Original} - \text{New}}{\text{Original}}$ is the proportional decrease.
How to Calculate It Step by Step
- Identify the original value. This is the value before the change, such as last month's sales or the starting price.
- Identify the new value. This is the value after the change.
- Subtract the new value from the original value. This gives the size of the decrease.
- Divide the decrease by the original value. This gives the decrease as a fraction of the starting amount.
- Multiply by 100 to convert the fraction to a percentage.
- Round to a sensible number of decimal places for your context.
If the new value is larger than the original, the subtraction produces a negative number and the final result is negative. A negative percentage decrease is really a percentage increase. You can read more about the opposite direction in the percentage increase formula in Excel.
Worked Example
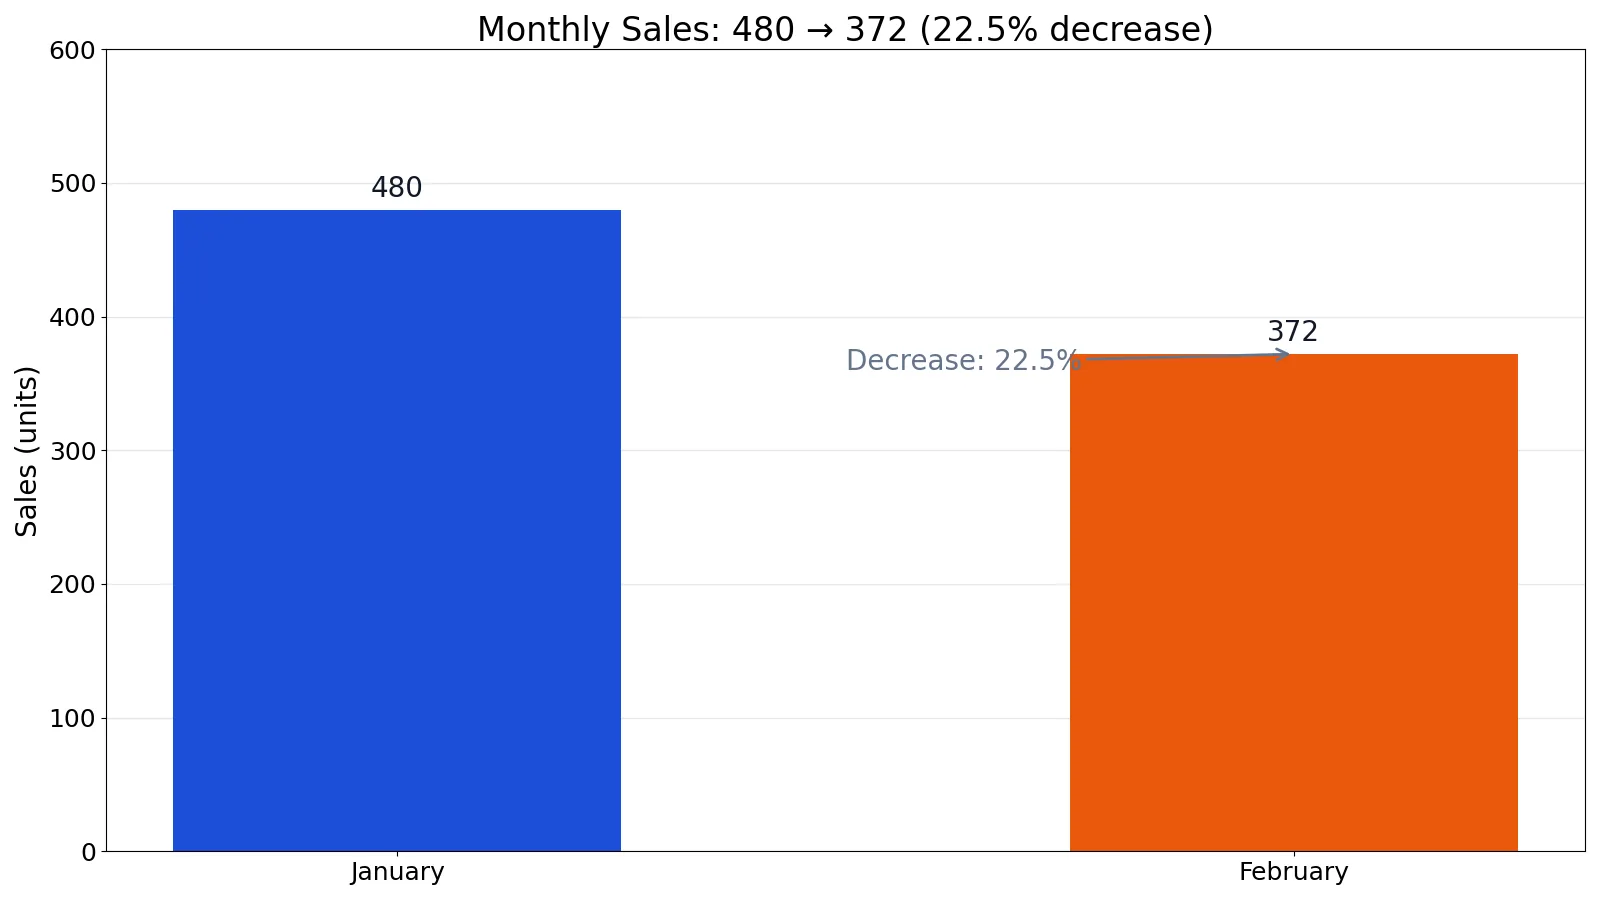
The dataset is monthly sales for a small retail shop over two months.
| Month | Sales |
|---|---|
| January | 480 |
| February | 372 |
Now apply the formula step by step.
| Step | Calculation | Result |
|---|---|---|
| Original value (January sales) | 480 | 480 |
| New value (February sales) | 372 | 372 |
| Difference (decrease) | 480 - 372 | 108 |
| Divide by original | 108 ÷ 480 | 0.2250 |
| Multiply by 100 | 0.2250 × 100 | 22.5000 |
| Rounded percentage decrease | 22.5 | 22.5% |
Sales fell from 480 to 372, a drop of 108 units. As a share of the January figure, that drop is 0.2250, or 22.5%. So February sales were 22.5% lower than January sales.
Here is the same calculation in Python:
old = 480
new = 372
pct = (old - new) / old * 100
print(pct)  # 22.5
Output:
22.5You can confirm the result by reversing it. Multiply the original value by $(1 - 0.225)$: $480 \times 0.775 = 372$, which matches the February figure.
How to Interpret the Result
A percentage decrease tells you the size of a drop relative to the starting point. A 22.5% decrease means the new value is 77.5% of the original, because $100\% - 22.5\% = 77.5\%$. That remaining share is often more useful than the decrease itself when you are comparing levels.
Keep the base in mind. A 50% decrease from 100 is a drop of 50 units. A 50% decrease from 10,000 is a drop of 5,000 units. The percentage is identical, but the real-world impact is very different. Always report the absolute change alongside the percentage when the size matters.
Percentages also do not simply add up. If a value falls 20% and then falls another 20%, the total decrease is not 40%. The second drop applies to the already-reduced value, so the combined decrease is about 36%. This is why you should compute each change against its own original value.
Doing It in Software (Excel, R or Python)
In Excel, you can write the formula directly against two cells. If the original value is in A2 and the new value is in B2, the formula is:
=(A2-B2)/A2Format the cell as a percentage to display the result, or multiply by 100 to keep it as a plain number. The decrease by percentage formula in Excel covers related setups, and the Excel subtraction formula guide explains the subtraction step in more detail.
In Python, the arithmetic is the same as the snippet above. In R, you can compute it in one line:
old <- 480
new <- 372
pct <- (old - new) / old * 100  # 22.5
If you just want a quick number without writing any code, the Percentage & Percent Change Calculator takes two values and returns the percent change.
Common Mistakes
- Dividing by the new value instead of the original. The denominator must be the starting value. Dividing by the new value inflates the result and gives the wrong base.
- Forgetting to multiply by 100. Without it, you have a decimal fraction like 0.225, not a percentage.
- Mixing up the order of subtraction. Subtract the new value from the original. Reversing it flips the sign and turns a decrease into an increase.
- Treating a negative result as an error. A negative percentage decrease just means the value went up. Report it as an increase instead.
- Adding successive percentage changes. Two 20% drops do not make 40%. Apply each change to its own base.
- Rounding too early. Keep full precision through the division, then round only the final percentage.
Limitations
The percentage decrease formula only describes two points in time. It says nothing about what happened between them, so a value that fell, recovered, and fell again can show the same decrease as one that dropped steadily. It also cannot tell you why the change happened or whether it will continue.
Percentages can mislead when the base is small. A drop from 4 to 2 is a 50% decrease, but it is only 2 units. Reporting the percentage alone can make a trivial change look dramatic. Pair the percentage with the raw numbers whenever the absolute size matters. The formula also assumes both values are measured the same way. Comparing values from different units or definitions produces a number that looks valid but means nothing.
Frequently Asked Questions
What is the percentage decrease formula?
The formula is $(\text{Original} - \text{New}) \div \text{Original} \times 100$. You subtract the new value from the original, divide by the original, and multiply by 100. The result is the drop expressed as a percentage of the starting value.
How do I calculate percentage decrease between two numbers?
Subtract the smaller number from the larger one, divide by the larger one if it is the original value, then multiply by 100. For example, from 480 to 372: $480 - 372 = 108$, then $108 \div 480 = 0.225$, then $0.225 \times 100 = 22.5\%$.
Can percentage decrease be negative?
Yes. If the new value is larger than the original, the subtraction gives a negative number and the result is negative. That negative value is a percentage increase, so report it as such. The sign simply tells you the direction of the change.
What is the difference between percentage decrease and percentage change?
Percentage change is the general term that covers both directions. Percentage decrease is the specific case where the value falls. The arithmetic is the same, but a decrease produces a positive number under the decrease formula and an increase produces a negative one.
How do I calculate percentage decrease in Excel?
Put the original value in one cell and the new value in another, then use a formula like =(A2-B2)/A2. Format the result as a percentage, or multiply by 100 for a plain number. Excel handles the arithmetic the same way the manual formula does.
References
This article draws on the standard references listed under Further Reading.
Further Reading
- NIST/SEMATECH e-Handbook of Statistical Methods
- OpenStax. Introductory Statistics 2e
- Krzywinski M, Altman N (2013). Importance of being uncertain. Nature Methods
- Krzywinski M, Altman N (2013). Significance, P values and t-tests. Nature Methods
- Wasserstein RL, Lazar NA (2016). The ASA Statement on p -Values: Context, Process, and Purpose. The American Statistician
- Greenland S, Senn SJ, Rothman KJ et al. (2016). Statistical tests, P values, confidence intervals, and power: a guide to misinterpretations. European Journal of Epidemiology
Related Articles
- Decrease by Percentage Formula in Excel (Step by Step)
- How to Calculate a Percentage: Formula and Examples
- Percentage Increase Formula in Excel: How to Calculate
- Excel Subtraction Formula: How to Subtract in Excel
- Percent Recovery Formula: Definition and Examples
- Test Statistic Formula: How to Calculate and Use It