Null and Alternative Hypotheses: Definition and Examples
By Dr. Zubair Khalid, DVM, MS, PhD ·
The null and alternative hypotheses are given as a pair of competing statements about a population parameter, and together they cover every possible outcome. The null hypothesis ($H_0$) says there is no effect or no difference, and the alternative hypothesis ($H_1$ or $H_a$) says there is one. You test the null, then decide whether the data give you enough evidence to reject it.
Quick Answer
- The null hypothesis ($H_0$) is a statement of "no effect" or "no difference" about a population parameter [1].
- The alternative hypothesis ($H_1$ or $H_a$) is the negation of the null, and it always uses an inequality: $\neq$, $<$, or $>$ [2].
- Both hypotheses must refer to the same parameter, and the null always contains an equal sign [2].
- You write the hypotheses before you collect data, based on the research question [2].
- You never prove either hypothesis. You either reject $H_0$ or fail to reject it [3][1].
What the Null and Alternative Hypotheses Mean
In plain terms, the null hypothesis is the boring explanation. It says any pattern you see in your sample is just random chance, not a real effect in the population. The alternative hypothesis is the interesting explanation. It says something real is going on.
The precise statistical definition is tighter. The null hypothesis is a statement about a population parameter, such as a mean $\mu$ or a proportion $p$, that specifies a single value or a single equality. The alternative hypothesis is the set of parameter values that remain once the null is removed. The two are mutually exclusive statements, so if one is false, the other is true [1].
This pairing matters because hypothesis testing works by assuming $H_0$ is true, then asking how likely your sample result would be under that assumption [4]. If the result would be very unlikely, you reject $H_0$ in favor of $H_1$. If it would not be unlikely, you retain $H_0$.
One subtle point trips up many people. When you reject the null, you have not proven the alternative. You tested the null hypothesis, not the alternative, so the correct phrasing is that you found evidence against $H_0$ [3]. The alternative hypothesis is often the research hypothesis, but the test itself is aimed at the null [3].
How It Works
Every hypothesis test follows the same skeleton. You state the pair, choose a test statistic, and compare what you observed to what $H_0$ predicts.
For a one-sample test of a mean, the pair looks like this:
$$H_0: \mu = \mu_0$$ $$H_1: \mu \neq \mu_0$$
For a two-sample test comparing two means, the pair becomes:
$$H_0: \mu_1 = \mu_2$$ $$H_1: \mu_1 \neq \mu_2$$
Here is what each symbol means.
| Symbol | Meaning |
|---|---|
| $H_0$ | Null hypothesis, the claim of no effect |
| $H_1$ or $H_a$ | Alternative hypothesis, the claim of an effect |
| $\mu$ | Population mean |
| $\mu_0$ | The specific value assumed under the null |
| $\mu_1, \mu_2$ | Population means of two groups |
| $\neq$ | "Not equal to," a two-tailed alternative |
| $<$ or $>$ | "Less than" or "greater than," a one-tailed alternative |
The test statistic measures how far your sample result sits from the null value, in units of standard error. For a two-sample comparison, the Welch statistic is:
$$t = \frac{\bar{x}_1 - \bar{x}_2}{\sqrt{\frac{s_1^2}{n_1} + \frac{s_2^2}{n_2}}}$$
where $\bar{x}_1$ and $\bar{x}_2$ are the sample means, $s_1^2$ and $s_2^2$ are the sample variances, and $n_1$ and $n_2$ are the sample sizes. The denominator is the standard error of the difference. A large absolute $t$ means the observed difference is far from what $H_0$ predicts.
If you are still building the logic of the whole procedure, see What Is Hypothesis Testing? Steps, Errors and Examples.
Worked Example
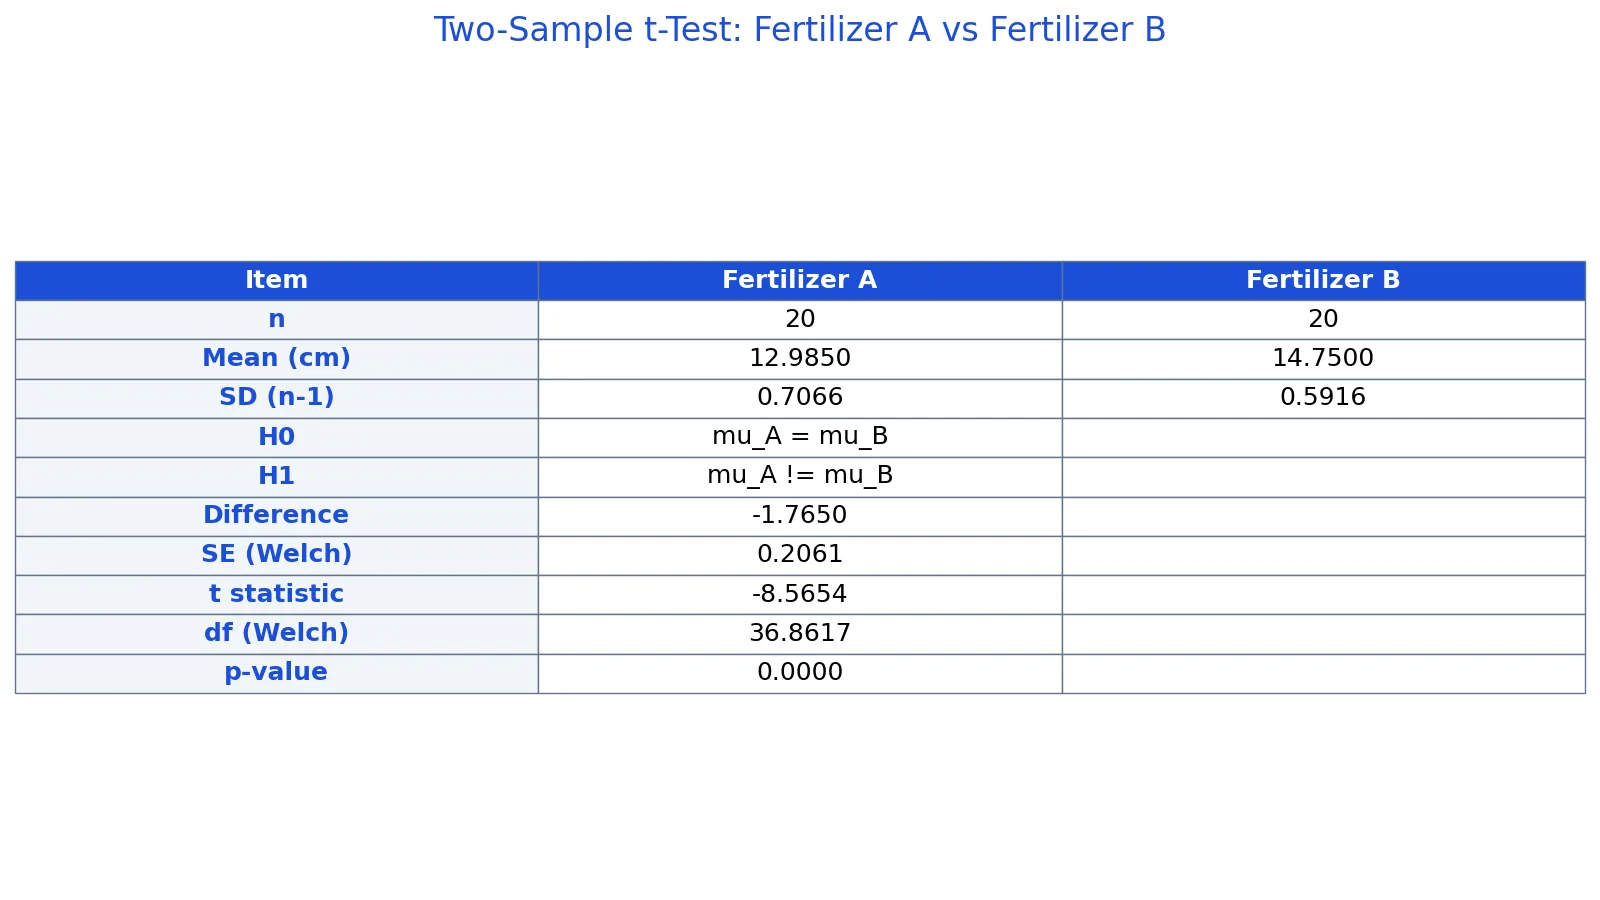
A researcher grows 20 plants under Fertilizer A and 20 under Fertilizer B and records height in centimeters. The question is whether the two fertilizers produce different mean heights.
The data:
| Fertilizer | Heights (cm) |
|---|---|
| A | 12.1, 13.4, 11.8, 14.2, 12.9, 13.1, 12.5, 13.8, 12.2, 13.6, 12.7, 13.3, 11.9, 14.0, 12.4, 13.7, 12.6, 13.2, 12.8, 13.5 |
| B | 14.3, 15.1, 13.9, 15.6, 14.7, 14.9, 14.1, 15.3, 14.4, 15.0, 14.6, 15.2, 13.8, 15.5, 14.2, 15.4, 14.5, 14.8, 14.0, 15.7 |
The hypotheses are:
$$H_0: \mu_A = \mu_B$$ $$H_1: \mu_A \neq \mu_B$$
Step by step:
- Sample sizes: $n_A = 20$ and $n_B = 20$.
- Sample means: $\bar{x}_A = 12.9850$ and $\bar{x}_B = 14.7500$.
- Sample standard deviations: $s_A = 0.7066$ and $s_B = 0.5916$.
- Observed difference: $\bar{x}_A - \bar{x}_B = 12.9850 - 14.7500 = -1.7650$.
- Welch standard error: $SE = \sqrt{0.4992/20 + 0.3500/20} = 0.2061$.
- Welch $t$ statistic: $t = -1.7650 / 0.2061 = -8.5654$.
- Welch degrees of freedom: $df = 36.8617$.
- Two-sided p-value: $p = 0.0000$.
For comparison, the pooled Student $t$ gives $t = -8.5654$ with $df = 38$ and $p = 0.0000$.
from scipy import stats
fertA = [12.1, 13.4, 11.8, 14.2, 12.9, 13.1, 12.5, 13.8, 12.2, 13.6,
         12.7, 13.3, 11.9, 14.0, 12.4, 13.7, 12.6, 13.2, 12.8, 13.5]
fertB = [14.3, 15.1, 13.9, 15.6, 14.7, 14.9, 14.1, 15.3, 14.4, 15.0,
         14.6, 15.2, 13.8, 15.5, 14.2, 15.4, 14.5, 14.8, 14.0, 15.7]
t, p = stats.ttest_ind(fertA, fertB, equal_var=False)
print(f"t = {t:.4f}, p = {p:.4f}")  # t = -8.5654, p = 0.0000
Output:
t = -8.5654, p = 0.0000| Group | n | Mean (cm) | SD (cm) |
|---|---|---|---|
| Fertilizer A | 20 | 12.9850 | 0.7066 |
| Fertilizer B | 20 | 14.7500 | 0.5916 |
| Comparison | $t = -8.5654$ | $df = 36.8617$, $p = 0.0000$ |
How to Interpret It
The p-value is the probability of getting a result at least as extreme as yours if $H_0$ were true [4]. Here $p = 0.0000$ to four decimals, which is far below any conventional threshold such as 0.05. You reject $H_0$ and conclude the fertilizers do not give equal mean plant heights.
Two things to keep straight. First, rejecting $H_0$ does not prove $H_1$ [3]. It means the data are unlikely under the null. Second, the decision is not guaranteed to be correct. A Type I error happens when you reject a true null, and a Type II error happens when you fail to reject a false null [4].
The direction of the difference is also worth reading. The negative $t$ reflects that group A's mean is lower than group B's. If your alternative had been one-tailed, such as $H_1: \mu_A < \mu_B$, the p-value would be half of the two-sided value, but only if the observed difference points in the predicted direction.
For the decision rule in more detail, see When to Reject the Null Hypothesis: Definition and Examples.
When to Use It (and when not to)
Use a null and alternative pair whenever you are making an inference about a population parameter from sample data. That covers one-sample tests, two-sample tests, ANOVA for more than two means, tests of Pearson's $r$, and proportion tests [4].
Do not use this framework when you are only describing your sample. If you have the whole population, there is nothing to infer and no hypothesis to test. Do not use it to fish for significant results by testing many pairs after seeing the data. The hypotheses should be set before data collection [2].
Also be careful with the direction. A two-tailed alternative, $\mu_1 \neq \mu_2$, is the safe default because it does not commit you to a direction in advance. A one-tailed alternative is defensible only when the research question genuinely predicts one direction, and you should decide that before looking at the data. The choice between these is covered in Directional vs. Non-Directional Hypotheses.
Null vs Alternative Hypothesis
The two are partners, not rivals. The null is what you assume, and the alternative is what you accept if the data push you away from that assumption.
| Feature | Null hypothesis ($H_0$) | Alternative hypothesis ($H_1$) |
|---|---|---|
| Claim | No effect or no difference | Some effect or difference |
| Symbol | Always contains $=$, $\leq$, or $\geq$ | Always contains $\neq$, $<$, or $>$ [2] |
| Role in test | Assumed true, then tested | Accepted only if $H_0$ is rejected |
| Example | $\mu_A = \mu_B$ | $\mu_A \neq \mu_B$ |
| Typical source | Default or status quo | Research question [2] |
If you want a deeper look at the second column, see Alternative Hypothesis: Definition, Examples and How to Write It.
Common Mistakes
- Writing the alternative with an equals sign. The alternative must be an inequality. Fix: use $\neq$, $<$, or $>$, never $=$ [2].
- Stating hypotheses about the sample instead of the population. $H_0: \bar{x}_1 = \bar{x}_2$ is wrong because sample means are known. Fix: write the hypotheses about $\mu$, the population parameter.
- Choosing a one-tailed test after seeing the data. This inflates your false positive rate. Fix: decide the direction before collecting data.
- Saying you proved the alternative. A rejected null is evidence against $H_0$, not proof of $H_1$ [3]. Fix: say "the data provide evidence against the null."
- Letting the hypotheses overlap or leave gaps. The pair must cover all outcomes [3]. Fix: check that $H_1$ is the exact negation of $H_0$.
- Confusing statistical significance with practical importance. A tiny difference can be significant with a large sample. Fix: report the effect size alongside the p-value.
Limitations
Hypothesis testing tells you whether a result is unlikely under the null. It does not tell you how large the effect is, whether the effect matters in practice, or whether your study was designed well. A significant p-value from a biased sample is still biased.
The framework also depends on assumptions. The Welch test used above assumes roughly independent observations and approximately normal distributions, or large enough samples for the central limit theorem to help. Violating those assumptions can distort the p-value. And because the null is a point claim, it is almost never exactly true in the real world, which is why "reject" often just means "the sample is large enough to detect a small difference."
Frequently Asked Questions
What is the difference between the null and alternative hypotheses?
The null hypothesis states no effect or no difference and always contains an equality. The alternative hypothesis states the opposite and always contains an inequality. Together they are mutually exclusive and cover every possible value of the parameter [1].
Can the null and alternative hypotheses both be true?
No. They are mutually exclusive statements about the same parameter [1]. If the null is false, the alternative is true, and the reverse also holds. That is why rejecting one means accepting the other as the working explanation.
Do I always need a null hypothesis?
For formal hypothesis testing, yes. The test is built around the null, and the p-value is defined as the probability of the data under that null [4]. Without a null, there is nothing to compute a p-value against.
What does it mean if I fail to reject the null?
It means your data were not unlikely enough under $H_0$ to justify rejecting it. It does not mean the null is true or proven [1]. It may simply mean your sample was too small to detect a real effect.
How do I choose between a one-tailed and two-tailed alternative?
Use a two-tailed alternative when you only expect a difference, in either direction. Use a one-tailed alternative when your research question predicts a specific direction before data collection. The one-tailed p-value is half the two-tailed value when the effect points the predicted way.
References
- Statistical hypothesis test - Wikipedia
- Hypothesis Testing (1 of 5) - Concepts in Statistics
- 8.1: The null and alternative hypotheses - Statistics LibreTexts/08%3A_Inferential_Statistics/8.1%3A_The_null_and_alternative_hypotheses)
- Key Takeaways and Exercises - Research Methods in Psychology
Further Reading
- NIST/SEMATECH e-Handbook of Statistical Methods
- Wasserstein RL, Lazar NA (2016). The ASA Statement on p -Values: Context, Process, and Purpose. The American Statistician
Related Articles
- When to Reject the Null Hypothesis: Definition and Examples
- Alternative Hypothesis: Definition, Examples and How to Write It
- What Is Hypothesis Testing? Steps, Errors and Examples
- Assumptions of Linear Regression: Definition and Examples
- Directional vs. Non-Directional Hypotheses
- Specific Aims vs. Hypotheses
- How to Write a Directional Hypothesis: A Guide with Biology Examples