Alternative Hypothesis: Definition, Examples and How to Write It
By Dr. Zubair Khalid, DVM, MS, PhD ·
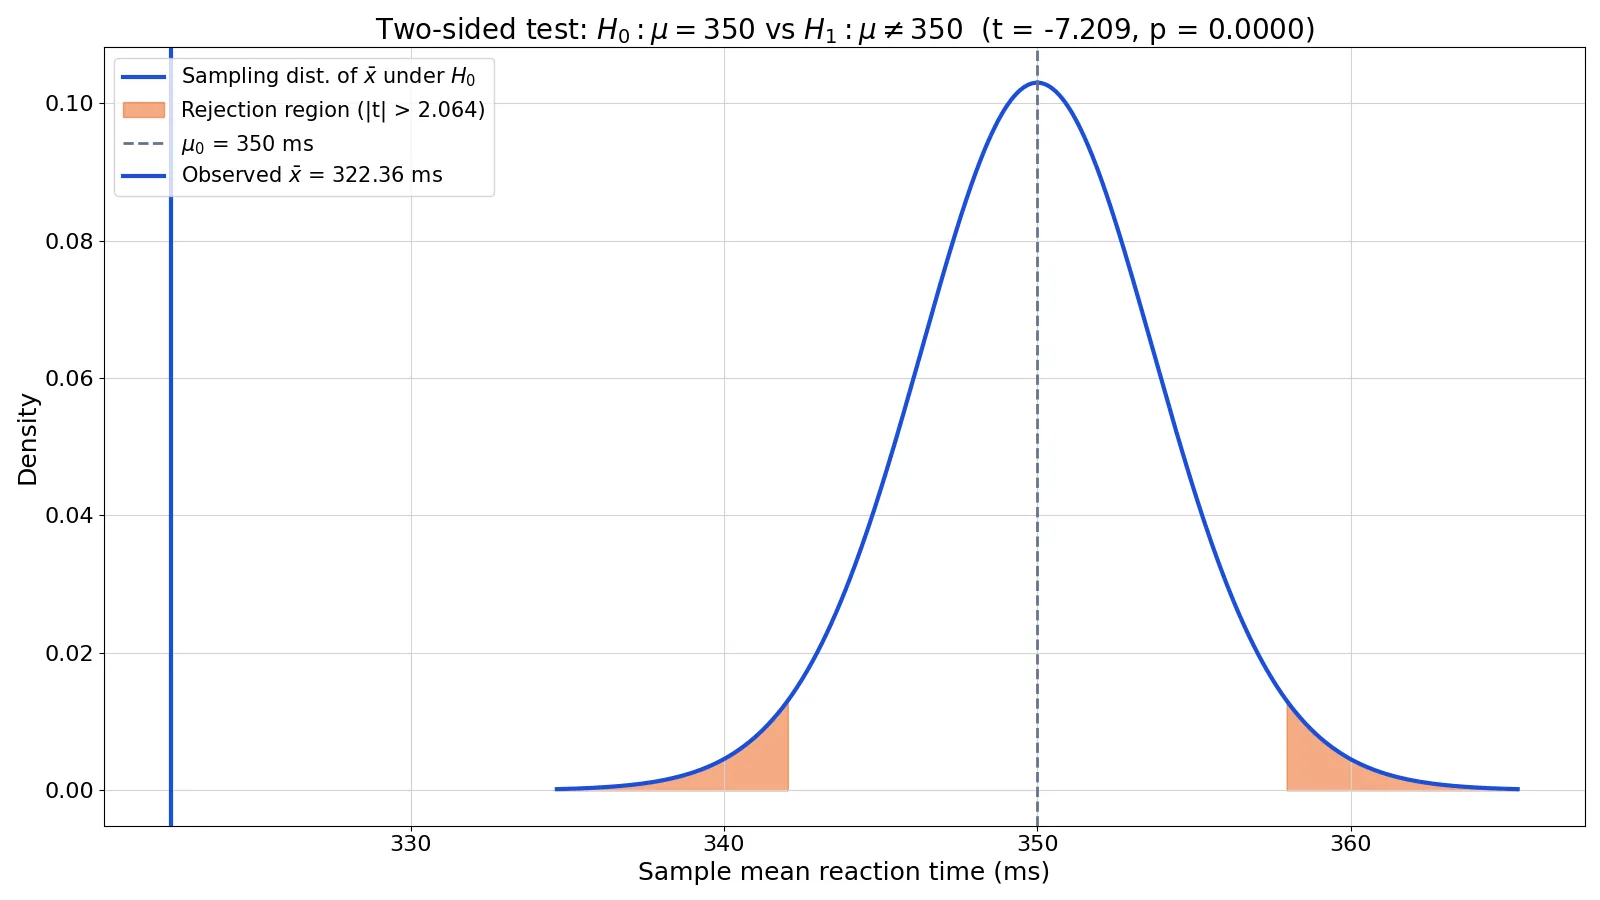
An alternative hypothesis is the claim that a statistical test is trying to find evidence for. It states that the population parameter differs from the value assumed under the null hypothesis, either in a specific direction or in any direction. Every hypothesis test pairs one alternative hypothesis with one null hypothesis, and the pair together defines what the test can and cannot detect.
Quick Answer
- The alternative hypothesis, written $H_A$ or $H_1$, is the research claim you want to support.
- The null hypothesis, $H_0$, is the skeptical default: no effect, no difference, or no change.
- A two-sided alternative says the parameter is different from the null value, using $\neq$.
- A one-sided alternative says it is greater than ($>$) or less than ($<$) the null value.
- The alternative hypothesis is never tested directly. You either reject $H_0$ in its favor or fail to reject $H_0$.
What Alternative Hypothesis Means
In plain terms, the alternative hypothesis is your prediction about the population. If you think a new teaching method changes test scores, or that a drug lowers cholesterol, or that reaction times differ from a known benchmark, that prediction is the alternative hypothesis.
The precise statistical definition is narrower. The alternative hypothesis ($H_A$) represents an alternative claim under consideration and is often represented by a range of possible parameter values [1]. It is a statement about a population parameter, such as a mean $\mu$, a proportion $p$, or a standard deviation $\sigma$, not about a sample statistic.
The null hypothesis ($H_0$) often represents either a skeptical perspective or a claim to be tested [1]. The two hypotheses contain opposing viewpoints, and together they must cover every possible value of the parameter [2]. That property is what makes the test logically complete: if the data are unlikely under $H_0$, the only remaining explanation is $H_A$.
A key point that trips people up: the alternative hypothesis is about the population, not the sample. You write $H_A: \mu \neq 350$, not $H_A: \bar{x} \neq 350$. The sample mean is evidence, not a hypothesis.
How It Works
Hypothesis testing works by assuming $H_0$ is true, then asking how surprising the observed data would be under that assumption. The alternative hypothesis defines which departures from $H_0$ count as surprising.
For a test of a population mean, the test statistic is:
$$t = \frac{\bar{x} - \mu_0}{s / \sqrt{n}}$$
Each symbol means:
- $\bar{x}$ is the sample mean.
- $\mu_0$ is the hypothesized population mean from $H_0$.
- $s$ is the sample standard deviation, computed with $n-1$ in the denominator.
- $n$ is the sample size.
- $s / \sqrt{n}$ is the standard error of the mean.
The alternative hypothesis determines how you convert that statistic into a p-value. If $H_A$ is two-sided ($\mu \neq \mu_0$), you double the tail probability. If $H_A$ is one-sided ($\mu > \mu_0$ or $\mu < \mu_0$), you use a single tail.
The three common forms for a mean are:
| Form | Null hypothesis | Alternative hypothesis | Tail used |
|---|---|---|---|
| Two-sided | $H_0: \mu = \mu_0$ | $H_A: \mu \neq \mu_0$ | Both |
| One-sided, greater | $H_0: \mu \leq \mu_0$ | $H_A: \mu > \mu_0$ | Upper |
| One-sided, less | $H_0: \mu \geq \mu_0$ | $H_A: \mu < \mu_0$ | Lower |
The same structure applies to proportions. For example, if a drug is claimed to reduce cholesterol by 25%, the alternative could be stated as $H_a: p \neq 0.25$ [2].
Worked Example
A lab records reaction times in milliseconds for 25 participants on a timed task. The historical benchmark for this task is 350 ms, and the researcher wants to know whether the current group differs from that benchmark.
The data:
| Participant | 1 | 2 | 3 | 4 | 5 | 6 | 7 | 8 | 9 | 10 | 11 | 12 | 13 |
|---|---|---|---|---|---|---|---|---|---|---|---|---|---|
| RT (ms) | 312 | 298 | 335 | 341 | 305 | 328 | 319 | 352 | 289 | 310 | 336 | 322 | 301 |
| Participant | 14 | 15 | 16 | 17 | 18 | 19 | 20 | 21 | 22 | 23 | 24 | 25 |
|---|---|---|---|---|---|---|---|---|---|---|---|---|
| RT (ms) | 347 | 315 | 330 | 294 | 358 | 308 | 326 | 333 | 299 | 344 | 317 | 340 |
Because the question is "different from," the hypotheses are two-sided:
$$H_0: \mu = 350 \qquad H_A: \mu \neq 350$$
Step by step:
- Sample size: $n = 25$.
- Sample mean: $\bar{x} = 8059 / 25 = 322.3600$ ms.
- Sample standard deviation: $s = 19.1700$ ms.
- Standard error: $SE = 19.1700 / \sqrt{25} = 3.8340$ ms.
- Test statistic: $t = (322.3600 - 350.0) / 3.8340 = -7.2092$.
- Degrees of freedom: $df = 25 - 1 = 24$.
- Two-sided p-value: $2 \times P(T > 7.2092) = 0.0000$.
- Critical value at $\alpha = 0.05$: $t_{0.975, 24} = 2.0639$.
- 95% confidence interval for $\mu$: $[314.4470, 330.2730]$.
The code:
from scipy import stats
rt = [312, 298, 335, 341, 305, 328, 319, 352, 289, 310, 336, 322, 301, 347, 315, 330, 294, 358, 308, 326, 333, 299, 344, 317, 340]
t, p = stats.ttest_1samp(rt, popmean=350)
print(t, p)  # -7.2092 0.0000
Output:
-7.209170222445748 1.8924089668269986e-07The observed mean of 322.36 ms sits far below the hypothesized 350 ms. The t statistic of -7.2092 is well beyond the critical value of 2.0639 in magnitude, and the p-value rounds to 0.0000. The 95% confidence interval, [314.4470, 330.2730], does not contain 350, which agrees with the test decision. You reject $H_0$ in favor of the alternative hypothesis that the population mean reaction time differs from 350 ms.
How to Interpret It
Rejecting $H_0$ means the data are unlikely under the null model, so you favor $H_A$. It does not prove $H_A$ is true, and it does not measure the size of the effect. The confidence interval does that job: here, plausible values for the population mean run from about 314 ms to about 330 ms.
Failing to reject $H_0$ means the data are consistent with the null. It does not prove the null is true, and it does not prove there is no effect. It often just means the sample was too small or the effect too small to detect.
The direction of the alternative hypothesis changes the p-value, not the data. A two-sided test splits $\alpha$ across both tails. A one-sided test puts all of $\alpha$ in one tail, which makes it easier to reject in that direction and impossible to reject in the other. That is why you should choose the direction before you look at the data.
For a fuller treatment of the decision step, see when to reject the null hypothesis.
When to Use It (and when not to)
Use a two-sided alternative when your research question is "is there a difference?" with no prior expectation about direction. This is the safer default and the standard in most confirmatory research.
Use a one-sided alternative when theory, prior evidence, or the design of the study justifies a single direction. A one-sided test is defensible when a result in the opposite direction would be treated as a null result anyway, such as testing whether a new process is faster than the old one.
Do not use a one-sided test to rescue a result that failed a two-sided test. Do not switch direction after seeing the data. Do not write a one-sided alternative when you would genuinely care about an effect in either direction, because the test will not flag it.
If you are still deciding between the two, directional vs. non-directional hypotheses walks through the trade-offs.
Alternative Hypothesis vs Null Hypothesis
The two hypotheses are partners, not rivals. The null is the default you assume until the data say otherwise. The alternative is what you conclude when the null looks implausible.
| Feature | Null hypothesis ($H_0$) | Alternative hypothesis ($H_A$) |
|---|---|---|
| Role | Skeptical default | Research claim |
| Typical form | $\mu = \mu_0$ | $\mu \neq \mu_0$, $\mu > \mu_0$, or $\mu < \mu_0$ |
| Contains equality | Always | Never |
| Tested directly | Yes, by assuming it true | No, only supported indirectly |
| Outcome | Reject or fail to reject | Supported or not supported |
The equality always lives in $H_0$. That is what lets you compute a p-value, because you need a single value to plug into the formula. The alternative covers the range of values that remain.
For the full pairing logic, see null and alternative hypotheses.
Common Mistakes
- Writing the alternative about the sample. $H_A: \bar{x} \neq 350$ is wrong. Hypotheses are about population parameters, so write $H_A: \mu \neq 350$. Fix: replace every statistic symbol with its parameter symbol.
- Putting equality in the alternative. $H_A: \mu = 350$ is not an alternative, it is a null. Fix: the alternative must use $\neq$, $>$, or $<$.
- Choosing the direction after seeing results. This inflates the false positive rate and is a form of p-hacking. Fix: state the direction in your analysis plan before collecting or inspecting data.
- Using a one-sided test with no justification. Reviewers will ask why. Fix: cite prior evidence or a design constraint that rules out the other direction.
- Confusing "fail to reject" with "accept." You never accept $H_0$. Fix: report the confidence interval alongside the decision so readers see the range of plausible values.
- Forgetting that $H_0$ and $H_A$ must be exhaustive. If some parameter values fall under neither, the test is ill-posed. Fix: check that every value is covered by exactly one hypothesis.
Limitations
The alternative hypothesis framework cannot tell you whether an effect matters in practice. A tiny effect can produce a small p-value with a large enough sample, and the test will reject $H_0$ even when the difference is trivial. Always pair the decision with an effect size and a confidence interval.
The framework also cannot confirm the null. A non-significant result is ambiguous: it may reflect a true null, a small effect, or an underpowered study. And the choice between one-sided and two-sided alternatives changes the p-value for the same data, which means the hypothesis must be fixed before analysis for the result to be interpretable.
Frequently Asked Questions
What is an alternative hypothesis in simple terms?
It is your research prediction stated as a claim about a population. If you expect a group to differ from a benchmark, or to score higher or lower than another group, that expectation is the alternative hypothesis. The test checks whether the data are surprising enough under the opposite claim, the null hypothesis, to support your prediction.
What symbol do you use for the alternative hypothesis?
The most common symbols are $H_A$ and $H_1$. Both mean the same thing, and textbooks vary. The null is written $H_0$. In a two-sided test the alternative uses $\neq$, and in a one-sided test it uses $>$ or $<$.
How do you write a one-sided alternative hypothesis?
Decide the direction first, then write it. For a mean above a benchmark, write $H_A: \mu > \mu_0$ with $H_0: \mu \leq \mu_0$. For a mean below a benchmark, write $H_A: \mu < \mu_0$ with $H_0: \mu \geq \mu_0$. The inequality in $H_A$ must point the way you expect the effect to go.
Can the alternative hypothesis contain an equals sign?
No. The equality always belongs to the null hypothesis, because the test needs a single parameter value to compute the p-value. If you see an equals sign in $H_A$, the hypotheses have been written incorrectly.
Does rejecting the null prove the alternative hypothesis?
No. Rejecting $H_0$ means the data are unlikely under the null model, which supports $H_A$ but does not prove it. Other explanations, such as sampling bias or a flawed design, can also produce a small p-value. Report the effect size and confidence interval so readers can judge the result.
References
- 4.4: Hypothesis Testing - Statistics LibreTexts./04%3A_Foundations_for_Inference/4.04%3A_Hypothesis_Testing)
- 7.1: Null and Alternative Hypotheses - Mathematics LibreTexts/07%3A_Testing_Proportions/7.1%3A_Null_and_Alternative_Hypotheses)
Further Reading
- NIST/SEMATECH e-Handbook of Statistical Methods
- Wasserstein RL, Lazar NA (2016). The ASA Statement on p -Values: Context, Process, and Purpose. The American Statistician
- Krzywinski M, Altman N (2013). Significance, P values and t-tests. Nature Methods
- OpenStax. Introductory Statistics 2e
Related Articles
- Null and Alternative Hypotheses: Definition and Examples
- When to Reject the Null Hypothesis: Definition and Examples
- What Is Hypothesis Testing? Steps, Errors and Examples
- Reverse Causality: Definition, Examples and How to Detect It
- How to Write a Directional Hypothesis: A Guide with Biology Examples
- How to Write a Hypothesis for a Research Proposal: Examples and Templates
- How to Write a Falsifiable Hypothesis: 5 Common Mistakes and Fixes