How to Identify Class Midpoints in a Frequency Distribution
By Dr. Zubair Khalid, DVM, MS, PhD ·
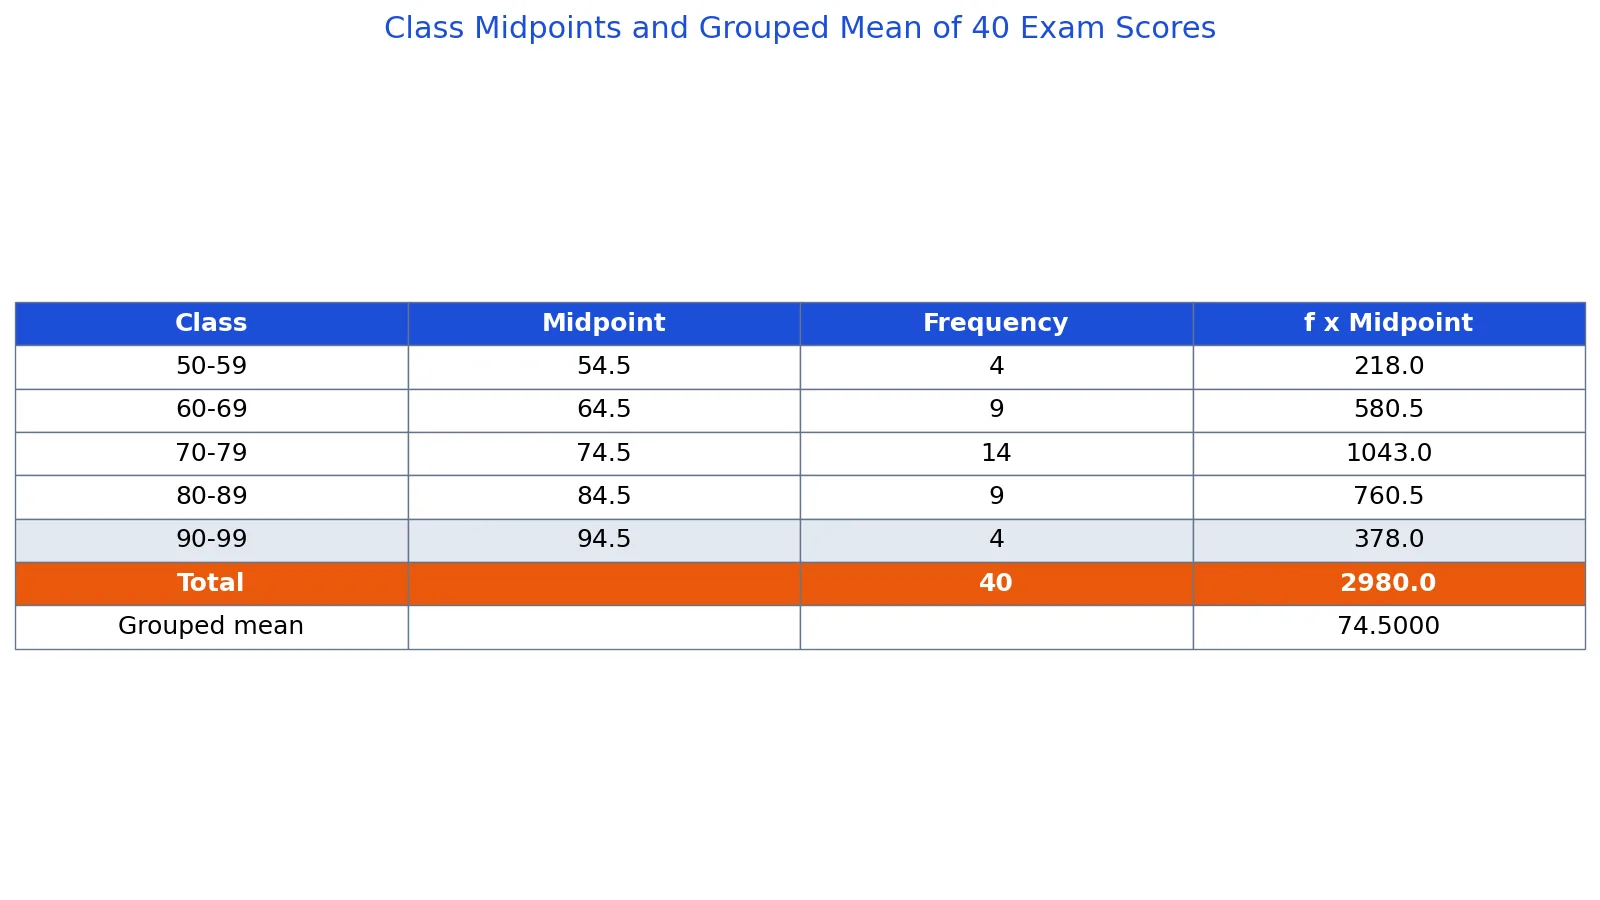
To identify class midpoints, add the lower and upper class limits together and divide by 2. The midpoint is the single value that represents the entire interval, so a class of 70-79 has a midpoint of 74.5. You need these values whenever you estimate a grouped mean, draw a frequency polygon, or compare grouped data to raw data.
Quick Answer
- The formula is $\text{Midpoint} = \dfrac{\text{Lower limit} + \text{Upper limit}}{2}$ [1].
- Use the class limits as written in the table, not the class boundaries. For 70-79, the midpoint is $(70 + 79) / 2 = 74.5$ [1].
- When every class has the same width, the midpoints are evenly spaced. Once you find the first one, you can add the class width to get the rest.
- Midpoints are the standard stand-in for all values inside a class when you only have grouped data [2].
- Multiply each midpoint by its frequency, add those products, and divide by the total frequency to get the grouped mean.
Before You Start
You need a grouped frequency table with clearly written class intervals, such as 50-59, 60-69, and so on. Each row should have a lower limit and an upper limit, plus a frequency count.
Check three things before you calculate anything.
First, confirm the classes do not overlap. A value should fall into exactly one class, and no data value should sit right on a boundary between two classes [1]. If your table shows 50-60 and 60-70, the value 60 is ambiguous and you need to fix the class definitions first.
Second, confirm the classes are the same width. In the table below, every class spans 10 units. Unequal widths are allowed in some tables, but they make the midpoint shortcut (adding the width) invalid, so you have to compute each midpoint separately.
Third, know the difference between limits and boundaries. Class limits are the numbers printed in the table. Class boundaries are the values halfway between adjacent classes, found by subtracting 0.5 from the lower limit and adding 0.5 to the upper limit [1]. Midpoints use limits. Boundaries are used for histograms, where the bars must touch [2].
If you are still building the table itself, start with a guide to constructing a frequency distribution before you worry about midpoints.
Step by Step
- Write down the lower and upper limit of the first class. Read them straight from the table. For the class 50-59, the lower limit is 50 and the upper limit is 59.
- Add the two limits. $50 + 59 = 109$.
- Divide by 2. $109 / 2 = 54.5$. That is the midpoint of the first class.
- Find the class width. Subtract the lower limit of one class from the lower limit of the next class. $60 - 50 = 10$. The width is 10.
- Add the width to the first midpoint to get the next one. $54.5 + 10 = 64.5$. Repeat down the table. This works because equal-width classes produce evenly spaced midpoints.
- Check your work. The midpoint should sit exactly halfway between the limits. For 90-99, $(90 + 99) / 2 = 94.5$, which is 4.5 above 90 and 4.5 below 99. If a midpoint is not centered, you made an arithmetic error.
- Use the midpoints. Multiply each midpoint by its frequency to get $f \times \text{midpoint}$, then sum those products and divide by the total frequency. That gives the grouped mean.
Worked Example
The dataset is a grouped frequency table of 40 exam scores across five 10-point classes.
| Class interval | Frequency |
|---|---|
| 50-59 | 4 |
| 60-69 | 9 |
| 70-79 | 14 |
| 80-89 | 9 |
| 90-99 | 4 |
The total frequency is $n = 4 + 9 + 14 + 9 + 4 = 40$.
Now compute each midpoint with the formula.
$$(50 + 59) / 2 = 54.5$$ $$(60 + 69) / 2 = 64.5$$ $$(70 + 79) / 2 = 74.5$$ $$(80 + 89) / 2 = 84.5$$ $$(90 + 99) / 2 = 94.5$$
The midpoints are 54.5, 64.5, 74.5, 84.5 and 94.5. Notice they are spaced exactly 10 apart, which matches the class width.
Next, multiply each midpoint by its frequency.
| Class interval | Frequency | Midpoint | $f \times \text{midpoint}$ |
|---|---|---|---|
| 50-59 | 4 | 54.5 | 218.0 |
| 60-69 | 9 | 64.5 | 580.5 |
| 70-79 | 14 | 74.5 | 1043.0 |
| 80-89 | 9 | 84.5 | 760.5 |
| 90-99 | 4 | 94.5 | 378.0 |
The sum of the products is $218.0 + 580.5 + 1043.0 + 760.5 + 378.0 = 2980.0$.
The grouped mean is $2980.0 / 40 = 74.5000$.
Here is the same calculation in Python.
classes = [(50,59),(60,69),(70,79),(80,89),(90,99)]
freqs = [4, 9, 14, 9, 4]
midpoints = [(lo+hi)/2 for lo,hi in classes]
fm = [f*m for f,m in zip(freqs, midpoints)]
mean = sum(fm)/sum(freqs)  # 74.5000
print(midpoints, mean)
Output:
[54.5, 64.5, 74.5, 84.5, 94.5] 74.5The grouped mean of 74.5 is an estimate, not the true mean of the 40 raw scores. It assumes every score in a class sits exactly at the midpoint. If you want to see how that estimate behaves across different interval choices, the mean of interval article walks through the same logic in more depth.
Other Ways to Do It
Spreadsheet formula. If your lower limit is in cell A2 and your upper limit is in B2, the formula =(A2+B2)/2 returns the midpoint. Fill it down the column. This is the fastest route for a long table.
Add the width shortcut. Find the first midpoint, then add the class width repeatedly. For the table above, start at 54.5 and add 10 four times to reach 94.5. This is useful for a quick mental check, but only when every class has the same width.
Midpoint from boundaries. If you already computed class boundaries, the midpoint of the boundaries equals the midpoint of the limits. For the class 50-59, the boundaries are 49.5 and 59.5, and $(49.5 + 59.5) / 2 = 54.5$. Same answer, different route [1].
Relative frequency tables. If your table shows relative frequencies instead of counts, the midpoint calculation does not change. You still average the limits, then multiply by the relative frequency to get the weighted contribution.
Troubleshooting
The midpoint is not a whole number. That is normal and expected. With integer limits, the midpoint ends in .5 whenever the class width is odd, and it can be a whole number when the width is even. Do not round it to a whole number before multiplying by the frequency, because that introduces error into the grouped mean.
The midpoints are not evenly spaced. Either the class widths are unequal, or you misread a limit. Recheck the lower limits. If the widths genuinely differ, compute each midpoint independently with the formula.
The last class is open-ended. A class written as "90 and above" has no upper limit, so the midpoint formula does not apply. You cannot identify class midpoints for open-ended classes without making an assumption about where the class ends. State that assumption explicitly if you proceed.
Your grouped mean looks far from the raw mean. This happens when the data is heavily skewed inside classes. The midpoint assumption pulls the estimate toward the center of each interval. With a large class width, the error grows.
The table has overlapping classes. Fix the class definitions before calculating. A value that could belong to two classes makes every downstream statistic unreliable [1].
Common Mistakes
- Using class boundaries instead of limits. Boundaries are 49.5 and 59.5 for the class 50-59. Averaging them gives the right answer by coincidence, but mixing the two sets of numbers across a table causes errors. Fix: use the printed limits in the formula.
- Forgetting to divide by 2. Adding the limits and stopping at 109 is a common slip. Fix: always complete the division and sanity-check that the midpoint sits between the two limits.
- Rounding the midpoint too early. Rounding 54.5 to 55 before multiplying by the frequency shifts the grouped mean. Fix: keep full precision through the multiplication, and round only the final result.
- Assuming all classes have equal width without checking. The add-the-width shortcut fails on unequal classes. Fix: verify the width of each class, or compute every midpoint from scratch.
- Treating the grouped mean as the exact mean. The value 74.5 is an estimate based on midpoints. Fix: label it as a grouped mean and note that it can differ from the mean of the raw data.
- Ignoring open-ended classes. Applying the formula to "90 and above" produces a meaningless number. Fix: define an upper limit with a stated assumption, or exclude that class and say so.
Limitations
The midpoint method gives you one number per class, and that number is an assumption. It says every observation in the class equals the midpoint. If the values inside a class cluster near one end, the midpoint misrepresents them, and the grouped mean inherits that error. The wider the class, the larger the potential distortion.
The method also cannot recover information the grouping destroyed. You cannot compute an exact median, mode, variance or standard deviation from midpoints alone, and you cannot see the shape of the distribution inside a class. For distributions with very different densities, such as a uniform distribution compared with a heavily skewed one, the same midpoint table can produce the same grouped mean while the underlying data looks completely different.
Frequently Asked Questions
What is the formula for a class midpoint?
Add the lower class limit and the upper class limit, then divide by 2. For the class 70-79, that is $(70 + 79) / 2 = 74.5$ [1]. The result is the value that represents the center of the interval.
Do I use class limits or class boundaries for the midpoint?
Use the class limits, which are the numbers printed in the table. Class boundaries are shifted by 0.5 on each side and are used to make histogram bars touch [1]. Averaging the boundaries of a class gives the same midpoint, but the limits are the standard input.
Why are the midpoints always 10 apart in my table?
Because every class has a width of 10. Equal-width classes produce evenly spaced midpoints, so each midpoint is exactly one class width above the previous one. If your midpoints are not evenly spaced, check whether the class widths are actually equal.
Can I find the midpoint of an open-ended class?
Not directly. A class such as "90 and above" has no upper limit, so the formula has nothing to average with the lower limit. You must assume an upper limit based on the data range or the width of the other classes, and you should state that assumption clearly.
Is the grouped mean the same as the real mean?
No. The grouped mean is an estimate that assumes every value in a class equals the midpoint. In the worked example, the grouped mean is 74.5, but the mean of the 40 raw scores could be slightly different. The gap shrinks as class widths get smaller.
References
Further Reading
- NIST/SEMATECH e-Handbook of Statistical Methods
- OpenStax. Introductory Statistics 2e
- Krzywinski M, Altman N (2013). Importance of being uncertain. Nature Methods
- Krzywinski M, Altman N (2013). Significance, P values and t-tests. Nature Methods