Free vs. Premium Diagnostic Accuracy Calculators
By Dr. Zubair Khalid, DVM, MS, PhD ·

A free diagnostic accuracy calculator computes the standard performance metrics of one test from a 2x2 table you already have. A premium calculator, usually a licensed statistics package or a paid analytical platform, returns the same metrics and adds the machinery around them: confidence intervals for comparisons, receiver operating characteristic (ROC) analysis, sample-size planning, meta-analysis, and documented, reproducible output.
Rule of thumb: use a free tool when you need sensitivity, specificity, predictive values, or likelihood ratios for a single table in hand. Move to premium software, or an equivalent scripted workflow in R or Python, the moment a result will be published, compared against another test, pooled with other studies, or used to support a clinical or laboratory claim.
This guide covers what these calculators compute, what each tier includes, how free vs. premium diagnostic accuracy calculators differ on the criteria that decide real projects, and where each one belongs in the toolkit of biology calculators that students and researchers build over a career. The arithmetic itself is identical across tiers. What differs is everything built around the arithmetic.
What a Diagnostic Accuracy Calculator Actually Computes
Every diagnostic accuracy calculation starts with an index test (the test being evaluated) and a reference standard (the best available method for establishing each patient's true status). Every patient lands in one cell of a 2x2 contingency table: true positive (TP, test positive and condition present), false positive (FP, test positive and condition absent), false negative (FN, test negative and condition present), and true negative (TN, test negative and condition absent).
From those four counts, a calculator derives the core metrics:
- Sensitivity: TP / (TP + FN). The probability of a positive test when the condition is present.
- Specificity: TN / (TN + FP). The probability of a negative test when the condition is absent.
- Positive predictive value (PPV): TP / (TP + FP). The probability the condition is present when the test is positive.
- Negative predictive value (NPV): TN / (TN + FN). The probability the condition is absent when the test is negative.
- Positive likelihood ratio (LR+): sensitivity / (1 - specificity). How much a positive result multiplies the odds of disease.
- Negative likelihood ratio (LR-): (1 - sensitivity) / specificity. How much a negative result multiplies the odds.
- Overall accuracy: (TP + TN) / n, the share of all patients classified correctly.
- Youden index: J = sensitivity + specificity - 1, a summary of discrimination that runs from 0 (no better than chance) to 1 (perfect).
- Diagnostic odds ratio: (TP × TN) / (FP × FN), a single value that combines both error types.
Some calculators also accept sensitivity, specificity, and a target prevalence, then compute the predictive values for that setting. This inversion helps in planning, because it shows what a test would do in a population different from the one originally studied.
A worked example shows the full set. Suppose 300 patients receive a new rapid test and the reference standard, and the reference standard identifies the condition in 60 of them (a prevalence of 20%). The rapid test has a sensitivity of 90% and a specificity of 85%, which fills the table like this:
| Condition present | Condition absent | Row total | |
|---|---|---|---|
| Test positive | 54 (TP) | 36 (FP) | 90 |
| Test negative | 6 (FN) | 204 (TN) | 210 |
| Column total | 60 | 240 | 300 |
The calculator returns PPV = 54 / 90 = 60%, NPV = 204 / 210 = 97.1%, LR+ = 0.90 / 0.15 = 6.0, LR- = 0.10 / 0.85 = 0.12, accuracy = 258 / 300 = 86%, and Youden index J = 0.75. Any free browser calculator reproduces these numbers in seconds.
When a test yields a continuous value rather than a positive or negative result, the analysis moves to ROC curves. A receiver operating characteristic curve plots sensitivity against 1 - specificity at every possible cutoff, and the area under the curve (AUC) summarizes discrimination across all of them: 0.5 is chance, 1.0 is perfect. Published values give a sense of scale. In a study of placental proteins as markers of recurrent pregnancy loss (two or more consecutive miscarriages, a condition affecting 1 to 5% of recognized pregnancies), researchers normalized serum concentrations as a daily multiple of the median (dMoM, the patient's value divided by the median value for that day of gestation), fit logistic regression classifiers, and drew ROC curves. PAPP-A (pregnancy-associated plasma protein-A) reached an AUC of 0.880 [1].
One more input matters before any of these numbers mean something: a confidence interval (CI), the range that quantifies how much sampling uncertainty surrounds an estimate. Whether a calculator produces CIs, and by which method (the Wilson interval and the exact binomial interval are the standard choices for a single proportion), is one of the first real differences between tiers.
Free Diagnostic Accuracy Calculators
Free options fall into three groups, and each group serves a different job.
Browser-based 2x2 calculators
Many medical, epidemiology, and statistics websites host free contingency-table calculators. You type TP, FP, FN, and TN into four boxes, and the page returns sensitivity, specificity, PPV, NPV, likelihood ratios, accuracy, and often the Youden index and diagnostic odds ratio. Some add Wilson or exact binomial CIs for each proportion. Public-health suites such as OpenEpi extend the idea to a wider set of epidemiological measures. These tools require no installation and no license, and the better ones display the formulas they used, which makes them strong teaching aids.
Spreadsheets and open-source code
Any spreadsheet can host the formulas listed above, and course templates circulate freely. For ROC work, the open-source route is stronger than the browser route: the pROC package in R and the metrics module of scikit-learn in Python compute ROC curves, AUCs with CIs, and DeLong comparisons (covered below) at no cost. The trade is that you write, run, and check the code yourself.
What free tools do well
Free calculators are ideal for learning the metrics, because you can watch each formula act on numbers you chose. They are ideal for verification, because checking the derived values behind a published table takes a minute. And they are ideal for internal work, such as a pilot dataset or a lab meeting, where a single table with basic intervals answers the question.
Where free tools stop
Browser calculators handle one table at a time and require manual re-entry for every change. Most lack paired-test comparisons, cutoff optimization, meta-analysis, batch processing, and any audit trail. Documentation is the quiet issue. A licensed package ships with a methods manual stating which interval formula and which comparison test it uses. A free web page often does not, so two calculators can return different intervals for the same table, and you cannot tell which is right without checking the formula yourself.
The division of labor has a clear published example. A recent study built an auxiliary diagnostic model for Alzheimer's disease from routine peripheral blood parameters and, after completing the full analysis, implemented the final model as a freely accessible web-based calculator [2]. The free calculator is the delivery layer. The modeling behind it ran in a complete statistical environment, with feature selection, algorithm comparison, and validation statistics that no 2x2 web form can perform.
Premium Diagnostic Accuracy Calculators
Premium here means licensed software or paid platforms: desktop statistics packages such as MedCalc, Stata, SPSS, SAS, and GraphPad Prism, dedicated sample-size software, and validated analytical platforms used by clinical laboratories and research organizations. Academic pricing lowers the cost for students, but price is not the defining feature. The defining features are the scope of the analysis engine and the documentation behind it, both of which matter because journals expect diagnostic accuracy manuscripts to meet international reporting standards for study design, uncertainty, and validation.
Paired designs and curve comparison
When two tests run on the same patients, their ROC curves are statistically correlated, and comparing their AUCs as if they came from independent groups is a classic error. Full packages implement the DeLong test, a method built for comparing correlated ROC curves, along with partial AUC (the area restricted to a clinically relevant range of specificity) and cutoff selection with bootstrap confidence intervals (resampling the data with replacement to quantify uncertainty).
Meta-analysis of diagnostic accuracy
A single-table calculator cannot pool studies. Diagnostic accuracy syntheses pool sensitivity and specificity across studies with random-effects models, which treat the true value as varying from study to study rather than assuming one fixed value. A systematic review of the Mini Parasep fecal parasite concentrator pooled sensitivity estimates from 11 studies with random-effects models and ran subgroup analyses by parasite species, study design, and geographic region [3]. Work in this genre typically runs in commercial software. A meta-analysis of hepatitis E virus infection in pregnant women in Sub-Saharan Africa pooled 30 studies in Stata version 17 with a random-effects model, after registering the review protocol prospectively [4].
Model building and internal validation
Prediction models need validation steps that simple calculators cannot approximate. The developers of the RMC-COMPASS prognostic model for SMARCB1-deficient renal medullary carcinoma (a rare, aggressive kidney cancer affecting mainly young patients with sickle hemoglobin disorders) repeated their variable selection within 1,000 bootstrap resamples across 50 multiply imputed datasets (a technique for handling missing values), then reported an optimism-corrected concordance index (C-index, the probability that two randomly chosen patients are ranked correctly for survival) of 0.64 with a 95% CI of 0.61 to 0.71, a calibration slope of 0.895 (with 1.0 as ideal agreement between predicted and observed outcomes), and decision curve analysis (a method that quantifies net benefit across a range of clinical decision thresholds) at 24 months [5]. The final model retained four predictors, including the neutrophil-to-lymphocyte ratio (an inflammation marker computed from a standard blood count). None of this pipeline exists in a web form with four boxes.
Model selection and regression-based accuracy
Some accuracy questions have no contingency table at all. A growth study compared 19 linear and nonlinear functions for describing the growth curves of free-range turkeys, ranking the fits with the Akaike information criterion and its corrected variant, the Bayesian information criterion (both balance goodness of fit against model complexity, with lower values better), pseudo-R2, and mean squared error [6]. Premium packages exist for exactly this kind of work: fitting many candidate models at once, comparing them on standard criteria, and documenting which one won and why.
Free vs Premium Diagnostic Calculators: Side-by-Side Comparison
| Criterion | Free calculators | Premium (licensed) tools |
|---|---|---|
| Cost | None for browser tools and open-source code | License or subscription, usually with academic discounts |
| Typical user | Students, educators, clinicians checking one table | Researchers, biostatisticians, laboratory scientists |
| Input | One 2x2 table typed by hand | Whole datasets (CSV, Excel, laboratory exports) |
| Core metrics | Sensitivity, specificity, PPV, NPV, likelihood ratios, accuracy, Youden index | All core metrics plus paired comparisons, partial AUC, and cutoff optimization |
| Confidence intervals | Basic intervals on single proportions, method varies by site | Intervals on estimates, comparisons, pooled values, and model performance |
| ROC and AUC | Sometimes, one curve at a time | Full ROC analysis with DeLong comparison of correlated curves |
| Sample-size planning | Rarely available | Dedicated modules for diagnostic study design |
| Meta-analysis | Not available | Random-effects pooling of sensitivity and specificity |
| Validation and audit | Little or none | Documented algorithms, versioned output, audit trails |
| Reproducibility | Manual re-entry for every change | Saved scripts, batch processing, standardized exports |
| Learning curve | Minutes | Hours to weeks |
| Best for | Coursework, quick checks, teaching | Publication, regulated laboratory work, model building |
Read the table by column when budgeting and by row when checking for capability gaps. Three rows decide most real projects: paired comparison, meta-analysis, and reproducibility, because those are the gaps you cannot patch by hand the night before a deadline.
When to Use Free (and When to Pay)
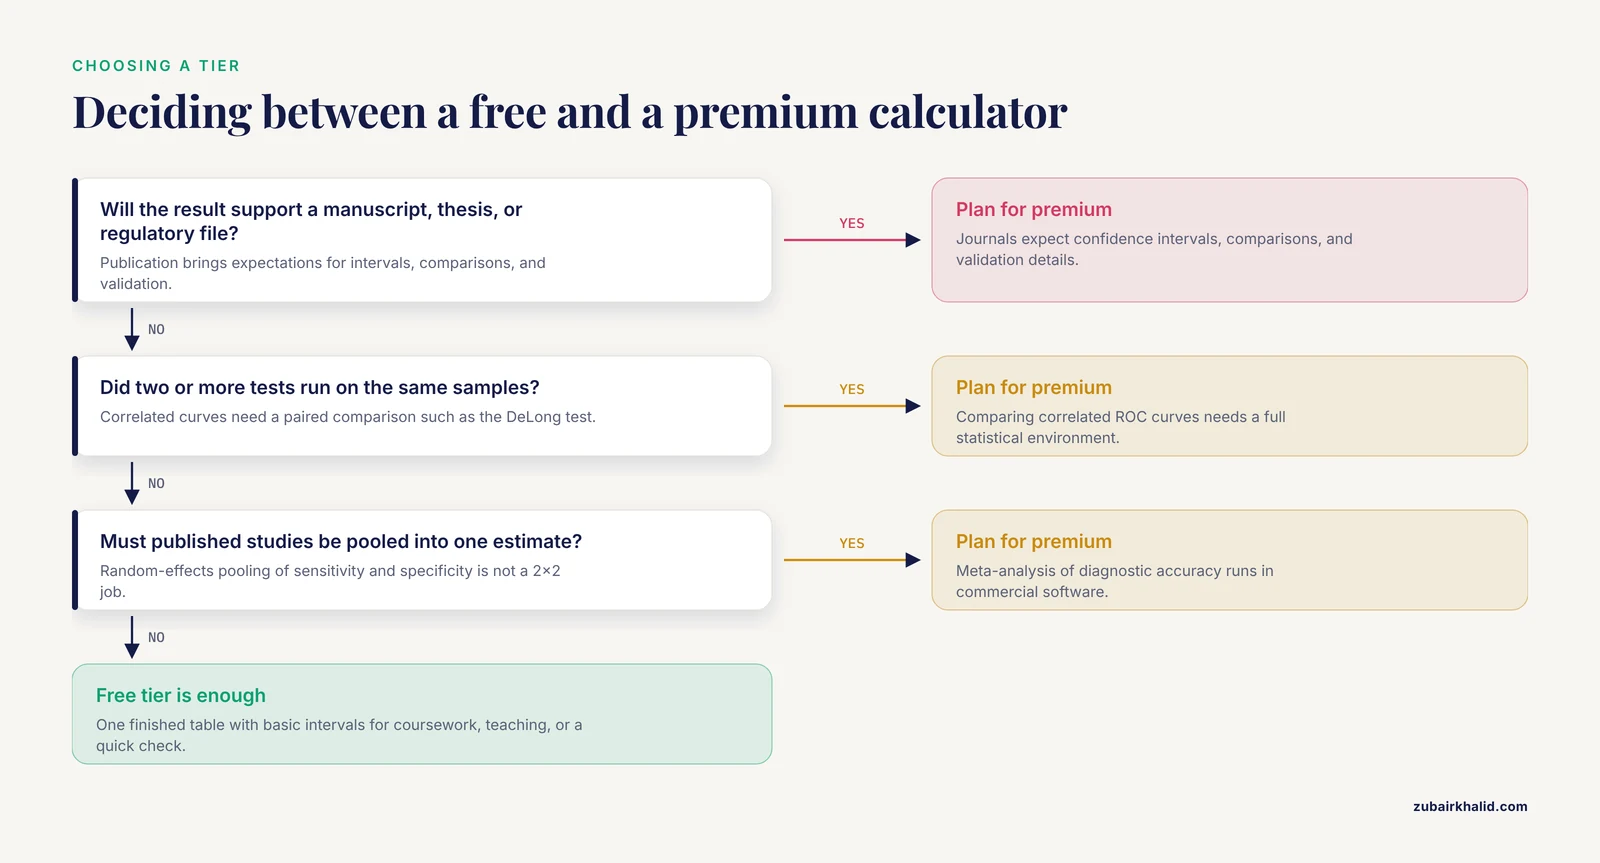
Whether a free or premium diagnostic calculator fits a project depends on five criteria: purpose, design complexity, validation needs, sample-size planning, and reproducibility.
Choose free when...
- You are learning the metrics and want to watch formulas act on numbers you control.
- You need to verify derived values in a published table or check a homework answer.
- A single table with basic confidence intervals answers the question.
- The output stays internal, in a lab meeting, pilot report, or teaching exercise.
- A vendor trial or an open-source library covers a one-off need for premium features.
Choose premium when...
- The result supports a manuscript, thesis, grant application, or regulatory file.
- Two or more tests ran on the same samples and their curves must be compared.
- Published studies must be pooled into a single estimate.
- The project includes a prediction model that needs internal validation.
- Sample size must be justified before data collection begins.
- Missing data, covariate adjustment, or batch processing is involved.
Two practical criteria sit outside the feature list. Data privacy is one: browser calculators require pasting counts, which is harmless for a teaching table and deserves a second thought for unpublished patient data, where a desktop package or a local script keeps everything on your own machine. The second is the middle path, which is common in published work and worth planning for: run the analysis in a full statistical environment (licensed point-and-click packages or free scripted ones), then deploy the finished model as a free web calculator for end users. In that workflow the two tiers are complements, not rivals.
Worked Scenarios
Scenario 1: A course assignment on a rapid test (free)
A student has the 300-patient table from the worked example above and must report sensitivity, specificity, predictive values, and likelihood ratios with intervals. A free browser calculator returns every number in under a minute, and the assignment requires nothing more. This is the clearest case for the free tier, and paying for software would add nothing the task needs.
Scenario 2: Comparing serum biomarkers for recurrent pregnancy loss (premium)
A research team asks whether three placental proteins (free β-hCG, PAPP-A, and placental growth factor) discriminate between pregnancies that end in miscarriage and healthy pregnancies at the same gestational age. The published analysis normalized each concentration for gestational age, fit logistic regression classifiers, and compared the proteins with ROC curves [1]. Reproducing it requires software that computes gestational-age-specific medians, fits logistic models, and overlays ROC curves for competing markers. A 2x2 web calculator cannot even enter the analysis, because no single table exists until a cutoff is chosen, and choosing the cutoff is itself part of the analysis.
Scenario 3: Building a screening model and releasing it as a calculator (premium, then free)
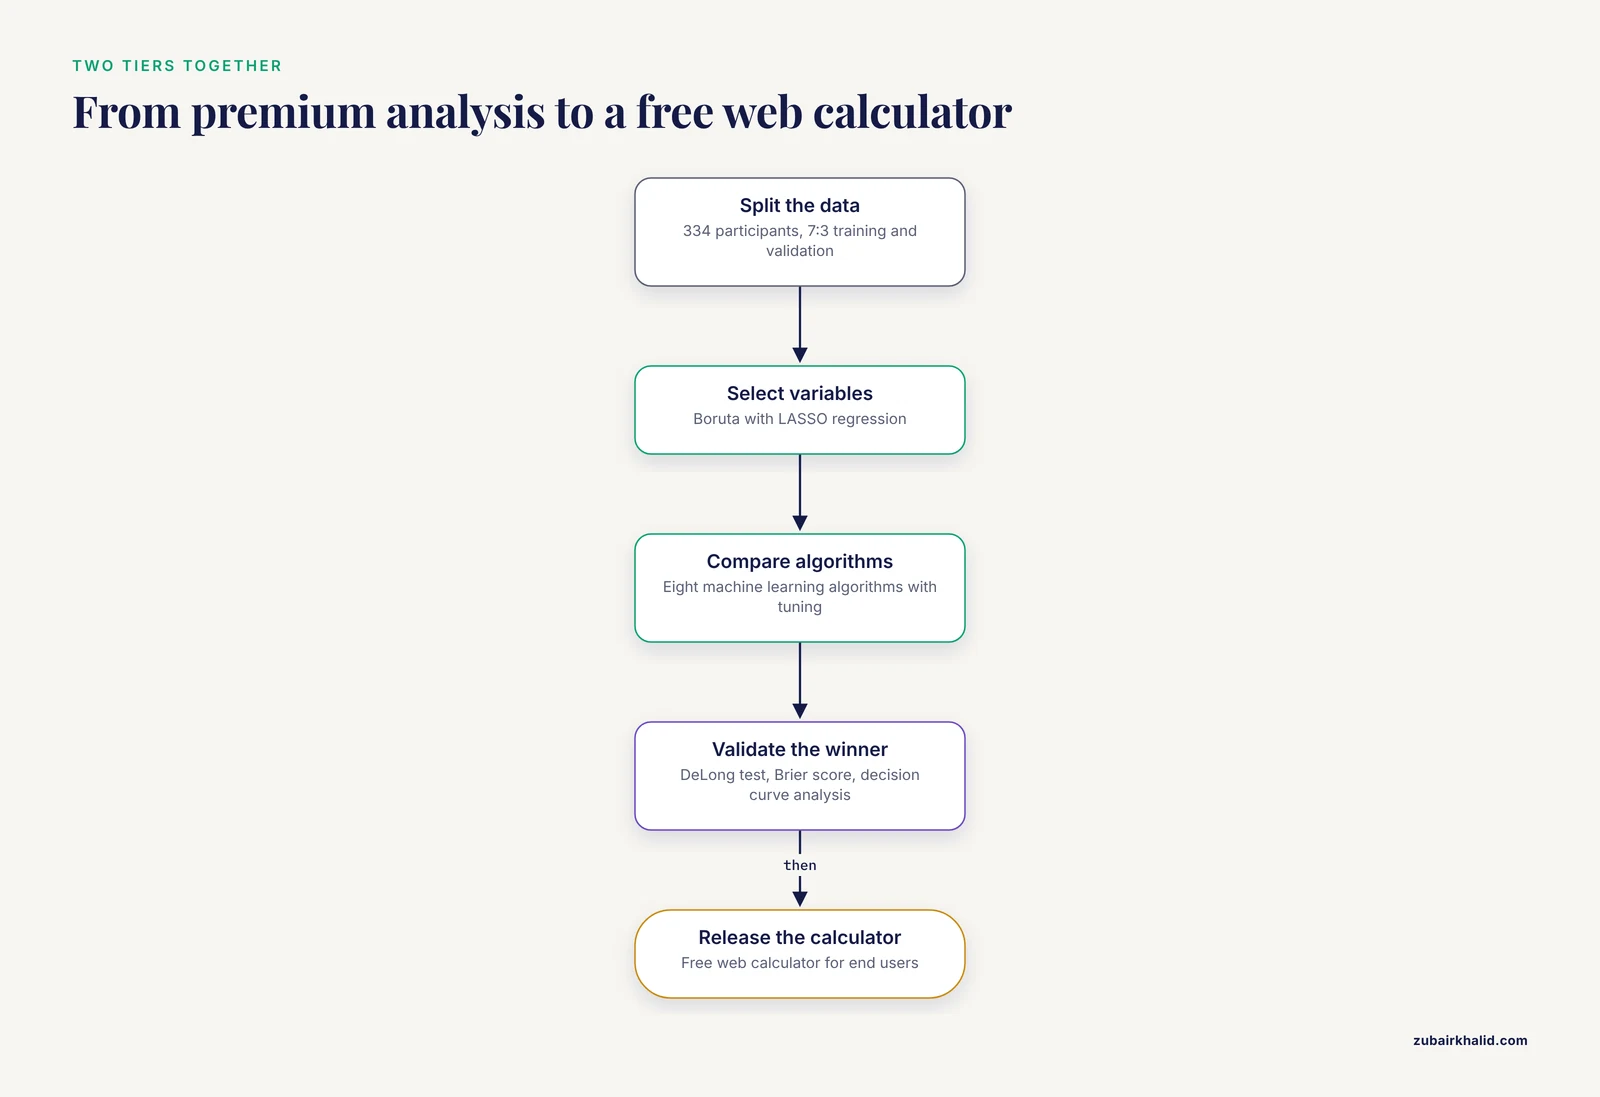
A team assembled routine blood parameters to screen for Alzheimer's disease, split 334 participants into training and validation sets at a 7:3 ratio, selected variables with the Boruta algorithm (which compares each variable's importance against shuffled copies of itself) combined with LASSO regression (which shrinks weak predictors to zero), compared eight machine learning algorithms (random forest, gradient boosting, XGBoost, AdaBoost, K-nearest neighbors, support vector machine, logistic regression, and a neural network) with hyperparameter tuning (the search for each algorithm's best settings), and evaluated the winner with the DeLong test, the Brier score (the mean squared difference between predicted probabilities and observed outcomes), and decision curve analysis before releasing it as a free web calculator [2]. The pattern generalizes: premium-class analysis produces the model, and the free calculator delivers it to the people who will use it.
Scenario 4: Validating a measurement method against a physical reference (premium)
An animal-science laboratory wants to know whether an automated ultrasonic scanner predicts carcass lean yield as well as the handheld optical probe it would replace. The published comparison tested both methods against manual dissection of 337 carcasses, using linear regression to measure agreement with the physical gold standard and partial least squares regression (a technique that compresses many correlated predictors into a few components) to build predictions from image parameters [7]. The design is a method-comparison study, the accuracy question is calibration against a reference standard rather than a table split, and the entire analysis lives in statistical software.
Common Mistakes and Limitations
- Confusing predictive values with sensitivity and specificity. Predictive values move with prevalence while sensitivity and specificity do not. The worked test above (sensitivity 90%, specificity 85%) gives a PPV of 60% at 20% prevalence. In a screening population of 10,000 with 5% prevalence, the same test produces 450 true positives and 1,425 false positives, so the PPV falls to 24% with no change in the test itself. A calculator will compute either number without complaint. Checking that the input prevalence matches the intended use population is the analyst's job.
- Entering the table rotated. A 2x2 table entered with rows and columns swapped produces plausible-looking but inverted results, such as a sensitivity of 90% reported as 10%. Confirm which dimension the calculator treats as disease status, and verify one output against a hand calculation before trusting the rest.
- Reporting point estimates without intervals. A sensitivity of 88% estimated from 25 diseased patients carries a 95% CI of roughly 70 to 96% (Wilson method). The point estimate alone hides that width, and small diagnostic studies almost always have wide intervals.
- Trusting sensitivity from a soft reference standard. Reference standards vary in rigor. The Mini Parasep meta-analysis accepted a composite reference standard, defined as positivity by any diagnostic method used within each study, because no single perfect reference exists for intestinal parasites [3]. Composite standards are pragmatic, and they tend to classify borderline samples as positive, which can raise measured sensitivity relative to a single rigorous reference. Read the reference-standard definition before comparing sensitivity estimates across studies or calculators.
- Ignoring optimism in model performance. Performance measured on the same data used to build a model is inflated, sometimes substantially. The renal medullary carcinoma model described above was optimism-corrected through bootstrap resampling before its final C-index was reported [5]. Uncorrected AUC or C-index values from small models should be read as upper bounds.
- Assuming the calculator validates the study. A calculator assumes the counts are correct, the patients represent the target population, and the reference standard is sound. It checks none of these. Errors in study design pass through the arithmetic untouched.
- Mistaking the calculator for the model. A web calculator is an interface. Its usefulness depends entirely on the modeling, validation, and documentation that happened before deployment, none of which is visible in the interface itself.
- Knowing when to involve a specialist. Calculator output never substitutes for judgment by a qualified clinician on an individual patient, and complex designs benefit from a biostatistician consulted before data collection rather than after the data are locked.
Frequently Asked Questions
What is the difference between free and premium diagnostic accuracy calculators?
Free calculators compute standard metrics such as sensitivity, specificity, predictive values, and likelihood ratios from a single 2x2 table you enter by hand. Premium tools are licensed packages that add confidence intervals for comparisons, ROC analysis with correlated-curve tests, sample-size planning, meta-analysis, batch processing, and documented, reproducible output. The arithmetic is identical. The scope around it is not.
When should I use a free diagnostic accuracy calculator?
Use free whenever you have one finished table and need its metrics: coursework, teaching, checking published numbers, and pilot data for a lab meeting. Move to premium software once results feed a manuscript, a comparison between tests, or a pooled analysis.
Are premium calculators more accurate than free ones?
No. Sensitivity from a free web form and sensitivity from a licensed package are the same number when the inputs match. Premium tools earn their cost through study-design features, comparison statistics, validation, and workflow, not through different arithmetic.
Can free calculators handle confidence intervals and ROC curves?
Many free web calculators produce confidence intervals for single proportions, and open-source libraries in R and Python compute full ROC curves and AUC comparisons at no cost. What free point-and-click tools rarely offer is paired-curve comparison, cutoff optimization, and pooled meta-analysis.
Do I need premium software to publish diagnostic accuracy research?
Almost always. Journals expect confidence intervals, comparisons, and validation details that require a full statistical environment. The common pattern is analysis in licensed or scripted software, followed by release of the finished model as a free web calculator for readers.
What is a bioinformatics calculator, and how is it different from a diagnostic accuracy calculator?
A bioinformatics calculator handles sequence and omics questions such as translation, molecular weights, primer properties, and alignment statistics, while a diagnostic accuracy calculator handles test performance questions from contingency tables. Both sit under the broader biology calculator umbrella, and large projects often need both.
Sources
- Decreased Expression of Placental Proteins in Recurrent Pregnancy Loss: Functional Relevance and Diagnostic Value.
- Construction of an auxiliary diagnostic model for Alzheimer's disease based on routine peripheral blood parameters.
- Diagnostic Performance of Mini Parasep(®) for the Detection of Intestinal Parasitic Infections: A Systematic Review and Meta-Analysis.
- Prevalence, risk factors, and clinical outcomes of hepatitis E infection in pregnant women in Sub-Saharan Africa: a systematic review and meta-analysis.
- Development and Internal Validation of the RMC-COMPASS Clinical Prognostic Model for SMARCB1-deficient Renal Medullary Carcinoma.
- Characterization of the growth curve of free-range turkeys using linear and non-linear models in locally adapted versus commercial hybrid genotypes.
- Comparison of an advanced automated ultrasonic scanner (AutoFom III) and a handheld optical probe (Destron PG-100) to determine lean yield in pork carcasses.