What Is a Confidence Interval? Formula and Examples
By Dr. Zubair Khalid, DVM, MS, PhD ·
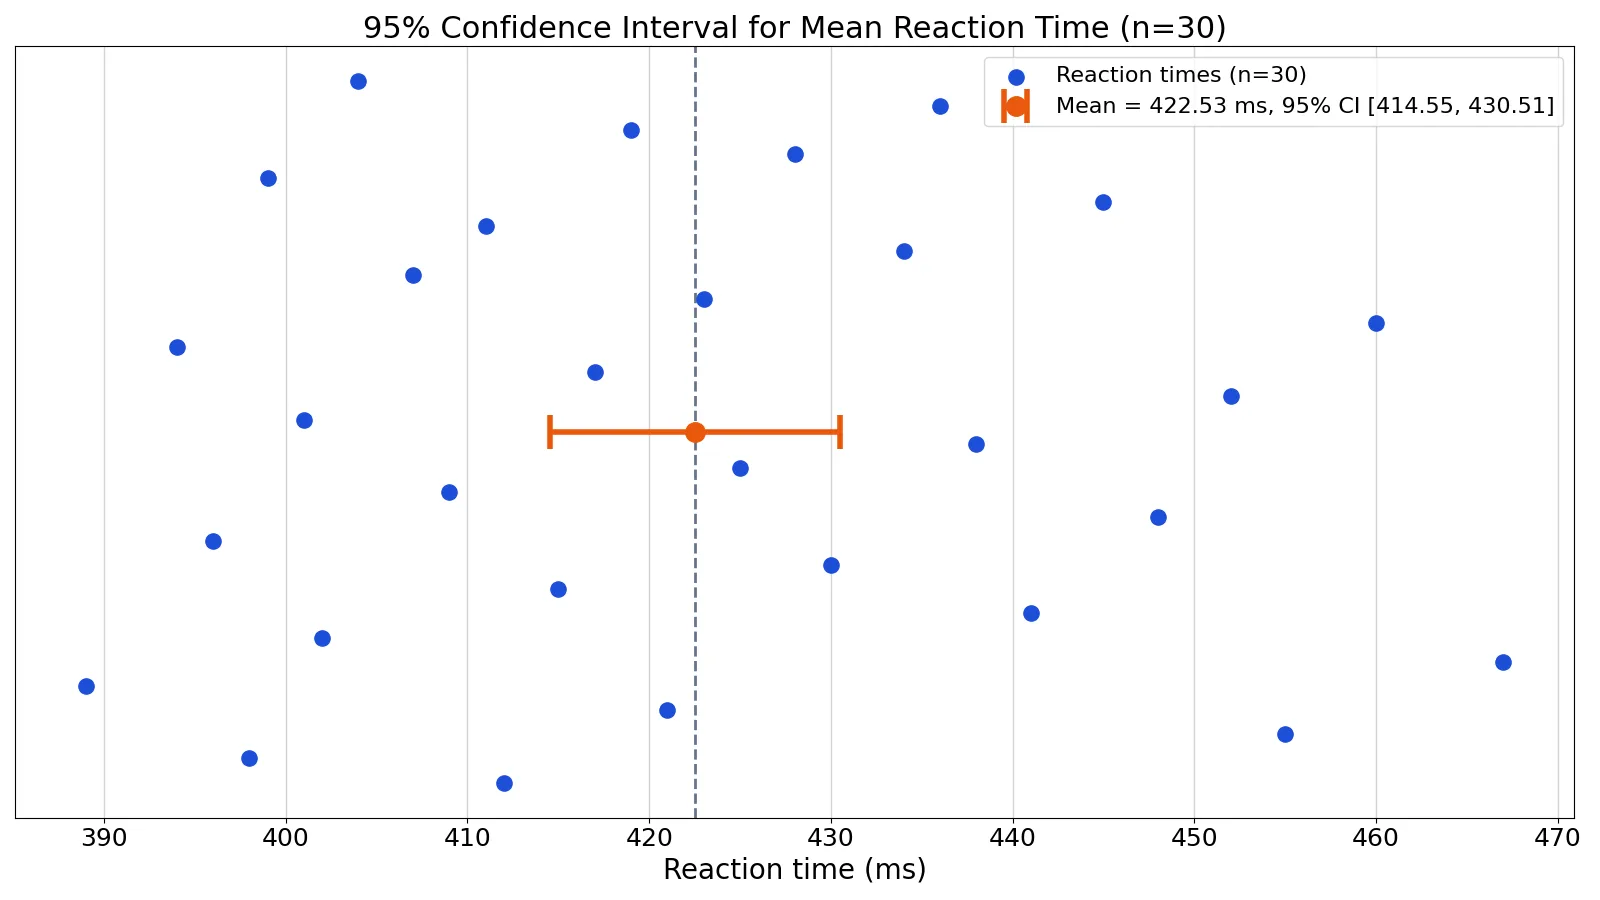
Confidence intervals turn a single sample estimate into a range of plausible values for the population mean. This article shows the formula, walks through a full calculation on real reaction-time data, and explains what the result does and does not tell you.
Quick Answer
- A confidence interval (CI) is a range built from sample data that is likely to contain the true population value [1].
- For a mean with unknown population standard deviation, the formula is $\bar{x} \pm t^* \times \dfrac{s}{\sqrt{n}}$.
- The confidence level (usually 95%) describes the method, not one specific interval. If you repeated the study many times, about 95% of the intervals you built would contain the true mean [2].
- Wider intervals mean less precision. You get a wider interval from a higher confidence level, a smaller sample, or more variable data [3].
- In the worked example below, 30 reaction times give a 95% CI of (414.5549, 430.5118) milliseconds.
What Confidence Intervals Mean
A confidence interval is a range of plausible values for a population parameter, calculated from your sample [2]. If you measure the average reaction time of 30 people and get 422.53 ms, the CI tells you which values of the true population mean are consistent with that sample.
The precise definition is about the procedure. You choose a confidence level, such as 95%. If you drew many random samples of the same size from the same population and built an interval from each one, about 95% of those intervals would contain the true population mean [4][1]. The level of confidence is a property of the method, not of any single interval you compute.
This is why a 95% CI does not mean "there is a 95% probability the true mean is in this interval." Once computed, the interval either contains the true mean or it does not. Your uncertainty is about whether your particular interval is one of the 95% that succeed [5][4].
How It Works
A confidence interval takes the form of a point estimate plus or minus a margin of error [4]. For a population mean, the point estimate is the sample mean $\bar{x}$.
When the population standard deviation $\sigma$ is known, the formula uses the standard normal critical value $z$:
$$ \bar{x} \pm z_{1-\alpha/2} \times \frac{\sigma}{\sqrt{n}} $$
When $\sigma$ is unknown, which is the usual case, you estimate it with the sample standard deviation $s$ and use the $t$ distribution instead [1]:
$$ \bar{x} \pm t^* \times \frac{s}{\sqrt{n}} $$
Each symbol means the following.
| Symbol | Meaning |
|---|---|
| $\bar{x}$ | Sample mean, the point estimate of the population mean |
| $s$ | Sample standard deviation, computed with $n-1$ in the denominator |
| $n$ | Sample size |
| $s/\sqrt{n}$ | Standard error of the mean |
| $t^*$ | Critical value from the $t$ distribution with $n-1$ degrees of freedom |
| $\alpha$ | 1 minus the confidence level, so 0.05 for a 95% interval |
The quantity $t^ \times s/\sqrt{n}$ is the margin of error. It is the value added to and subtracted from the sample mean to set the interval ends [6]. Three things control its size. A higher confidence level raises $t^$ and widens the interval [3]. A larger sample shrinks the standard error and narrows the interval [6]. More variable data raises $s$ and widens the interval.
Worked Example
A lab records 30 reaction-time measurements in milliseconds. The goal is a 95% confidence interval for the mean reaction time.
| 412 | 398 | 455 | 421 | 389 | 467 |
|---|---|---|---|---|---|
| 402 | 441 | 415 | 430 | 396 | 448 |
| 409 | 425 | 438 | 401 | 452 | 417 |
| 394 | 460 | 423 | 407 | 434 | 411 |
| 445 | 399 | 428 | 419 | 436 | 404 |
The steps are as follows.
- Sample size: $n = 30$.
- Sample mean: $\bar{x} = 422.5333$ ms.
- Sample standard deviation: $s = 21.3666$ ms.
- Standard error: $SE = s/\sqrt{n} = 21.3666/\sqrt{30} = 3.9010$.
- Degrees of freedom: $df = n - 1 = 29$.
- Critical value at 95%, two-sided: $t^* = 2.0452$.
- Margin of error: $ME = t^* \times SE = 2.0452 \times 3.9010 = 7.9784$.
- Interval: $[422.5333 - 7.9784,\ 422.5333 + 7.9784] = [414.5549,\ 430.5118]$.
The 95% confidence interval is (414.5549, 430.5118) ms. A bootstrap check with 10,000 resamples gives (415.1333, 430.0675) ms, which is close, as expected for a roughly symmetric sample of this size.
Here is the code that produces the $t$-based interval.
import numpy as np
from scipy import stats

data = [412, 398, 455, 421, 389, 467, 402, 441, 415, 430,
        396, 448, 409, 425, 438, 401, 452, 417, 394, 460,
        423, 407, 434, 411, 445, 399, 428, 419, 436, 404]

n = len(data)
mean = np.mean(data)
se = stats.sem(data)
tcrit = stats.t.ppf(0.975, df=n-1)
ci = (mean - tcrit*se, mean + tcrit*se)
print(f"({ci[0]:.4f}, {ci[1]:.4f})")
Output:
(414.5549, 430.5118)If you want to run your own numbers, the confidence interval calculator takes a sample and returns the interval directly.
How to Interpret It
Read the interval as a range of plausible values for the population mean, given your data and your confidence level. The center is your best estimate, 422.53 ms. The ends mark how far the estimate could reasonably be off because of sampling variability.
The width carries information. A narrow interval means your estimate is precise. A wide interval means the data pin the mean down loosely [2]. Comparing two intervals is often more useful than comparing two means, because the width shows how much trust each estimate deserves. This is the same logic behind using confidence intervals to judge the precision of a study's findings.
The interval also answers a hypothesis test in disguise. If a target value falls inside the 95% interval, you cannot reject the hypothesis that the population mean equals that value at the 0.05 level. If it falls outside, you can [5]. For a fuller treatment of the statement you write alongside the numbers, see how to write a confidence statement.
When to Use It (and when not to)
Use a confidence interval when you want to estimate an unknown population mean from a sample and report how much uncertainty surrounds that estimate [1]. It fits survey means, average test scores, mean reaction times, mean weights, and any other continuous measurement where you sampled from a larger group.
Use the $t$ formula when the population standard deviation is unknown and the data are roughly symmetric without extreme outliers. With small samples, the $t$ distribution widens the interval to account for the extra uncertainty in estimating $s$ [1]. With large samples, $t^*$ gets close to the $z$ values of 1.96 for 95% and 1.645 for 90% [6].
Do not use this formula when the data are heavily skewed and the sample is small, when observations are not independent, or when you need an interval for a proportion, a median, or a difference between groups. Those cases need different methods. If your measurements are counts or categories, check whether the variable is truly interval data before treating it as continuous.
Confidence Interval vs Standard Error
These two quantities are related but answer different questions. The standard error measures the typical distance between a sample mean and the population mean. The confidence interval converts that distance into a range using a critical value.
| Feature | Standard Error | Confidence Interval |
|---|---|---|
| What it is | Standard deviation of the sample mean | Range of plausible values for the parameter |
| Units | Same as the data | Same as the data |
| Depends on confidence level | No | Yes |
| Typical use | Describing sampling variability | Reporting an estimate with uncertainty |
| Example value | 3.9010 ms | (414.5549, 430.5118) ms |
The standard error is the building block. Multiply it by $t^*$ and you have the margin of error, which sets the interval width.
Common Mistakes
- Saying "there is a 95% probability the true mean is in this interval." The interval either contains the true mean or it does not. The 95% refers to the long-run success rate of the method [5][4]. Fix: say you are 95% confident the interval contains the mean, or describe the repeated-sampling property.
- Using $z = 1.96$ when $s$ comes from a small sample. With unknown $\sigma$ and a small $n$, the $t$ critical value is larger and the interval should be wider [1]. Fix: use $t^*$ with $n-1$ degrees of freedom whenever you estimate the standard deviation from the data.
- Dividing by $n$ instead of $\sqrt{n}$ in the standard error. The standard error is $s/\sqrt{n}$, not $s/n$. Fix: check the denominator before you compute the margin of error.
- Treating a wider interval as a better result. A wider interval means less precision, not more confidence in your estimate [2]. Fix: report the width and explain what drives it.
- Comparing two means by eye without their intervals. Two point estimates can differ while their intervals overlap heavily. Fix: compare the intervals, or compute an interval for the difference.
- Ignoring the assumptions. The $t$ interval assumes independent observations and a roughly normal sampling distribution. Fix: check a plot of the data and consider a bootstrap interval when the sample is small and skewed.
Limitations
A confidence interval only covers the parameter you built it for. A 95% interval for a mean says nothing directly about individual values, about medians, or about future samples. It also assumes your sample is representative. If the data come from a biased sampling process, the interval is centered on the wrong value and no amount of arithmetic fixes that.
The method is sensitive to its assumptions in small samples. With fewer than about 30 observations and clear skew or outliers, the $t$ interval can be misleading in either direction. The bootstrap alternative also struggles when the sample is tiny, because resampling a small sample cannot create information that was never there. Report the sample size and the interval together so readers can judge both.
Frequently Asked Questions
What is a 95% confidence interval in simple terms?
It is a range of values that is likely to contain the true population mean. The "95%" describes the method. If you repeated your study many times and built an interval each time, about 95 of every 100 intervals would capture the true mean [4][2].
What is the difference between a 90% and a 95% confidence interval?
The 95% interval is wider. A higher confidence level requires a larger critical value, which increases the margin of error [3]. In the reaction-time example, a 90% interval would use a smaller $t^*$ and produce narrower limits than (414.5549, 430.5118) ms.
Can a confidence interval contain zero or negative values?
Yes, if the data allow it. For a mean reaction time, negative values would be impossible in practice and would signal a problem with the data or the model. For a difference between two means, an interval containing zero means the data are consistent with no difference.
Does a larger sample size make the interval narrower?
Yes. The standard error is $s/\sqrt{n}$, so increasing $n$ shrinks it and narrows the interval without lowering the confidence level [6]. Quadrupling the sample roughly halves the width, because width depends on the square root of $n$.
How many observations do I need for a reliable confidence interval?
There is no fixed threshold. The $t$ interval works reasonably well from about 30 observations when the data are roughly symmetric, and it improves as $n$ grows. With smaller samples, check the shape of the data and consider a bootstrap interval as a cross-check.
References
- 7.1.4. What are confidence intervals?
- What's a Confidence Interval? Definition, Formula, & Significance
- 7.2: Confidence Intervals for the Mean with Known Population Standard Deviation - Statistics LibreTexts
- 2.2: Confidence Intervals - Statistics LibreTexts/02%3A_Sampling_Distributions_and_Confidence_Intervals/2.02%3A_Confidence_Intervals)
- 1.3.5.2. Confidence Limits for the Mean
- Confidence Intervals
Further Reading
Related Articles
- How to Calculate Confidence Level: Formula and Examples
- Interval Data: Definition, Examples and When to Use It
- How to Write a Confidence Statement (With Examples)
- Sample Mean: Definition, Formula and Examples
- Covariance Formula: Definition and Calculation Examples
- Credible Intervals vs. Confidence Intervals
- How to Use Confidence Intervals to Judge the Precision of a Study's Findings
- How to Calculate Number Needed to Treat (NNT) With a Confidence Interval