How to Calculate Confidence Level: Formula and Examples
By Dr. Zubair Khalid, DVM, MS, PhD ·
A confidence level calculation tells you how much of the time your interval would capture the true population mean if you repeated the study many times. You need three inputs: the sample mean, the sample standard deviation, and the sample size. From those you build an interval, and the confidence level is the probability attached to it, usually 90%, 95%, or 99%.
Quick Answer
- The confidence level is the long-run capture rate of your interval, not the probability that your specific interval is correct [1].
- For a mean with unknown population standard deviation, the interval is $\bar{x} \pm t^ \dfrac{s}{\sqrt{n}}$, where $t^$ comes from the t distribution with $n-1$ degrees of freedom [1].
- Standard error is $SE = s/\sqrt{n}$. Margin of error is $ME = t^* \times SE$.
- To find the confidence level from a known margin of error, solve $t = ME/SE$, then convert that t value to a probability.
- In Excel,
T.INV.2T(alpha, df)gives the critical value andT.DIST(t, df, TRUE)gives the cumulative probability.
Before You Start
You need a random sample, not a convenience sample. The formulas assume the observations are independent and that the underlying data are roughly normal, or that the sample is large enough for the Central Limit Theorem to smooth things out [1].
Decide whether you know the population standard deviation $\sigma$. If you truly know it, use the z distribution. In practice you almost never do, so you estimate it with the sample standard deviation $s$ and use the t distribution [1]. That is the path this article follows.
You also need to pick a confidence level before you compute the interval, or pick a margin of error and work backward to the level. Both directions use the same three quantities.
Step by Step
- Count your sample size. $n$ is the number of usable observations after removing missing values.
- Compute the sample mean. Sum the values and divide by $n$. If you need a refresher, see how to calculate the mean.
- Compute the sample standard deviation. Use the $n-1$ denominator, which is the sample standard deviation, not the population one. The mechanics are covered in how to calculate variance.
- Compute the standard error.
$$SE = \frac{s}{\sqrt{n}}$$
- Set the degrees of freedom. $df = n - 1$.
- Find the critical value. For a two-sided interval at confidence level $1-\alpha$, find $t^* = t_{1-\alpha/2,\,df}$.
- Compute the margin of error.
$$ME = t^* \times SE$$
- Build the interval. Lower bound is $\bar{x} - ME$, upper bound is $\bar{x} + ME$.
- To go the other way, from a margin of error to a confidence level, invert step 7. Compute $t = ME/SE$, then find the two-sided probability $CL = 2 \cdot P(T \le t) - 1$ with $df = n-1$ degrees of freedom.
Worked Example
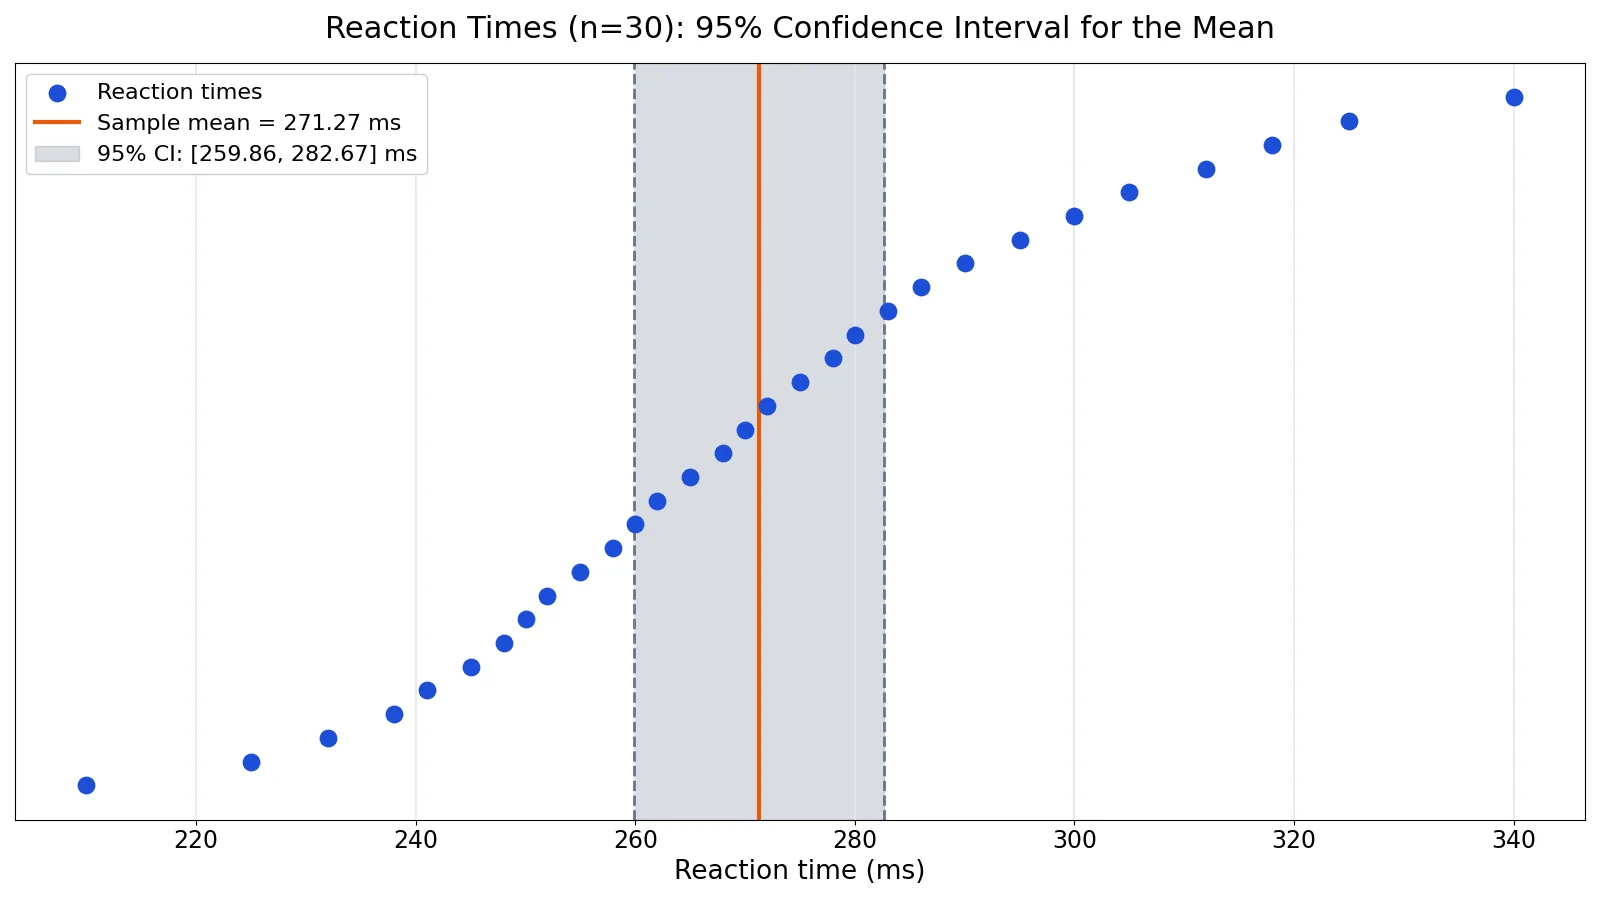
The dataset is 30 reaction times in milliseconds from a simple lab task.
| # | ms | # | ms | # | ms |
|---|---|---|---|---|---|
| 1 | 210 | 11 | 258 | 21 | 283 |
| 2 | 225 | 12 | 260 | 22 | 286 |
| 3 | 232 | 13 | 262 | 23 | 290 |
| 4 | 238 | 14 | 265 | 24 | 295 |
| 5 | 241 | 15 | 268 | 25 | 300 |
| 6 | 245 | 16 | 270 | 26 | 305 |
| 7 | 248 | 17 | 272 | 27 | 312 |
| 8 | 250 | 18 | 275 | 28 | 318 |
| 9 | 252 | 19 | 278 | 29 | 325 |
| 10 | 255 | 20 | 280 | 30 | 340 |
Step 1. Sample size. $n = 30$.
Step 2. Sample mean. $\bar{x} = 271.2667$ ms.
Step 3. Sample standard deviation. $s = 30.5365$ ms.
Step 4. Standard error.
$$SE = \frac{30.5365}{\sqrt{30}} = 5.5752 \text{ ms}$$
Step 5. Degrees of freedom. $df = 30 - 1 = 29$.
Step 6. Critical value at 95%. $t^* = \text{T.INV.2T}(0.05, 29) = 2.0452$.
Step 7. Margin of error.
$$ME = 2.0452 \times 5.5752 = 11.4025 \text{ ms}$$
Step 8. Interval.
$$95\% \text{ CI} = [271.2667 - 11.4025,\; 271.2667 + 11.4025] = [259.8641,\; 282.6692] \text{ ms}$$
Step 9. Back out the confidence level from a margin of error of 15 ms. This is the reverse direction, and it is the part most people miss.
$$t = \frac{15.0}{5.5752} = 2.6905$$
$$CL = 2 \cdot \text{T.DIST}(2.6905, 29, \text{TRUE}) - 1 = 0.9883$$
So a margin of error of 15 ms corresponds to a confidence level of about 98.83%. If you wanted a 15 ms margin of error and were targeting 95%, you would need a larger sample, because 95% only buys you 11.4025 ms at this sample size.
Here is the same computation in Python.
import statistics, math
from scipy import stats
times = [210, 225, 232, 238, 241, 245, 248, 250, 252, 255, 258, 260, 262, 265, 268, 270, 272, 275, 278, 280, 283, 286, 290, 295, 300, 305, 312, 318, 325, 340]
n = len(times)
mean = statistics.mean(times)
sd = statistics.stdev(times)
se = sd / math.sqrt(n)
t = stats.t.ppf(0.975, df=n-1)
moe = t * se
print(mean - moe, mean + moe)  # -> 259.8641 282.6692
Output:
mean = 271.2667 ms, s = 30.5365 ms, SE = 5.5752 ms
t* = 2.0452, ME = 11.4025 ms
95% CI = [259.8641, 282.6692] ms
Confidence level for ME=15 ms: 0.9883
The interval is the same one you would report in a confidence statement, and the underlying logic is the same as the confidence interval formula applied to a mean.
Other Ways to Do It
Excel. Put the values in a column. =AVERAGE(range) gives the mean, =STDEV.S(range) gives the sample standard deviation, and =COUNT(range) gives $n$. Then =T.INV.2T(0.05, n-1) gives $t^*$, and the margin of error is that value times $s/\sqrt{n}$. For this dataset, Excel returns a mean of 271.2667, a standard deviation of 30.5365, a margin of error of 11.4025, and bounds of 259.8641 and 282.6692.
A calculator. The Confidence Interval Calculator takes the mean, standard deviation, sample size, and confidence level and returns the interval directly. It is the fastest route when you only need the answer.
Known sigma. If you genuinely know the population standard deviation, swap $t^$ for $z^$. At 95% two-sided, $z^* = 1.96$ [1]. With $SE = 5.5752$, that gives a margin of error of 10.9274 ms, slightly narrower than the t-based one. The gap shrinks as $n$ grows.
Proportions. If your data are counts of successes, the formulas differ. The Wilson method is the usual recommendation for proportion intervals [2].
Troubleshooting
The interval looks too wide. Small samples and large standard deviations both widen it. Check whether you used $s$ instead of $\sigma$, and whether $n$ is what you think it is.
The confidence level comes out above 99.9% or below 50%. You probably divided the wrong way. $t = ME/SE$, not $SE/ME$.
Excel returns an error. T.INV.2T and T.DIST need a positive degrees of freedom. A sample of one observation gives $df = 0$ and no answer.
The t and z answers differ a lot. That happens at small $n$. Below about 30 observations, the t distribution has noticeably heavier tails and the difference matters [1].
Your software gives a slightly different interval. Different tools round intermediate values differently. Differences in the third decimal place are rounding, not error.
Common Mistakes
- Saying "there is a 95% chance the true mean is in this interval." The true mean is fixed. The 95% refers to the procedure: if you sampled repeatedly and built intervals each time, about 95% of them would contain the parameter [1]. Say that instead.
- Using the population standard deviation formula. Dividing by $n$ instead of $n-1$ understates $s$ and shrinks the interval. Use the sample standard deviation.
- **Using $z^ = 1.96$ with a small sample.* When $\sigma$ is estimated from the data, use $t^*$. The z value is only correct when $\sigma$ is known [1].
- Forgetting to halve alpha. A 95% two-sided interval uses the 97.5th percentile, not the 95th.
T.INV.2T(0.05, df)handles this for you. - Confusing the confidence level with the margin of error. The level is a probability. The margin of error is a distance in the units of your data. A 95% interval can be 2 ms wide or 200 ms wide.
- Treating a wide interval as proof of no effect. A wide interval means low precision, which usually means a small sample. It is not evidence that the effect is zero. The same logic applies when you use confidence intervals to judge precision.
Limitations
The t-based interval assumes independent observations from a roughly normal population, or a large enough sample that normality of the mean is a reasonable approximation [1]. It does not fix a biased sampling frame. If your sample is not representative, a tight interval just gives you a precise estimate of the wrong thing.
The method also assumes the standard deviation is estimated from the same sample and that observations are not clustered, repeated, or weighted. Survey data with complex designs, time series with autocorrelation, and clustered data all need different variance estimates. For very small samples or very skewed data, the interval can be misleading even when the arithmetic is right [2].
Frequently Asked Questions
How do you calculate confidence level from mean and standard deviation?
Compute the standard error as $s/\sqrt{n}$, find the critical t value for your chosen level with $n-1$ degrees of freedom, multiply to get the margin of error, and add and subtract it from the mean. The confidence level itself is the input you choose, not something the mean and standard deviation determine on their own.
How do you find the confidence level when you only know the margin of error?
Divide the margin of error by the standard error to get a t value. Then convert that t value to a two-sided probability using the t distribution with $n-1$ degrees of freedom. In the worked example, a 15 ms margin of error on a 5.5752 ms standard error gives $t = 2.6905$ and a confidence level of 0.9883.
What is the difference between confidence level and confidence interval?
The confidence level is a percentage, such as 95%. The confidence interval is the actual range of values, such as 259.86 to 282.67 ms. The level describes how often the method works across repeated samples, and the interval is what you report for this one sample [1].
Does a higher confidence level always mean a better result?
No. Raising the level widens the interval. A 99% interval is wider than a 95% interval built from the same data, so it is more likely to capture the parameter but less informative about where the parameter sits. The trade-off is between coverage and precision.
How large does the sample need to be?
There is no single cutoff. The t interval works reasonably well from about 30 observations when the data are not badly skewed, and it improves as $n$ grows [1]. If you need a specific margin of error, solve for $n$ using the margin of error formula and a planning estimate of the standard deviation.
References
Further Reading
- 7.1.5. What is the relationship between a test and a confidence interval?
- NIST/SEMATECH e-Handbook of Statistical Methods
- Wasserstein RL, Lazar NA (2016). The ASA Statement on p -Values: Context, Process, and Purpose. The American Statistician
- Krzywinski M, Altman N (2013). Significance, P values and t-tests. Nature Methods
Related Articles
- What Is a Confidence Interval? Formula and Examples
- How to Write a Confidence Statement (With Examples)
- How to Calculate the Mean: Formula and Step by Step Examples
- How to Find a Point Estimate: Formula and Examples
- Two Sample t-Test: Formula, Calculation and Example
- Test Statistic Formula: How to Calculate and Use It
- How to Calculate Number Needed to Treat (NNT) With a Confidence Interval
- How to Use Confidence Intervals to Judge the Precision of a Study's Findings