Structuring a Quantitative Research Proposal: A Narrative Framework
By Dr. Zubair Khalid, DVM, MS, PhD ·

By the end of this guide you will be able to draft a complete quantitative research proposal: a documented gap, answerable hypotheses, a defensible design, a reproducible sample-size justification, and an analysis plan that names a statistical test for every hypothesis. You will also know how the same core document expands into a grant application.
Have these on hand before you start:
- Your topic and target population
- The funder's or ethics committee's guidelines, including word limits and the scoring rubric
- A citation manager such as Zotero or EndNote
- R, which is free, or SPSS, for the sample-size and analysis work
- One published study protocol in your field to use as a calibration model
A quantitative research proposal is a written plan for a study that measures variables as numbers and tests hypotheses with statistics. The framework in this guide treats structuring a quantitative research proposal as building a narrative with a fixed arc. Each section answers the question a reviewer asks next: what is known, what is missing, what exactly will you do, how will you know it worked, and why should anyone pay for it. Methodologists describe this kind of ordered, transparent sequence of methodological decisions as the foundation of rigor and generalizability in quantitative work [1].
What a Quantitative Research Proposal Must Do
A proposal has two audiences with one shared skeleton. An ethics committee reads it to confirm that participants are protected. A reviewer or funder reads it to confirm that the study will produce a trustworthy answer to a question worth the money. The same document serves both, and a published study protocol shows the skeleton in final form. A perinatal mental health protocol specifies the design (a parallel convergent mixed-methods study across 8 hospitals in the Netherlands), the population (167 pregnant women up to 32 weeks of gestation), the primary outcome (the single result the study is framed around, here depressive symptoms on the Edinburgh Postnatal Depression Scale at 6 weeks postpartum), and the primary analysis (linear mixed-models) before any participant is enrolled [2].
Reviewers score the elements you would expect them to. A study of healthcare executives who approved a pilot grant found their decisions turned on five considerations: expected benefits, risks, partnerships, timing, and the credibility of the internal team championing the project [3]. Structure is how you place those elements where a reviewer expects to find them, in the order the reviewer's questions arrive.
| Proposal section | Reviewer question it answers |
|---|---|
| Background and gap | What is known and what is missing? |
| Aims and hypotheses | What exactly will you test? |
| Design | Can this design deliver the claim? |
| Population and sample | Who, how many, and how chosen? |
| Measures | How is each variable captured? |
| Analysis plan | How will the data answer the question? |
| Validity and bias control | Why believe the result? |
| Timeline, budget, data management | Can the team actually deliver? |
| Impact and dissemination | Why does it matter? |
Quantitative Research Proposal Structure, Step by Step
The nine steps below give the quantitative research proposal structure in the order most rubrics use.
Step 1: Establish the Problem and Document the Gap
Open with a funnel. One or two paragraphs on the broad problem, then narrow to the specific unknown your study will address. The gap must be documented, not asserted, and the standard way to document it is a review of existing evidence. A narrative review of the clinical nurse leader role summarized 25 implementation reports and found only 3 quantitative studies in the whole evidence base, then called for research to define the role's care-delivery structures and outcome indicators [4]. In materials science, a review of chiral metal clusters concluded that key quantitative relationships between cluster structure and enantioselective bioactivity remain elusive [5]. Both gap statements carry weight because they rest on systematic summaries of what already exists.
Close the section with a one-sentence gap statement in this form: although X is established, no study has Y in population Z. Every later section exists to close that sentence, so a vague gap sentence guarantees a vague proposal.
Step 2: Convert the Gap into Questions and Hypotheses
Each gap becomes one primary research question plus a small set of secondary questions. A quantitative hypothesis predicts a relationship between named variables. Assign every variable a role: the independent variable is what you compare or manipulate, the dependent variable is what you measure, and covariates, mediators, and moderators describe how other factors enter the relationship.
A published example shows the translation from theory to testable paths. Jing and colleagues proposed that community health information exposure is associated with chronic disease preventive behavior in middle-aged and older adults, with risk perception and preventive self-efficacy as chained mediators and health literacy as a moderator [6]. Written into a proposal, that theory reads as follows:
RQ1: Is community health information exposure associated with chronic
     disease preventive behavior among middle-aged and older adults?
H1:  Exposure is positively associated with preventive behavior.
H2:  Risk perception mediates the exposure-behavior association.
H3:  Preventive self-efficacy mediates the exposure-behavior association.
H4:  Health literacy moderates the mediated relationships.
Two rules keep this section tight. State a direction (positive, negative, or different) wherever prior theory supports one, and keep exactly one primary hypothesis. Everything else is secondary or exploratory, and the analysis plan must say which is which.
Step 3: Choose a Design That Can Deliver the Claim
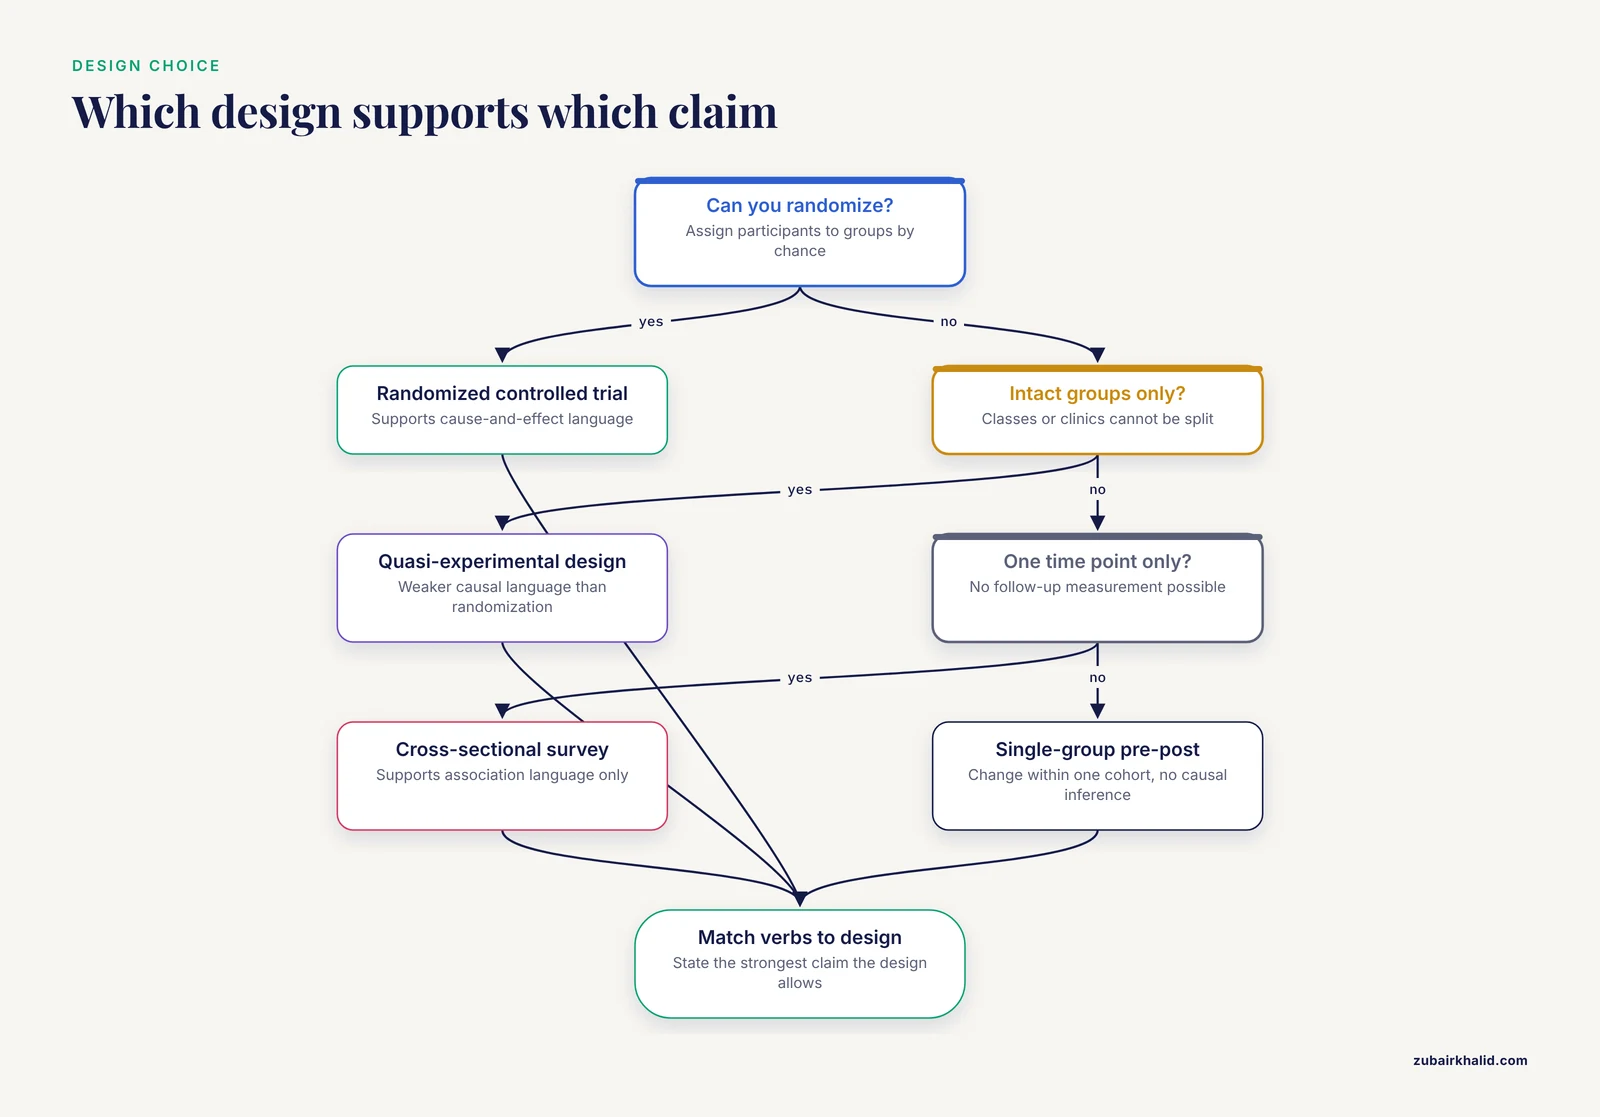
Your design sets the strongest causal verb your final paper is allowed to use. A randomized controlled trial assigns participants to groups by chance and supports cause-and-effect language. A quasi-experimental design compares groups without randomization, usually intact groups such as classrooms or clinics, and supports weaker causal language. A cross-sectional survey supports association language only. The table summarizes the standard options with published examples.
| Design | Use it when | Strongest claim it supports | Published example |
|---|---|---|---|
| Randomized controlled trial, including waitlist control | You can randomize and hold conditions constant | Causal | An 8-week online mindfulness program tested against a waitlist control across two hospitals [7] |
| Quasi-experimental pre-test/post-test with non-equivalent control group | Randomization is not feasible, as with intact school classes | Causal, weaker than randomization | Six educational videos tested across two high schools with a non-equivalent control group [8] |
| Cross-sectional survey | You need prevalence or associations at one time point | Association only | A physician survey linking burnout and patient safety culture [9] |
| Single-group pre-post | You measure change within one cohort over time | Change, no causal inference | A micropigmentation study in 18 women, whose authors state the design does not allow causal inference [10] |
| Secondary analysis of existing data | Large records already exist | Depends on the source design | K-prototypes clustering of 48,709 ICU patient records from the MIMIC-IV critical care database [11] |
| Pilot or feasibility study | Instruments or workflows are untested | Feasibility only | A mental health management workflow pilot tested with 107 community health officers across six Indian states [12] |
In a waitlist control trial, the comparison group receives the intervention after the study period ends, which keeps the trial ethical while preserving randomization.
Two additions. First, a quantitative core can sit inside a mixed-methods study, meaning one design that combines numeric data with interview or observational data. Published variants include the explanatory sequential design, in which quantitative results guide later interviews [13], and the convergent design, in which both strands run in parallel and merge at the interpretation stage [14]. Name your variant explicitly. Second, if your instruments or workflow are untested, propose a pilot first (the last row of the table).
Step 4: Define the Population, Sampling, and Sample Size
Specify four things: the target population, the sampling frame (the list you will actually draw from), the sampling method, and the number of participants.
Probability sampling gives every member of the population a known chance of selection. Convenience and purposive sampling do not, and both are publishable when justified. Published examples include site-based convenience sampling of 704 community residents for a health behavior survey [6], purposive selection of six universities for a multi-case study of research data management [15], and purposive selection of 11 stroke survivors for interviews from a quantitative cohort of 732 [13]. State the method, the justification, and the tradeoff in one sentence each.
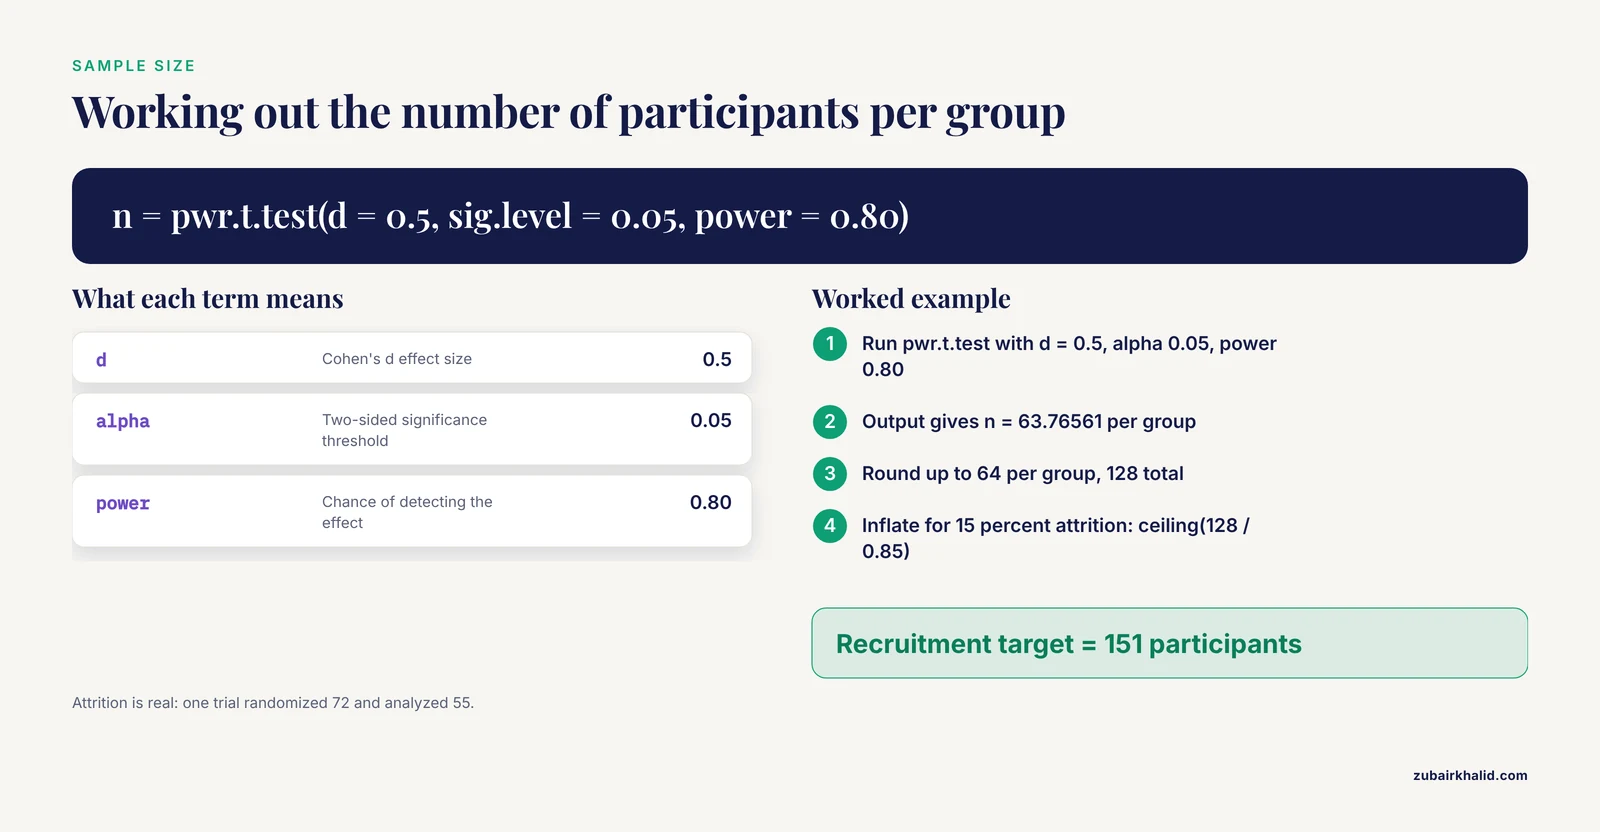
The sample-size justification reviewers look for is a power analysis. Statistical power is the probability that your test detects an effect of a given size when that effect exists. The conventional target is 80 percent power with a two-sided alpha of 0.05, where alpha is the threshold for calling a result statistically significant. The effect size is the smallest difference or relationship you would consider meaningful. For a two-group comparison of means, the calculation takes a few lines of R:
# install.packages("pwr")   # run once, then comment out
library(pwr)

pwr.t.test(d = 0.5, sig.level = 0.05, power = 0.80,
           type = "two.sample", alternative = "two.sided")

#      Two-sample t test power calculation
#
#                n = 63.76561
#                d = 0.5
#        sig.level = 0.05
#            power = 0.8
#      alternative = two.sided
#
# NOTE: n is number in *each* group
Here d is Cohen's d, the difference between group means divided by the pooled standard deviation. The output means 64 participants per group, or 128 total, for a medium effect. Then inflate for attrition, because real studies lose people:
Analyzed target    = 128 (64 per group)
Expected attrition = 15 percent
Recruitment target = ceiling(128 / 0.85) = 151
Attrition is not hypothetical. In a published trial of an online mindfulness program for junior doctors, 72 participants were randomized, 17 did not complete baseline measures, and 55 remained for analysis [7]. In a survey on research data management in Kenyan universities, investigators targeted 355 respondents and analyzed 306, roughly 86 percent [15]. Both figures belong in the feasibility paragraph of a proposal.
Step 5: Specify Variables and Instruments
For every variable, write an operational definition: the exact instrument, the scoring range, the time points, and who administers it. Prefer instruments with published validity and reliability evidence. Published protocols show the standard: discharge readiness measured with the Readiness for Hospital Discharge Scale alongside the Brief Illness Perception Questionnaire and a Social Support Rating Scale [13], and parental burnout measured with the Parental Burnout Assessment plus scales for psychological flexibility, self-compassion, and emotion regulation [16].
If no validated instrument exists, develop one, and say how. A cross-sectional study of 120 internal medicine physicians used an investigator-developed burnout and patient safety culture questionnaire built from a review of published literature and the domains covered by established instruments [9]. Your proposal needs the same provenance plus a pilot test before the main study.
Complex constructs can be condensed into scores. A malaria vulnerability study in an urban informal settlement in South Africa computed composite indices for climate stress, migration factors, and vulnerability from a structured household survey [14]. Measures need not be questionnaires. A nanobiotechnology study paired quantitative proteomics with near-infrared fluorescence readings across 25 surface chemistries of carbon nanotubes, using a physical signal as the outcome measure [17].
Step 6: Write the Analysis Plan Before Any Data Exist
The analysis plan names, for each hypothesis, the outcome, the statistical test, the alpha level, the software and version, and the missing-data method. Reviewers read vagueness here as evidence the analysis has not been thought through, and the criticism writes itself: the statistical approach is not specified.
Match the test to the data structure. Published studies show the standard pairings:
- Paired pre-post comparisons use paired t-tests for normal outcomes, Wilcoxon signed-rank tests for non-normal outcomes, and the McNemar test (a paired test for binary proportions) for before-after counts [18].
- Between-group post-test comparisons on ordinal data use the Mann-Whitney U test, with a Holm adjustment (a procedure that controls the false-positive rate across multiple comparisons) when several tests are run [8].
- Repeated measures across multiple time points call for linear mixed-models, a regression family that handles repeated and nested observations [2].
- Covariate adjustment uses hierarchical multiple linear regression, entering demographic and clinical variables first and the predictors of interest second [16].
- Mediation and moderation models use structural equation modeling (a framework that estimates several regression paths simultaneously) with bootstrap confidence intervals [6].
- Unobserved subgroups can be identified with latent profile analysis (a method that sorts participants into classes based on response patterns) and compared on correlates with multinomial logistic regression [13].
- Large secondary datasets can be partitioned with K-prototypes clustering (a clustering algorithm that handles mixed numeric and categorical variables) [11].
Name the software and version the way published studies do, for example IBM SPSS Version 28 for the quantitative analysis [15]. A finished plan produces quotable estimates. In the executed version of the model sketched in Step 2, preventive self-efficacy showed the strongest association with preventive behavior, a standardized coefficient (expressed in standard-deviation units so paths can be compared) of 0.528 [6].
A proposal-ready skeleton looks like this:
ANALYSIS PLAN (skeleton to adapt)

Primary outcome : <scale name> at <time point>
Primary model   : <e.g., linear mixed model with fixed effects for
                   group, time, and the group-by-time interaction>
Alpha           : 0.05, two-sided
Software        : <name and version>
Missing data    : <method named in advance>
Multiplicity    : <e.g., Holm adjustment across post-test comparisons>
Assumptions     : <checks named, e.g., residual normality>

H2 (mediation)  : structural equation model with bootstrap resampling
                  (state the number of resamples), report standardized
                  paths with confidence intervals
Step 7: Build In Validity, Reliability, and Bias Control
Internal validity is the degree to which the design rules out alternative explanations. The main tools are randomization, control or comparison groups, blinding where feasible, and stating hypotheses before data collection. External validity is the degree to which results generalize beyond your sample, and it is protected by describing the population and setting precisely.
Instrument quality needs its own paragraph. Report planned reliability checks (internal consistency for scales, inter-rater agreement for coded observations) and the validity evidence for any new instrument. Methodologists recommend pretesting and triangulation, meaning cross-checking across data sources and methods, before the main study [15], and observational methodologists tie rigor to explicit, transparent decision steps that support generalizability [1].
Name the biases that threaten your specific design with a countermeasure for each: selection bias (consecutive or random sampling), recall bias (short recall windows or records-based measurement), social desirability bias (anonymous administration), and attrition bias (tracking dropouts and comparing them with completers).
Step 8: Plan the Timeline, Budget, and Data Management
Work backward from the deadline and break the project into dated phases. A typical structure for a one-year study:
- Months 1 to 2: ethics approval, instrument licensing, staff training
- Months 2 to 3: pilot run and final instrument adjustments
- Months 3 to 9: data collection with monthly enrollment checkpoints
- Months 9 to 11: analysis following the pre-specified plan
- Months 11 to 12: manuscript, report, and dissemination
Adjust the proportions to the design. A waitlist-controlled trial needs follow-up windows built into the timeline, while a secondary analysis of an existing database compresses collection to weeks.
The budget lists personnel time, participant reimbursement, instrument licensing, software, equipment, travel, and publication fees, each tied to a phase. Reviewers read the budget as a feasibility test, so every line needs a one-sentence justification.
The data management plan states where data will be stored, how they will be documented, who can access them, when they will be shared, and how long they will be retained. Research data management is increasingly treated as core infrastructure for integrity, efficiency, and reuse, and its absence produces fragmented practices and data loss risks [15].
Step 9: Close the Narrative with Outcomes, Impact, and a Last-Written Abstract
End where the narrative began: the gap. State expected outcomes as measurable deliverables (a completed dataset, a validated workflow, an effect estimate with a confidence interval, meaning the range that would capture the true value in most repeated samples). Then state the impact: who will use the results and what changes if the hypotheses are supported. Sustainability and scalability move funders. In the executive decision study, the project team's explicit plans for financial sustainability, ongoing improvement, and scalability increased investment confidence [3].
Write the abstract last, from the finished sections, in the funder's required format: background, aim, design, sample, primary outcome, analysis, impact. Then revise the full document against the scoring rubric line by line, and hand the abstract and aims to a colleague outside your subfield. If they cannot restate your gap and your primary outcome, revise before submitting.
Quantitative Research Proposal Structure Tips
Seven tips that consistently improve a draft:
- Mirror the funder's headings exactly so reviewers find each scored element without hunting.
- Commit to one primary outcome. Secondary outcomes are welcome, but the headline claim rests on the primary one.
- Put a named test next to every hypothesis in the analysis plan.
- Allocate words in proportion to scoring weight. Methods usually earn more points than background.
- Pilot every instrument and workflow, and report completed pilot work in the proposal.
- Read published study protocols in your target journal to calibrate the expected level of detail.
- If the genre is new to you, take a research grant writing course. Institutions now treat proposal writing as a trainable capacity, and baseline studies of research culture repeatedly identify training needs among staff who are expected to produce and evaluate evidence [19].
Grant Proposal Planning: From Plan to Funded Project
A research proposal describes the science. A grant proposal wraps the same science in what a funder needs to release money: budget, timeline, team, and impact. Grant proposal planning therefore starts the day the call is released, not the week before the deadline.
Three planning habits pay off:
- Build the partnership list early. Partnerships weighed directly on funding decisions in the executive study described above [3]. Request letters of support while the proposal is still an outline, because partners respond faster to requests made months before a deadline.
- Draft the budget and timeline alongside the aims rather than after them. Every aim consumes person-hours, and a mismatch between aims and resources is a standard review criticism.
- Read the call's scoring criteria and assign each criterion a section of your document. If a criterion has no home, either the call does not fit your idea or the idea needs another section.
Finally, plan for rejection and resubmission as part of the cycle. Reviewer comments are the least expensive methodological consulting you will ever receive.
Common Mistakes and Limitations
The same failures recur across rejected proposals, and each has a direct fix:
- Asserting a gap without evidence. Anchor the gap statement in a review of existing evidence, as Step 1 shows with two published examples.
- A design that cannot deliver the claim. A single-group pre-post study can document change but cannot isolate causes (see the design table in Step 3). Add a control group or soften the verbs.
- Sample size by convenience. Recruiting whatever number is easy invites the exact criticism that the sample size is not justified. Attach a power calculation and an attrition assumption to every proposed n.
- A vague analysis plan. Data will be analyzed statistically is not a plan. Name the test, the alpha, the software version, and the missing-data method for each hypothesis.
- Unvalidated instruments with no development story. If the measure is new, describe its construction from the literature, its domains, and its pilot testing.
- Overpromising. Promising practice change, policy impact, and broad generalizability from a small single-site study invites skepticism. Match every claim to the design.
- Ethics and data management left to the end. Both take longer than expected, and either can block a start date.
Two limitations of the framework itself. Structure cannot substitute for substance, so a perfectly organized proposal about an unimportant question still fails. And no template replaces the funder's guidelines or your institution's ethics review, so individual studies will always need adjustment for local requirements and the specific population under study.
Frequently Asked Questions
How is a grant proposal different from a research proposal?
A research proposal presents the science: the gap, the question, the design, and the analysis plan. A grant proposal adds what a funder needs to release money, usually a budget, a timeline, a team description, and an impact statement, around the same scientific core.
How long should a quantitative research proposal be?
Whatever length the guidelines specify, because limits range from a two-page pre-proposal to a full application with appendices. Reviewers score completeness against the rubric, not word count, so a shorter document covering every scored element beats a longer one that rambles.
How detailed should the analysis plan be at the proposal stage?
Detailed enough that an analyst could run it without asking you a question. That means a named outcome, a named test, an alpha level, software and version, and a missing-data method for every hypothesis.
Do I need a statistician to justify my sample size?
Not for standard designs. Free tools such as the pwr package in R compute sample sizes for common tests in a few lines of code. Bring in a statistician for complex models such as multilevel or structural equation designs, and document every assumption either way.
Can a quantitative proposal include qualitative components?
Yes. Mixed-methods designs combine them, and the proposal should name the variant, such as an explanatory sequential design in which quantitative results guide later interviews, and state how the findings will be integrated.
What do reviewers read first?
The title, abstract, and aims, followed closely by the methods. If the gap and the primary outcome are not unmistakable by the end of page one, the remaining pages rarely recover a skeptical reviewer's attention.
When should grant proposal planning start?
On the day the call is released. Working backward from the deadline, most applicants need months for partnerships, budget negotiation, ethics paperwork, and internal review, so a compressed timeline is the most common self-inflicted disadvantage.
Is a research grant writing course worth it?
Yes for a first application. A structured course supplies rubric-based feedback, worked examples, and deadlines, which are exactly what self-taught writers lack, and institutions increasingly fund this training as part of research capacity building.
Sources
- Connect perspective of mixed methods research and systematic observation of participatory interaction.
- Evaluating multidisciplinary integrated perinatal mental healthcare versus monodisciplinary care: a multicentre mixed-methods study protocol.
- Executive Decision-Making: Piloting Project ECHO® to Integrate Care in Queensland.
- The current evidence base for the clinical nurse leader: a narrative review of the literature.
- Synthesis Strategies and Biomedical Applications of Chiral Metal Clusters: A Recent Research Progress.
- Community health information exposure and chronic disease preventive behavior among middle-aged and older adults an exploratory sequential mixed-methods study.
- A tailored online mindfulness intervention for junior doctors: a mixed-methods study.
- Effectiveness of a school-based educational video intervention for the prevention of technology-facilitated sexual violence among adolescent girls: a sequential explanatory mixed-methods study.
- Physician Burnout and Patient Safety Culture in Internal Medicine Departments: A Mixed-Methods Investigation Using an Investigator-Developed Questionnaire and Healthcare Provider Interviews.
- Impact of nipple-areola complex micropigmentation on quality of life, body image, and sexuality among women after mastectomy: a mixed-methods study.
- Developing Personas Based on the Identified Characteristics and Needs of ICU Patients: A Mixed-Methods Study.
- Development and pilot testing of workflow for screening and management of mental health conditions by front-line non-physician care providers in India: a mixed-methods approach.
- Assessment-need mismatch in discharge readiness among young and middle-aged stroke survivors: A mixed-methods study.
- Climate stress, migration, and emotional dimensions of malaria vulnerability: a mixed-methods study in an urban informal settlement, South Africa.
- From data neglect to data respect: A framework for institutionalising a sustainable research data management culture in Kenyan universities.
- Parental burnout among parents of adolescents with depressive disorders: an explanatory sequential mixed-methods study.
- Structure-Affinity Correlations and Separable Optical Activity in Carbon Nanotube Protein Coronas.
- "Now we Talk About it": A Mixed-Methods Study of a Multilayered Palliative Care Educational Intervention in Long-Term Care Homes in New Brunswick.
- Understanding existing research culture and capacity in a local authority (LA) and voluntary, community, faith and social enterprise(VCFSE) in one area of the South West, United Kingdom: a qualitative baseline study.