Tertiary Consumer: Definition and Food Web Role
By Dr. Zubair Khalid, DVM, MS, PhD ·
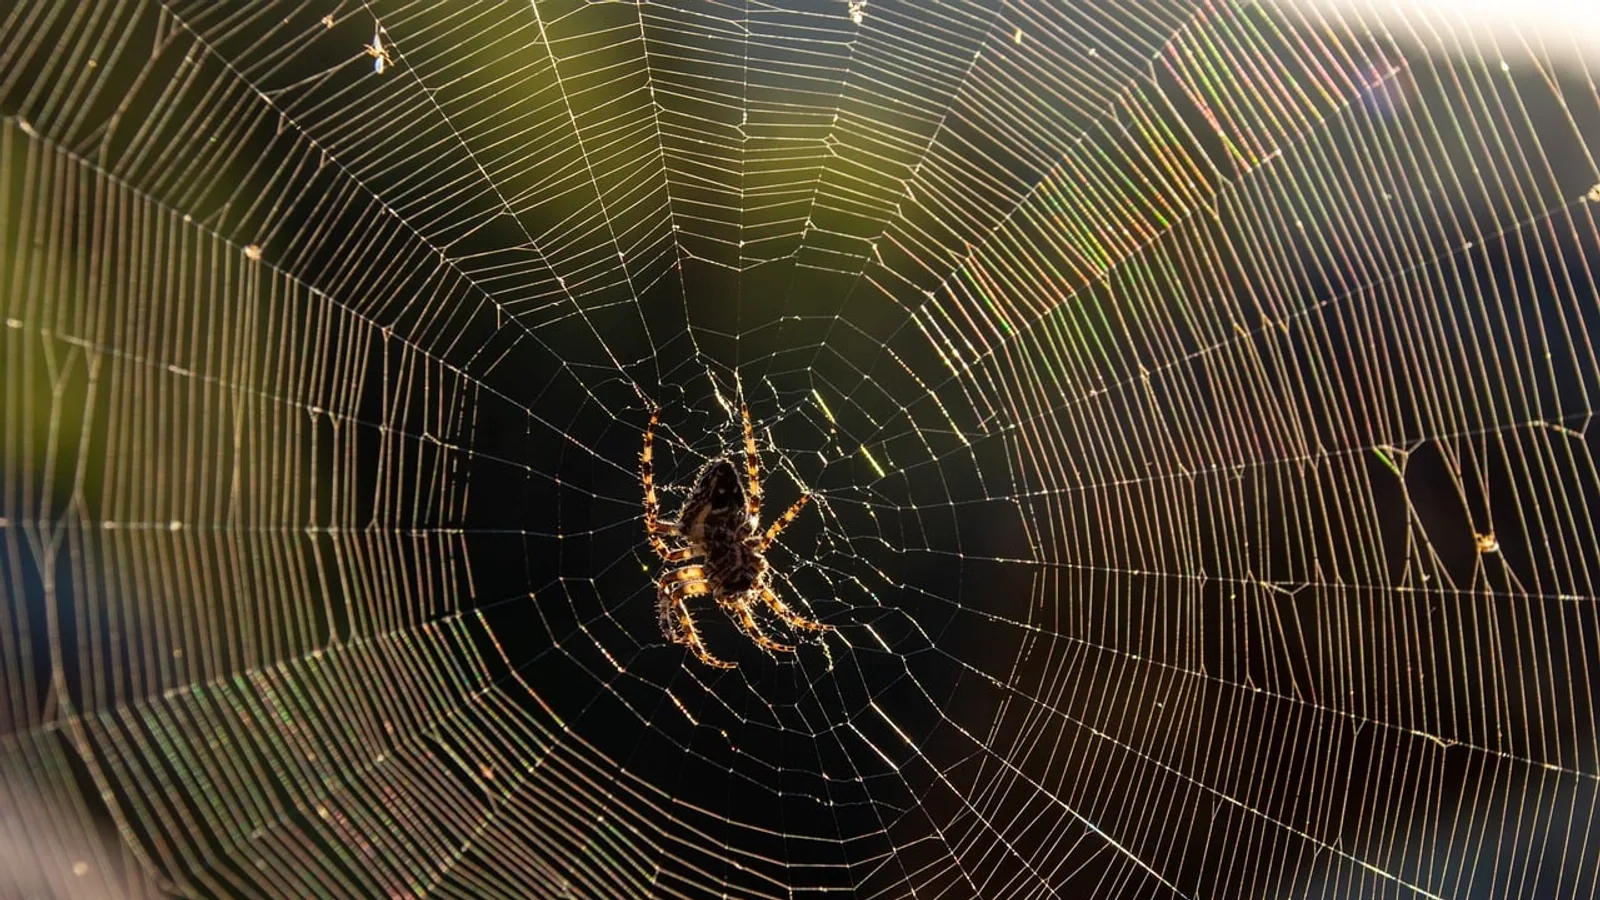
A tertiary consumer is an organism that eats secondary consumers, which places it at the fourth trophic level of a food chain. In plain terms, it is a predator that hunts other predators.
That single sentence hides a lot of ecology. Tertiary consumers sit near the top of most food webs, they shape the abundance of the animals below them, and they are the reason a food chain rarely runs past four or five links. Understanding what a tertiary consumer is also clears up a common confusion: a tertiary consumer is not always the same thing as an apex predator, and the two terms are not interchangeable. This guide defines tertiary consumers, distinguishes them from primary and secondary consumers, gives examples from land and water, and explains the energy math that limits how tall a food chain can grow.
What Is a Tertiary Consumer?


To define tertiary consumer precisely, you have to count trophic levels. A trophic level is a feeding position in a food chain, numbered from the base upward. Primary producers (plants, algae, phytoplankton) occupy level 1. Primary consumers (herbivores) occupy level 2. Secondary consumers (predators that eat herbivores) occupy level 3. Tertiary consumers occupy level 4.
So the definition is positional, not about size or ferocity. A tertiary consumer is any organism whose diet is dominated by secondary consumers. It eats carnivores. That is the defining feature.
This is why the term is relative rather than absolute. The same species can be a secondary consumer in one food web and a tertiary consumer in another, depending on what it eats and where it sits in that particular chain. Trophic level is a property of a feeding relationship, not a fixed label attached to a species forever.
The Four-Level Food Chain
A simple four-level chain looks like this:
- Primary producer: grass or phytoplankton
- Primary consumer: grasshopper or zooplankton
- Secondary consumer: frog or small fish
- Tertiary consumer: snake or larger fish
Each arrow in a food chain points in the direction energy flows, from the eaten to the eater. A food chain is a single path. A food web is the full network of overlapping paths, and most real ecosystems are webs, not chains.
Why the Definition Matters
Trophic position determines how much energy is available to an animal, how vulnerable it is to the loss of a prey species, and how pollutants concentrate in its tissues. In a study of a coastal lagoon in the Gulf of California, researchers reconstructed food webs from primary producers up to tertiary consumers and found that food webs were composed of four and five trophic levels, with fish and birds occupying the top-predator levels [1]. That is the typical architecture: a handful of levels, capped by a small number of predators.
Trophic position also matters for conservation. Large predators have disproportionate effects on the food webs beneath them, so assigning trophic positions correctly has real consequences for how those predators and their prey are managed [2].
The Trophic Level Table
The table below summarizes the four main levels, with example organisms and the approximate energy that remains at each step. The energy column applies the classic ten percent rule, which is explained in the next section.
| Trophic level | Feeding role | Example organisms | Energy remaining |
|---|---|---|---|
| 1 | Primary producer | Grass, oak leaves, algae, phytoplankton | 100 percent of captured solar energy |
| 2 | Primary consumer (herbivore) | Grasshopper, deer, zooplankton, rabbit | About 10 percent |
| 3 | Secondary consumer | Frog, small fish, songbird, mouse-eating snake | About 1 percent |
| 4 | Tertiary consumer | Shark eating tuna, hawk eating snake, wolf eating fox | About 0.1 percent |
The numbers are approximations, not constants. Real transfer efficiencies vary by ecosystem and by organism. An Ecopath model of the Veli-Akkulam Estuary in India calculated a transfer efficiency of 7.69 percent across the modeled food web [3], which is close to the textbook ten percent figure but not identical to it. The point of the ten percent rule is the order of magnitude, not the decimal place.
The Ten Percent Rule and Why Food Chains Stay Short
Energy is lost at every step. When a herbivore eats a plant, most of the plant's energy has already been used by the plant for its own metabolism, and much of what the herbivore ingests is never assimilated. It is lost as heat, excreted, or left behind in indigestible tissue. Only a fraction, classically about ten percent, becomes new herbivore biomass that a predator can eat.
Apply that fraction repeatedly and the arithmetic becomes brutal:
- Level 1 holds 100 units of energy.
- Level 2 holds about 10 units.
- Level 3 holds about 1 unit.
- Level 4 holds about 0.1 units.
- Level 5 would hold about 0.01 units.
By the fifth level, so little energy remains that it cannot reliably support a viable population of large predators. This is the standard explanation for why food chains rarely exceed four or five levels. The energy simply runs out.
Real ecosystems confirm the ceiling. The Gulf of California lagoon study found food webs with four and five trophic levels, with fish and birds at the top [1]. A separate study of a stream receiving treated wastewater tested whether added nutrients would lengthen the food chain and found that the effluent discharge did not change food chain length at all [4]. More resources at the base did not buy more levels at the top.
The limit is not perfectly rigid. Food chain length also depends on ecosystem size, disturbance, and how much energy enters the base of the web. But energy loss sets the hard boundary, and four or five levels is where most food webs stop.
How Warming Alters Trophic Dynamics
Energy flow is not static. Temperature changes it. An experiment on an aquatic food chain with the predator Hydra oligactis, its prey Ceriodaphnia reticulata, and the primary producer Ankistrodesmus falcatus tested how warming affects trophic cascades, the indirect effects a predator has on the levels below it. Warming strengthened the cascades, and higher temperatures also amplified transient population fluctuations, destabilizing the dynamics [5]. In a separate mesocosm experiment spanning a three-level food web of algae, herbivorous invertebrates, and predatory fish, elevated carbon dioxide boosted production at the base and pushed that benefit up through all levels, but warming reversed the effect by driving predators to consume prey faster as their metabolic demand rose [6]. Tertiary consumers sit at the receiving end of these shifts, and their feeding pressure changes with temperature.
Tertiary Consumer Examples Across Ecosystems
Tertiary consumer examples are easiest to remember when you anchor each one to a specific chain. The chain matters, because the same animal can occupy different levels in different webs.
Marine Example: Shark Eating a Tuna
Phytoplankton, then zooplankton, then a small forage fish, then a tuna, then a shark. The shark is the tertiary consumer in this chain because it eats the tuna, which is itself a predator of smaller fish. Marine food webs frequently reach four or five levels, and pelagic sharks in the Mediterranean show high trophic levels with generalist feeding habits [7]. Note that the shark is not always at level 4. A shark that feeds directly on plankton, like the basking shark, sits far lower, with a reported trophic level of about 3.2 [7]. This is a clean illustration of why trophic level is relational.
Terrestrial Example: Hawk Eating a Snake
Grass, then a grasshopper, then a frog, then a snake, then a hawk. The hawk is the tertiary consumer because it eats the snake, a secondary consumer. This is one of the most commonly taught tertiary consumer examples because each link is easy to visualize and the chain has exactly four levels.
Terrestrial Example: Wolf Eating a Fox
Plants, then a rabbit, then a fox, then a wolf. The wolf is the tertiary consumer in this chain. Wolves are also generalists that eat deer, elk, and smaller prey, so in many webs they function as both secondary and tertiary consumers depending on the meal. Large carnivores at top trophic levels respond to changing resource conditions in ways that ripple through the community, and drought research on lions, leopards, African wild dogs, and cheetahs in southern Africa shows how resource scarcity reshapes the space use and overlap of these top-level predators [8].
Freshwater Example: Predatory Fish Eating Smaller Fish
Algae, then zooplankton, then a small fish, then a larger predatory fish. This is the chain used in the mesocosm experiment described above, where the predatory fish was the tertiary consumer at the top of a three-level consumer sequence [6].
Terrestrial Apex Example: Barn Owl Eating Small Mammals
The barn owl food chain has been studied using bioindicator samples from three trophic levels: soil and moss, small mammal fur from regurgitated pellets, and barn owl feathers. The owl sits at the top as an apex predator, and mercury biomagnified up the chain, with a biomagnification factor of 1.8 from mammal fur to owl feathers [9]. This example is useful because it shows how a top predator accumulates what the levels below it have concentrated.
Tertiary Consumer vs. Apex Predator
These two terms overlap but are not synonyms, and mixing them up is one of the most common errors in ecology coursework.
An apex predator is defined by position at the top of a food web, with no predators of its own in that web. It can sit at trophic level 3, 4, or 5. A tertiary consumer is defined by diet, specifically by eating secondary consumers, which fixes it at level 4.
The consequences of that difference are practical:
- Every tertiary consumer that has no predators is an apex predator, but not every apex predator is a tertiary consumer.
- An apex predator in a short food web might be a secondary consumer. A top predator in a three-level chain eats herbivores, so it is a secondary consumer by diet even though it is the apex of that web.
- A tertiary consumer in the middle of a longer chain might still be eaten by something above it, so it is not an apex predator at all.
Leopard seals illustrate the second point from the other direction. They are described as apex predators and dietary generalists at the population level, yet most individuals are specialists, and individuals specialize at different trophic levels [10]. A single species can therefore contain individuals that function as secondary consumers and individuals that function as tertiary consumers within the same population.
Omnivores and Generalists Complicate Trophic Assignment
Strict trophic levels assume a tidy chain where each animal eats only one kind of food. Real animals do not cooperate with that assumption.
An omnivore eats from more than one trophic level. A bear that eats berries (level 1), fish (level 3), and occasionally small mammals (level 3 or 4) does not have a single trophic level. Ecologists handle this with the omnivory index, which measures how spread out an animal's feeding is across levels. Pelagic sharks in the Mediterranean showed a generalist trophic spectrum, meaning their feeding was not confined to one level [7].
Generalist predators create the same problem. Leopard seals have a broad trophic niche, with isotopic niche widths ranging from about 7 to 15 per mil, and most individuals turned out to be specialists rather than generalists [10]. A population-level label like "generalist" can hide the fact that individual animals feed at consistent, narrow levels.
Two practical rules follow:
- Assign trophic level to a feeding relationship, not to a species. Ask what this animal ate in this web.
- When an animal feeds across levels, report a range or a mean rather than a single number.
The measurement problem is real. Nitrogen stable isotope values are widely used to estimate trophic position, but a study of predatory vertebrate ectotherms (crocodilians, turtles, lizards, and fishes) found that although size and nitrogen isotope values correlate within a species, the relationship between stomach-content-based trophic level and body size was undetectable or negative. The authors warned that trophic position estimates based on nitrogen isotopes can be inaccurate and biased in ectotherms with large size ranges [2]. Body size alone does not predict trophic level.
How Trophic Position Is Measured
Several methods are used, and each has limits.
Stomach content analysis. Direct observation of what an animal has eaten. It gives the diet at the moment of sampling but misses seasonal and long-term variation.
Stable isotope analysis. Nitrogen isotope ratios (expressed as delta-15-N) increase in a predictable direction with trophic level, so tissues record what an animal has assimilated over time. This method integrates diet across weeks or months depending on tissue turnover. It is now common in marine predator studies, including work on Norwegian killer whales where amino acid-specific nitrogen isotope analysis was used to distinguish fish-only diets from mixed diets that included marine mammals [11].
Mass-balanced models. Tools like Ecopath with Ecosim build a quantitative model of an entire food web, assigning fractional trophic levels to functional groups. An Ecopath model of the Veli-Akkulam Estuary integrated 17 functional groups and reported a mean trophic level of the catch of 2.69, indicating a simplified, detritus-dominated web with declining trophic maturity and a marked decline in apex predators and native piscivores [3].
Bioindicator sampling. For pollutants, researchers sample across known trophic levels and calculate magnification factors. The barn owl study used soil, moss, small mammal fur, and owl feathers to trace mercury through three levels [9].
The choice of method changes the answer. Isotope-based trophic position and diet-based trophic position can disagree, which is why careful studies report both and explain the gap [2].
Why Tertiary Consumers Matter in Food Webs
Tertiary consumers exert top-down control. By eating secondary consumers, they reduce predation pressure on primary consumers, which can in turn change the abundance of primary producers. This chain of indirect effects is called a trophic cascade, and it is one of the clearest demonstrations that predators structure ecosystems.
The Hydra experiment showed that warming strengthens trophic cascades in an aquatic food chain and that the effect runs through temperature-sensitive changes in interaction strengths and demographics [5]. This matters for prediction. If predator loss weakens top-down control, the effects can be magnified by warming in ways that are difficult to anticipate from single-species data.
Tertiary consumers also accumulate pollutants. Because they eat organisms that have already concentrated contaminants, they receive a concentrated dose. Mercury biomagnified from small mammal fur to barn owl feathers with a factor of 1.8 [9]. In marine systems, apex predators face elevated risk from heavy metal accumulation through trophic transfer [12]. In Jinpu Bay, China, researchers found that trophic magnification of phthalate esters depended on food web structure: a web spanning trophic levels 1.5 to 3.5 showed trophic dilution, while a web dominated by mid-to-high trophic level taxa spanning levels 3.0 to 4.0 showed trophic magnification [13]. Whether a contaminant concentrates at the top depends on the shape of the web, not just the chemical.
Tertiary consumers are also the most vulnerable to habitat change and prey loss. When apex predators and native piscivores decline, biomass concentrates at lower trophic levels and the web simplifies [3]. The loss of top-level predators is one of the most consistent signatures of ecosystem degradation.
Quick Review
- A tertiary consumer eats secondary consumers and occupies the fourth trophic level.
- Trophic level is positional and relational, not a fixed species label.
- The ten percent rule explains why food chains rarely exceed four or five levels.
- A tertiary consumer is not automatically an apex predator, and an apex predator is not automatically a tertiary consumer.
- Omnivores and generalists feed across levels, so trophic position should be reported as a range or mean.
- Stable isotopes, stomach contents, and mass-balanced models each estimate trophic position differently and can disagree.
- Tertiary consumers drive trophic cascades and accumulate pollutants at higher concentrations than the levels below them.
The flowchart below traces the decision path for assigning an organism to a trophic level.
flowchart TD
    A[Start with one organism] --> B[What did it eat in this web]
    B --> C{Eats primary producers}
    C -->|Yes| D[Primary consumer level 2]
    C -->|No| E{Eats primary consumers}
    E -->|Yes| F[Secondary consumer level 3]
    E -->|No| G{Eats secondary consumers}
    G -->|Yes| H[Tertiary consumer level 4]
    G -->|No| I[Higher level or mixed diet]
    H --> J{Any predators in this web}
    J -->|No| K[Apex predator]
    J -->|Yes| L[Not an apex predator]
    I --> M[Report a range or mean]
Common Mistakes and Limitations
Treating tertiary consumer and apex predator as synonyms. They are defined differently. Tertiary consumer describes diet. Apex predator describes position at the top of a web. A top predator in a three-level chain is a secondary consumer by diet.
Assigning a species one permanent trophic level. The same species can be a secondary consumer in one web and a tertiary consumer in another. Basking sharks sit near level 3.2 while other pelagic sharks sit much higher [7].
Assuming body size predicts trophic level. A study of ectotherm vertebrate predators found no reliable relationship between stomach-content-based trophic level and body size, and warned that isotope-based estimates can be biased in species with wide size ranges [2].
Ignoring omnivory. An animal that eats plants and animals does not have a single trophic level. Report a range or use an omnivory index.
Assuming more resources always mean longer food chains. A whole-stream wastewater experiment increased nutrients and primary production but did not change food chain length [4].
Assuming every contaminant magnifies at the top. Trophic magnification depends on the chemical and on food web structure. Phthalate esters showed dilution in one web and magnification in another within the same bay [13].
Reading a single study as a universal rule. Transfer efficiency, cascade strength, and magnification factors vary by ecosystem, temperature, and species composition. The ten percent rule is a useful approximation, not a measured constant.
Individual cases in a specific ecosystem require local data and, for managed or protected species, professional ecological assessment.
Frequently Asked Questions
What is a tertiary consumer in simple terms?
A tertiary consumer is an animal that eats other predators. It sits at the fourth trophic level, above primary producers, herbivores, and the carnivores it feeds on.
What are tertiary consumers in a food chain?
They are the fourth link in a food chain. Energy passes from producers to herbivores to secondary consumers and then to tertiary consumers, with roughly ten percent surviving each transfer.
Is a tertiary consumer the same as an apex predator?
No. A tertiary consumer is defined by eating secondary consumers. An apex predator is defined by having no predators in its web, and it can sit at level 3, 4, or 5.
What is a tertiary consumer example in the ocean?
A shark that eats a tuna is a tertiary consumer. The chain runs phytoplankton, zooplankton, forage fish, tuna, shark.
Can one animal be both a secondary and a tertiary consumer?
Yes. Generalists and omnivores feed across levels. A wolf eats rabbits (secondary consumer role) and foxes (tertiary consumer role) depending on the meal.
Why do food chains rarely have more than four or five levels?
Energy loss. About ninety percent of energy is lost at each transfer, so by the fifth level too little energy remains to support a viable predator population.
Related Articles
- Tertiary Structure Of Protein
- Coral Reef Food Webs: A Veterinary Perspective on Marine Aquarium Nutrition
- Food Safety in Poultry Meat: Bacterial Pathogens, Thermal Inactivation, and Consumer Guidelines
- Best Cat Water Fountain Consumer Reports
- PubMed vs. Scopus vs. Web of Science
- Journal Finder vs. Scopus vs. Web of Science
- Primary Consumer: Definition and Food Chain Role
- Food Web: Definition, Diagram, and Examples
- Greater Trochanter: Anatomy, Attachments, and Role
Sources
- The influence of anthropogenic organic matter and nutrient inputs on the food web structure in a coastal lagoon receiving agriculture and shrimp farming effluents.
- Body size predicts ontogenetic nitrogen stable-isotope (δ(15)N) variation, but has little relationship with trophic level in ectotherm vertebrate predators.
- Bio-invasion and decadal changes in the trophic dynamics of a temporarily closed estuary: An Ecopath model from Veli-Akkulam Estuary, Kerala, India.
- Whole-stream wastewater addition stimulates the green food web pathway but does not affect food chain length.
- Warming increases trophic cascade strength in an aquatic food chain.
- Boosted food web productivity through ocean acidification collapses under warming.
- Beyond the Meal: Trophic Controls by Pelagic and Demersal Chondrichthyes in Two Different Mediterranean Marine Food Webs.
- Droughts reshape apex predator space use and intraguild overlap.
- Mercury accumulation and biomagnification in the barn owl (Tyto alba) food chain.
- Individual Specialization in a Generalist Apex Predator: The Leopard Seal.
- Advancing Amino Acid Isotope-Inferred Trophic Ecology in an Apex Predator: Insights From a Data-Rich Killer Whale Population.
- Bioaccumulation and Trophic Transfer of Heavy Metals in Marine Fish: Ecological and Ecosystem-Level Impacts.
- Bioaccumulation and trophic transfer of phthalate esters in the food webs of Jinpu Bay, China: Health risks assessment for spotted seals.