Primary Consumer: Definition and Food Chain Role
By Dr. Zubair Khalid, DVM, MS, PhD ·
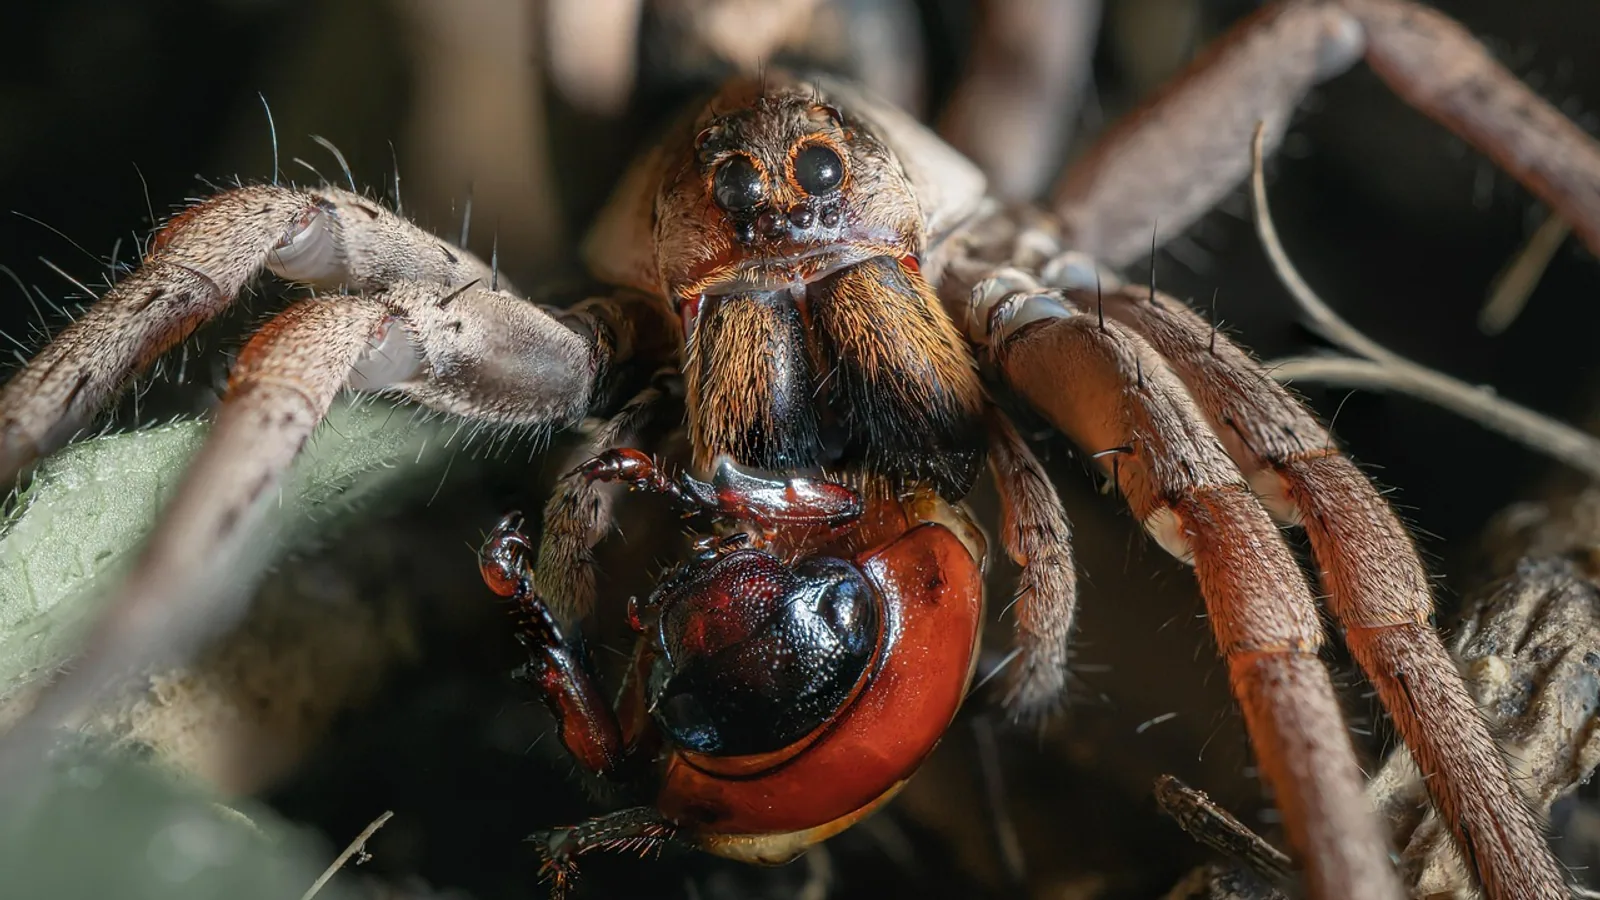
A primary consumer is an organism that feeds directly on primary producers, which are the plants, algae and photosynthetic microbes at the base of a food chain. In practice, primary consumers are herbivores: the grasshopper eating grass, the zooplankton grazing algae, the rabbit cropping clover.
That single definition carries more weight than it first appears. Primary consumers are the hinge between the living energy that plants capture from sunlight and the predators that depend on that energy. Remove them and a food chain collapses from the middle, no matter how healthy the producers or the predators happen to be. Understanding the primary consumer role also explains why ecologists treat trophic levels as functional positions rather than fixed species labels, and why the same animal can sit at different levels depending on what it ate that day.
What Is a Primary Consumer?
A primary consumer is any heterotroph that obtains its energy and carbon by consuming primary producers. Heterotroph means an organism that cannot fix its own carbon and must eat other organisms. Primary producers, also called autotrophs, build organic matter from inorganic carbon using photosynthesis or, in some environments, chemosynthesis.
The term is positional. It describes where an organism sits relative to the base of a particular food chain, not what it is. A primary consumer occupies trophic level 2. Trophic level 1 is the producer. Trophic level 2 is the first consumer above it. Every step upward adds one.
Three features define the category:
- Direct dependence on producers. The energy in a primary consumer's body came from a plant, alga or photosynthetic microbe, usually within the last few days to weeks.
- Herbivory as the dominant feeding mode. The organism's mouthparts, digestive tract and behavior are built around plant or algal material.
- Position at trophic level 2. This is the first consumer level, immediately above the producers.
Primary consumers appear in every ecosystem that has primary production. In grasslands they are grasshoppers, voles and grazing cattle. In lakes and oceans they are zooplankton such as Daphnia, copepods and filter-feeding bivalves. In forests they are caterpillars, aphids and deer. In streams they are macroinvertebrates that scrape periphyton off rocks [1]. In soil they are nematodes, mites and earthworms feeding on root exudates and detritus [2].
Why the Primary Consumer Role Matters
Primary consumers convert plant biomass into animal biomass, a process ecologists call secondary production. Net secondary productivity is the amount of consumer biomass produced per unit area per year, and it is the pool that every predator above depends on. In the rangelands of the Central Great Plains, net secondary productivity supported by primary production is the foundation of the dominant non-cultivated land use, livestock grazing [3].
Primary consumers also regulate the producers below them. Grazing pressure can hold algal or plant biomass in check, change species composition, and alter how much carbon stays in the system. In streams, when treated wastewater effluent increased biofilm biomass, primary consumers shifted their diets toward that green pathway even though coarse detritus remained their main food resource [4]. That is a direct demonstration that primary consumers respond to changes in producer supply.
Energy moving through this level is finite. Roughly 10 percent of the energy at one trophic level is incorporated into biomass at the next, a pattern known as the ten percent rule. The rest is lost to respiration, heat, waste and unconsumed tissue. This is why food chains are short: not enough energy survives many transfers to support a sixth or seventh level.
The Food Chain, Step by Step
A food chain is a linear sequence of who eats whom, starting with a producer and ending with a top predator. Energy and matter move in one direction along that sequence.
- Sunlight is captured. Producers absorb light and fix carbon dioxide into sugars.
- Producers build biomass. Grass, algae, phytoplankton and periphyton accumulate organic matter.
- Primary consumers eat producers. A grasshopper chews a blade of grass. A Daphnia filters an algal cell from the water.
- Energy is assimilated. The consumer digests what it can, respires most of it for its own metabolism, and stores a fraction as new tissue.
- Secondary consumers eat primary consumers. A frog takes the grasshopper. A fish takes the Daphnia.
- Tertiary consumers eat secondary consumers. A heron takes the frog. A tuna takes the smaller fish.
- Decomposers process everything that dies. Bacteria and fungi break down dead tissue from every level and return nutrients to the soil or water.
The following diagram shows the main flow of energy through a simple grazing food chain, with decomposers receiving material from every level.
flowchart TD
    A[Sunlight] --> B[Primary producers]
    B --> C[Primary consumers]
    C --> D[Secondary consumers]
    D --> E[Tertiary consumers]
    B --> F[Decomposers]
    C --> F
    D --> F
    E --> F
    F --> G[Nutrients returned to soil or water]
    G --> B
Trophic Levels and Energy Transfer
A trophic level is a functional position in a food web, defined by the number of transfers between an organism and the base of the chain. It is not a property of a species. Ecologists estimate trophic position in the field using stable nitrogen isotopes, because nitrogen-15 becomes enriched by roughly 3 to 4 parts per thousand with each step up the chain [5][6].
The table below summarizes the main levels, their definitions, example organisms and the approximate efficiency of energy transfer from the level below.
| Trophic level | Definition | Example organism | Energy transfer from level below |
|---|---|---|---|
| 1. Producers | Autotrophs that fix inorganic carbon into organic matter | Grass, oak leaves, Scenedesmus obliquus, phytoplankton | Not applicable, this is the base |
| 2. Primary consumers | Herbivores that eat producers | Grasshopper, Daphnia magna, rabbit, zooplankton, cattle | About 10 percent of producer energy |
| 3. Secondary consumers | Carnivores or omnivores that eat primary consumers | Frog, wolf, tuna, Chaoborus obscuripes, parasitoid wasps | About 10 percent of primary consumer energy |
| 4. Tertiary consumers | Carnivores that eat secondary consumers | Heron, large shark, osprey | About 10 percent of secondary consumer energy |
| Decomposers | Organisms that break down dead tissue from all levels | Soil bacteria, fungi, dung beetles | Sit outside the linear chain |
The ten percent figure is a working average, not a law. Real transfer efficiencies range widely. In a laboratory freshwater chain, the antibiotic azithromycin concentrated in the alga Scenedesmus obliquus with a bioconcentration factor of 1017 liters per kilogram, but the biomagnification factor from the primary consumer Daphnia magna to the predator Chaoborus obscuripes was below 0.032, indicating trophic dilution rather than concentration [7]. That study measured a chemical, not energy, but it illustrates the same principle: transfer between levels is inefficient and highly variable.
What Are Secondary Consumers?
A secondary consumer is an organism that eats primary consumers. Secondary consumers are carnivores or omnivores, and they occupy trophic level 3 in a simple chain. The term answers the question of position, not taxonomy: a secondary consumer is whatever eats a herbivore in that particular chain.
Examples span ecosystems:
- Freshwater. The midge larva Chaoborus obscuripes preys on Daphnia, making it a secondary consumer in that simplified chain [7]. Carnivorous fish in streams occupy the same position [1].
- Terrestrial. A frog eats a grasshopper. A wolf eats a rabbit. A parasitoid wasp develops inside a caffeine-fed herbivore and shows reduced longevity in the next generation, a cascade from primary to secondary consumer [8].
- Marine. A tuna eats smaller fish that have been eating zooplankton. Northern shrimp act as mid-trophic level consumers, eating diatoms and zooplankton while being eaten by higher-level predators including commercial fish [9].
- Soil. Predatory mites and nematophagous fungi eat primary consumers such as bacterial-feeding nematodes [2].
Secondary consumers control herbivore populations. When herbivore numbers rise, predator numbers often follow with a lag, and the resulting grazing pressure on producers eases. This top-down effect is one of the classic mechanisms of food web regulation.
Trophic Level Is a Position, Not a Species Trait
This is the single most misunderstood point in food chain biology. Trophic level describes what an organism ate, in a specific place, at a specific time. It does not describe what the organism is.
A clear example is the omnivore. A human who eats a salad occupies trophic level 2. The same human eating a steak occupies trophic level 3. A bear eating berries is a primary consumer. The same bear eating a salmon is a secondary consumer. A rat eating grain is a primary consumer. A rat eating a grasshopper is a secondary consumer.
The same logic applies across the tree of life. Daphnia magna is a primary consumer when it grazes algae [7]. Northern shrimp eat diatoms and zooplankton, mixing producer and consumer material in one diet, which places them at an intermediate position rather than a clean integer [9]. Benthic amphipods show species-specific feeding preferences, with some taxa grazing on organic matter in sediment and others predating small invertebrates, producing a range of estimated trophic levels within one taxonomic group [6].
Ecologists therefore report trophic position as a continuous number, often between 2.0 and 4.5, rather than assigning a fixed level to a species. A generalist omnivore might average 2.8 across a season. The number changes with prey availability, season and body size.
The practical consequence is that you cannot list "primary consumers" as a fixed set of species. You list feeding relationships.
How Ecologists Measure Trophic Position
Three methods dominate the field.
Stable isotope analysis. Nitrogen-15 enrichment of about 3 to 4 parts per thousand per trophic step provides a direct estimate of trophic position. Carbon-13 distinguishes the ultimate source of energy, such as benthic versus pelagic production or mangrove versus phytoplankton [5][10]. A landscape-scale study of the Dutch Wadden Sea used 9,165 samples from 839 locations across 178 species to show that benthic microphytobenthos, not pelagic phytoplankton, was the most important energy source for most higher-level consumers [10].
Gut content and feeding observations. Direct inspection of stomach contents identifies recent meals. This method is precise about identity but captures only the last meal.
Fatty acid and biochemical tracers. Specific fatty acids pass from prey to predator with limited modification, so their profiles reveal dietary sources. Northern shrimp lipid composition showed strong seasonality tied to resource availability, with storage triacylglycerols making up over half of total lipids [9].
In practice, researchers combine methods. Stable isotopes give the average position over weeks to months. Gut contents give the snapshot. Fatty acids give the source.
Primary Consumers Across Ecosystems
The category looks different in each biome because the producers differ.
Grasslands. Grasshoppers, voles, prairie dogs and grazing livestock eat grasses and forbs. Net secondary productivity in the Central Great Plains follows a saturating relationship with precipitation, meaning gains flatten as rainfall increases [3].
Freshwater lakes. Zooplankton such as Daphnia and copepods graze phytoplankton. An 18-year monthly monitoring dataset of 137 phytoplankton and 91 zooplankton taxa in a subtropical lake showed that species diversity stabilized communities mainly by increasing population asynchrony within each trophic level [11].
Streams. Macroinvertebrates scrape periphyton and shred leaf litter. Loss of riparian canopy cover reduced the transfer of polyunsaturated fatty acids and simplified trophic links between primary and secondary consumers [1].
Oceans. Copepods, krill and filter-feeding bivalves graze phytoplankton and benthic microalgae. Latitudinal patterns in estuarine food webs show that food chain length decreased with chlorophyll-a concentration and increased with latitude, with the dominant primary source shifting from mangrove in the tropics to macroalgae and periphyton in subtropical latitudes and saltmarsh and seagrass in temperate zones [5].
Soil. Protists, nematodes, mites and earthworms feed on root material, bacteria and fungi. Soil consumers drive carbon mineralization and nutrient release, which supports plant growth and aboveground biodiversity [2].
Groundwater and caves. In some subterranean systems, chemolithoautotrophic bacteria replace photosynthesis as the base of the food web, supporting macroinvertebrate consumers and higher trophic levels in the absence of sunlight [12].
Microbial systems. Even in a bioreactor, a community of over 100 species organized into trophic levels, with a few benzene-degrading organisms supporting many primary consumers that fed on metabolic leftovers and necromass [13].
Where Decomposers Fit
Decomposers sit outside the linear food chain. They are not a trophic level above the top predator. They are a parallel pathway that receives dead tissue from every level and returns inorganic nutrients to the producers.
Bacteria and fungi do most of the chemical work. Detritivores such as earthworms, millipedes and dung beetles fragment dead material and increase its surface area for microbial attack. In streams, coarse detritus remained the main food resource for primary consumers even after effluent addition increased biofilm biomass, meaning the brown detrital pathway and the green algal pathway ran side by side [4].
The practical point for students: a food chain diagram that omits decomposers is incomplete, but decomposers do not belong in the vertical sequence. They connect back to the base.
Common Mistakes and Limitations
Treating trophic level as a fixed species label. The most frequent error. A species is not "a primary consumer." It is a primary consumer in a specific chain. Omnivores routinely occupy two or more levels.
Assuming the ten percent rule is exact. Ten percent is an average. Measured transfer efficiencies range from under 1 percent to over 30 percent depending on the organism, temperature, food quality and chemical environment [7].
Confusing a food chain with a food web. A chain is one linear path. A web is the full network of feeding links in a community. Real ecosystems are webs, and most consumers feed at more than one level.
Placing decomposers at the top of the chain. They process material from all levels and cycle nutrients back to producers. They are not apex predators.
Forgetting that food chain length varies. Food chain length in estuaries decreased with chlorophyll-a and increased with latitude, contradicting the simple expectation that more productivity always means longer chains [5]. In streams, treated effluent stimulated the green pathway without changing total chain length [4].
Ignoring body size and phylogeny. Body size correlates with trophic level strongly in marine consumers, weakly in freshwater consumers and not at all in terrestrial consumers. Vertebrates generally occupy higher trophic positions than invertebrates [14].
Overlooking indirect effects. Caffeine consumed by a herbivore reduced parasitism success by about 16 percent and lowered the longevity of the next-generation parasitoid, a cross-level effect that a simple chain diagram does not show [8].
Individual cases in applied settings, such as assessing a specific contaminated site or a managed fishery, need specialist input. General principles do not replace site-specific data.
Quick Review
- A primary consumer is a herbivore at trophic level 2 that eats primary producers.
- A secondary consumer is a carnivore or omnivore at trophic level 3 that eats primary consumers.
- Trophic level is a functional position, not a species trait. The same animal can be primary or secondary depending on its diet.
- Roughly 10 percent of energy transfers between levels, which is why food chains are short.
- Decomposers process dead tissue from every level and sit outside the linear chain.
- Stable nitrogen isotopes estimate trophic position, with about 3 to 4 parts per thousand enrichment per step.
- Food chain length varies with productivity, latitude and ecosystem type, not just with the number of species present.
Frequently Asked Questions
What is a primary consumer in simple terms?
A primary consumer is an animal that eats plants or algae. It sits directly above the producers in a food chain and occupies trophic level 2.
What is a secondary consumer?
A secondary consumer is an animal that eats primary consumers. It is a carnivore or omnivore at trophic level 3, such as a frog eating a grasshopper or a tuna eating a smaller fish.
Can one animal be both a primary and a secondary consumer?
Yes. Trophic level depends on diet, not species. A bear eating berries is a primary consumer, and the same bear eating a salmon is a secondary consumer.
Why is only about 10 percent of energy passed to the next level?
Most energy is lost to respiration, heat, waste and unconsumed tissue at each step. Only the fraction stored as new consumer biomass is available to the next level.
Do decomposers belong in a food chain?
Decomposers sit outside the linear chain. They break down dead material from every trophic level and return nutrients to producers, forming a parallel recycling pathway.
How do scientists measure trophic level?
Stable nitrogen isotope analysis is the standard method. Nitrogen-15 becomes enriched by roughly 3 to 4 parts per thousand with each step up the food chain.
Related Articles
- Primary and Secondary Cell Culture: Definitions and Key Differences
- Protein Structure Levels: How Primary, Secondary, Tertiary, and Quaternary Structure Shape Function
- Antimicrobial Resistance in the Food Chain
- Primary Structure Of Protein
- Food Safety in Poultry Meat: Bacterial Pathogens, Thermal Inactivation, and Consumer Guidelines
- Best Cat Water Fountain Consumer Reports
- Tertiary Consumer: Definition and Food Web Role
- Secondary Succession: Definition, Stages, and Examples
- Greater Trochanter: Anatomy, Attachments, and Role
Sources
- Loss of riparian canopy cover reduces the transfer of polyunsaturated fatty acid (PUFA) and simplifies the trophic links in stream food webs.
- Feeding habits and multifunctional classification of soil-associated consumers from protists to vertebrates.
- Secondary production of the central rangeland region of the United States.
- Whole-stream wastewater addition stimulates the green food web pathway but does not affect food chain length.
- Latitudinal patterns of food source assimilation and food-chain length in estuarine food webs.
- Resource utilisation and trophic niche overlap of coralline intertidal benthic amphipods: an isotopic perspective.
- Trophic transfer and biological effects of azithromycin across a freshwater food chain.
- Cascading effects of caffeine intake by primary consumers to the upper trophic level.
- Trophic ecology and nutritional status of northern shrimp in Canada's sub-Arctic.
- Benthic primary producers are key to sustain the Wadden Sea food web: stable carbon isotope analysis at landscape scale.
- Population asynchrony within and between trophic levels have contrasting effects on consumer community stability in a subtropical lake.
- Chemolithoautotrophy supports macroinvertebrate food webs and affects diversity and stability in groundwater communities.
- High biodiversity in a benzene-degrading nitrate-reducing culture is sustained by a few primary consumers.
- Trophic Position of Consumers and Size Structure of Food Webs across Aquatic and Terrestrial Ecosystems.