Food Web: Definition, Diagram, and Examples
By Dr. Zubair Khalid, DVM, MS, PhD ·
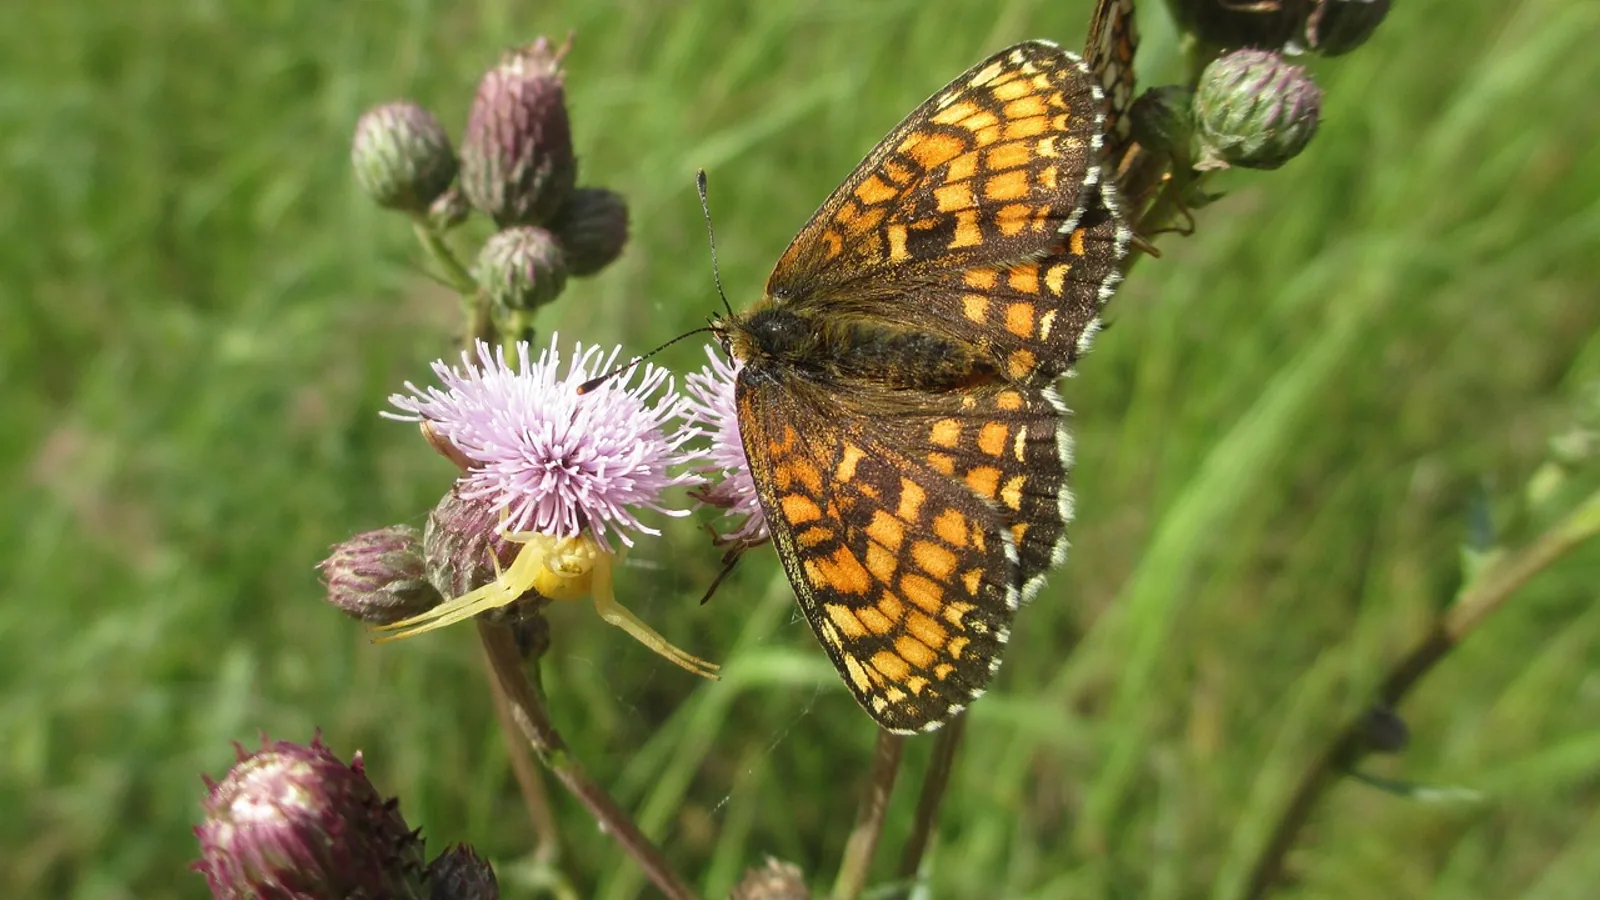
A food web is a network of interconnected food chains that shows how energy and matter move from producers through consumers and decomposers in an ecosystem. A dictionary food web entry usually adds one key idea: the arrows point in the direction energy flows, and any single organism can sit on several chains at once.
That network view matters because real ecosystems rarely run in straight lines. A fish eats both zooplankton and small crustaceans. A spider eats flies, moths, and other spiders. A soil fungus feeds on leaf litter and is itself eaten by a nematode that a mite eats. Once you draw those overlapping links, the linear chain becomes a web, and the web is what actually governs how energy, nutrients, and pollutants move through a community.
Food Web vs Food Chain vs Energy Pyramid
Students confuse these three constantly. They describe the same system at different resolutions.
| Term | What it shows | Shape | Key limitation |
|---|---|---|---|
| Food chain | One linear path of who eats whom | Line | Ignores most real feeding links |
| Food web | All feeding links among species in a community | Network | Hard to draw completely |
| Energy pyramid | Energy or biomass at each trophic level | Stacked bars | Hides the number of species involved |
| Trophic level | Position in the feeding hierarchy | Number (1, 2, 3...) | Omnivores occupy more than one |
A food chain is a single thread pulled out of the web. The food web is the whole fabric. The energy pyramid is what you get when you add up all the biomass or energy at each level and stack the totals.
The Three Functional Groups
Every food web is built from three roles. An organism's role is defined by how it gets carbon and energy, not by its species.
Producers
Producers (autotrophs) build organic molecules from inorganic carbon. Most use photosynthesis, capturing light to convert carbon dioxide and water into sugars. Terrestrial examples include grasses, trees, and shrubs. Aquatic examples include phytoplankton, macroalgae such as the seaweeds sampled in Korean tidal flats, and cyanobacteria. In stream ecosystems, photoautotrophic biofilms, the slimy layers of algae and microbes on rocks, sit at the base of the food web and supply essential polyunsaturated fatty acids to grazers [1].
Consumers
Consumers (heterotrophs) eat other organisms. They are split by what they eat:
- Primary consumers (herbivores) eat producers. Examples: zooplankton grazing phytoplankton, grasshoppers eating grass, the snail Potamopyrgus antipodarum grazing biofilms [1].
- Secondary consumers eat primary consumers. Examples: small fish eating zooplankton, spiders eating flies [2].
- Tertiary and higher consumers eat other carnivores. Examples: tuna larvae eating appendicularians and copepods [3], spotted seals feeding at the top of a coastal food web [4].
- Omnivores eat at more than one level. Many fish, birds, and humans are omnivores, which is why food webs are messy.
Decomposers
Decomposers break down dead organic matter and waste, releasing nutrients back to producers. This group includes bacteria, fungi, and detritivores such as earthworms, millipedes, and many soil arthropods. Decomposers are not a side branch. They form the "brown" energy channel, a microbivory-based pathway that runs parallel to the "green" herbivory channel. In a 30-site survey of Eurasian steppe grasslands, increasing aridity pushed energy away from the green channel and toward the brown channel, and that shift tracked declining soil organic carbon in temperate grasslands [5].
How Energy Moves: The 10% Rule
Energy transfer between trophic levels is inefficient. Organisms use most of the energy they consume for respiration, movement, and heat, and lose the rest in waste. Only a fraction, commonly about 10%, becomes new biomass at the next level. This is the 10% rule, also called the ten percent law.
The unit matters. Ecologists report energy flow in kilocalories (kcal) or kilojoules (kJ) per square meter per year (kcal/m²/yr or kJ/m²/yr). One kilocalorie equals about 4.184 kilojoules.
Worked Example
Imagine a pond where phytoplankton fix 20,000 kcal/m²/yr of gross primary production. Apply the 10% rule step by step.
- Producers: 20,000 kcal/m²/yr captured.
- Primary consumers (zooplankton): about 2,000 kcal/m²/yr stored as new biomass.
- Secondary consumers (small fish): about 200 kcal/m²/yr.
- Tertiary consumers (larger predatory fish): about 20 kcal/m²/yr.
The pattern explains why top predators are rare and why food chains rarely exceed four or five links. There simply is not enough energy left. It also explains why a single tuna needs an enormous volume of water to feed in, and why apex predators are the first to suffer when a system loses productivity.
Trophic Level Table with Example Organisms and Energy Values
| Trophic level | Role | Example organisms | Typical energy (kcal/m²/yr) | Typical energy (kJ/m²/yr) |
|---|---|---|---|---|
| 1 | Producers | Phytoplankton, grasses, trees, biofilms | 20,000 | 83,680 |
| 2 | Primary consumers | Zooplankton, grasshoppers, grazing snails | 2,000 | 8,368 |
| 3 | Secondary consumers | Small fish, spiders, insect-eating birds | 200 | 837 |
| 4 | Tertiary consumers | Larger predatory fish, seals, hawks | 20 | 84 |
| 5 | Quaternary consumers | Apex predators (rare) | 2 | 8 |
The values are illustrative and follow the 10% rule. Real ecosystems vary widely. Some aquatic systems transfer 15 to 20% because phytoplankton are consumed efficiently. Some terrestrial systems transfer less than 5% because much plant material is woody and indigestible.
Reading a Food Web Diagram
A labeled food web diagram follows four rules.
- Producers sit at the bottom or on the left.
- Arrows point from the organism being eaten to the organism that eats it, because arrows show the direction of energy flow.
- An organism can have multiple incoming and outgoing arrows.
- Decomposers are drawn at the base or as a separate loop, receiving arrows from every level.
The most common error is reversing the arrows. An arrow from a rabbit to a fox means energy flows from the rabbit into the fox. It does not mean the fox gives anything to the rabbit. Some textbooks draw arrows from predator to prey to show "who eats whom," which conflicts with the energy-flow convention. In this guide and in most modern ecology, arrows always follow energy.
flowchart TD
    A[Sunlight] --> B[Producers]
    B --> C[Primary Consumers]
    C --> D[Secondary Consumers]
    D --> E[Tertiary Consumers]
    B --> F[Decomposers]
    C --> F
    D --> F
    F --> G[Soil Nutrients]
    G --> B
The diagram shows the main energy path upward and the nutrient return path back to producers. Note that decomposers receive material from every consumer level, not just from dead producers.
Real Examples from Published Research
Food webs are not textbook abstractions. They are measured, modeled, and used to track pollutants.
Coral Reef Food Web
A study of Qingshui Bay, a tropical coral reef system off southern Hainan Island, China, measured 33 antibiotics across seawater, sediments, suspended particulate matter, and marine organisms. Twenty-five antibiotics appeared in seawater and 28 in marine organisms, with an average of 87.6 nanograms per gram dry weight in biota. Fish and cephalopods carried higher residues and higher bioaccumulation factors than crustaceans and mollusks. Six antibiotics showed trophic magnification, meaning their concentration increased at higher trophic levels [6]. This is a direct demonstration that food web position controls contaminant exposure.
Coastal Food Web and Phthalates
In Jinpu Bay, China, researchers built two food webs with different structures and tracked phthalate esters from plankton to air-breathing marine mammals. One web, spanning trophic levels roughly 1.5 to 3.5, showed trophic dilution. The other, spanning trophic levels roughly 3.0 to 4.0 and dominated by mid-to-high-level taxa, showed trophic magnification [4]. The lesson is that the same chemical can behave differently in two webs in the same region. Food web structure, not just chemistry, sets the outcome.
Freshwater Chain and Antibiotics
A simplified three-step freshwater chain (the alga Scenedesmus obliquus, the water flea Daphnia magna, and the midge predator Chaoborus obscuripes) showed a high bioconcentration factor of 1017 L/kg in the alga but negligible biomagnification from Daphnia to the predator, with a biomagnification factor below 0.032 [7]. The predator still showed a small but statistically significant reduction in final body length. Transfer and effect are not the same thing.
Warming Ocean and Tuna Larvae
Southern Bluefin Tuna larvae off northwest Australia were compared across 35 years. In 1987, larvae were limited by zooplankton prey. In 2022, despite warmer water, feeding and growth were higher because larvae shifted their preference from copepods to appendicularians. That shift created a more direct energy pathway from the microbial food web base to a top predator [3]. Food webs can realign, and those realignments can buffer against climate stress.
Soil and Grassland Webs
A study across 30 grassland ecosystems in the eastern Eurasian Steppe quantified energy fluxes in soil food webs. Increasing aridity reduced total energy flux through whole webs, driven by species loss and weakened trophic interactions, and shifted the balance from green to brown channels [5]. In alpine grasslands, soil organic carbon increased when the ratio of herbivory to microbivory energy flux stayed below about 1 [5].
Spider Webs in Subtropical Forest
DNA metabarcoding of gut contents from over 1,500 arboreal spiders in a subtropical forest in China built a high-resolution predator-prey network. Spiders made up a significant share of spider prey, and active hunters had broader, more generalized diets than web-builders [2]. This is what a real food web looks like at fine resolution: overlapping, generalist, and full of intraguild predation.
Keystone Species and Trophic Cascades
Food webs are dynamic. They shift with season, drought, pollution, and species loss. Two concepts capture the biggest shifts.
A keystone species has an effect on the community that is disproportionate to its abundance. The classic case is a predator whose removal lets herbivores expand, which then suppresses plant diversity. The concept traces to Robert Paine's work in the 1960s, and recent writing extends the idea to keystone molecules, chemical compounds that can govern diversity within trophic levels in the same disproportionate way [8].
A trophic cascade is the chain of effects that follows when a top consumer is added or removed. Remove a predator and herbivores increase, plants decline, and the whole web reorganizes. Cascades are not guaranteed. In a temperate grassland mesocosm, removing or adding wolf spiders changed soil fauna and microbial communities, but those changes did not cascade to detectable shifts in soil nitrogen or litter decomposition [9]. Cascade strength depends on context.
Parasites add another layer. Many parasites move between hosts when a predator eats an infected prey, so feeding links double as transmission routes. Food web structure itself selects for how broad a parasite's host range becomes [20, 15]. A food web diagram that ignores parasites is incomplete.
How Food Webs Are Studied
Ecologists use several methods, often in combination.
- Gut content analysis. Dissect stomachs or intestines and identify prey remains. Direct but biased toward hard parts and recent meals.
- DNA metabarcoding. Sequence DNA from gut contents or feces to identify prey species. This is how the spider network was built, with over 1,500 spiders screened [2].
- Stable isotope analysis. Ratio of nitrogen-15 to nitrogen-14 rises about 3 to 4 parts per thousand per trophic level, giving an integrated picture of what an organism has eaten over weeks to months.
- Trophic magnification factors. Regress contaminant concentration against trophic level to test whether a chemical biomagnifies or dilutes across a web [1, 2, 10].
- Mesocosms. Controlled tanks or enclosures that mimic a slice of ecosystem. Estuarine mesocosms with labeled nanoparticles showed that fibrous nanoplastics accumulated in surface sediments and reached benthic fish more than spherical particles did [10].
- Energy flux modeling. Combine abundance, body mass, and metabolic rates to estimate how much energy moves through each link [5].
Each method has blind spots. Metabarcoding cannot tell you how much was eaten. Stable isotopes average across prey. Mesocosms simplify. The strongest conclusions come from combining approaches.
Why Food Webs Matter for Contaminants and Health
Food web position predicts pollutant exposure. This is the practical payoff of the whole concept.
A contaminant that biomagnifies becomes more concentrated at each higher level. A contaminant that dilutes does the opposite. Which happens depends on the chemical's properties (especially how fat-soluble it is) and on the web's structure. In Jinpu Bay, the same class of phthalate esters diluted in one food web and magnified in another [4]. In a karst stream detrital chain, silver nanoparticles transferred from leaf litter to shrimp to fish, and trophic transfer reduced the overall biomagnification factor while increasing accumulation in specific organs, with silver levels in shrimp cephalothorax and fish intestine 14 to 94% higher in the three-step chain than in the two-step chain [11].
Microplastics follow feeding ecology, not just abundance. In Korean tidal flats, deposit feeders accumulated significantly more microplastics than filter feeders, and predator-prey biomagnification factors ranged from 3.9 to 9.6 based on particle counts [12]. In arid agroecosystems, microplastics can decouple soil food web structure from function, and energy flux is proposed as an underappreciated mediator linking biodiversity to ecosystem functioning [13].
The takeaway for anyone reading a risk assessment: check which food web was studied, how many trophic levels it covered, and whether the chemical magnified or diluted. A single number without that context is misleading.
Common Mistakes and Limitations
Reversing the arrows. Arrows show energy flow. They point from prey to predator, not the other way around.
Treating a food chain as a food web. A chain is one path. A web is the network. Most real organisms feed at several levels.
Assuming the 10% rule is exact. Ten percent is a useful average. Real transfer efficiency ranges from under 5% to over 20% depending on the ecosystem and the organisms.
Forgetting decomposers. They process dead matter from every level and return nutrients to producers. Leaving them out breaks the loop.
Drawing a static web. Food webs change with season, drought, warming, and species loss. The tuna larvae study showed a realignment across 35 years [3]. The grassland study showed a shift from green to brown channels as aridity increased [5].
Assuming every contaminant biomagnifies. Many do not. Trophic dilution is common, and the same chemical can magnify in one web and dilute in another [2, 10].
Ignoring parasites and microbes. Parasites use feeding links as transmission routes [14], and microbial loops can dominate energy flow in aquatic systems.
Confusing biomass with energy. A pyramid of biomass and a pyramid of energy look similar but are measured differently. Energy pyramids are always upright because energy is lost at each step. Biomass pyramids can be inverted in some aquatic systems where phytoplankton biomass is low but turnover is fast.
Individual ecosystems vary, and specific management or health questions about a particular site or species need a qualified ecologist or veterinarian.
Quick Review
- A food web is a network of interconnected food chains, not a single line.
- Producers make organic carbon, consumers eat other organisms, decomposers break down dead matter.
- Arrows show the direction of energy flow, from the organism eaten to the organism that eats it.
- About 10% of energy transfers between trophic levels, measured in kcal or kJ per m² per year.
- Food webs are dynamic. Keystone species and trophic cascades can reorganize them.
- Food web position predicts contaminant exposure, and the same chemical can magnify or dilute depending on web structure.
- Real webs are measured with gut contents, DNA metabarcoding, stable isotopes, mesocosms, and energy flux models.
Frequently Asked Questions
What is a food web in simple terms?
A food web is a map of all the feeding connections in an ecosystem. It shows which organisms eat which others and how energy flows from producers to consumers to decomposers.
What is the difference between a food chain and a food web?
A food chain is one linear path, such as grass to grasshopper to bird. A food web combines many overlapping chains into a network, which is a more realistic picture of how ecosystems work.
Why do arrows in a food web point the way they do?
Arrows show the direction energy flows. An arrow from a rabbit to a fox means the fox gains energy by eating the rabbit. Reversing the arrows is the most common diagram error.
What is the 10% rule in a food web?
The 10% rule states that roughly 10% of the energy at one trophic level becomes biomass at the next level. The rest is lost to respiration, heat, and waste. Real transfer efficiency varies by ecosystem.
What are the trophic levels in a food web?
Trophic levels are feeding positions. Level 1 is producers, level 2 is primary consumers, level 3 is secondary consumers, and level 4 and above are tertiary and quaternary consumers. Omnivores occupy more than one level.
Do all pollutants biomagnify in a food web?
No. Some biomagnify, meaning they become more concentrated at higher levels, and some dilute. The outcome depends on the chemical's properties and the structure of the specific food web being studied.
Related Articles
- biology dictionary
- Coral Reef Food Webs: A Veterinary Perspective on Marine Aquarium Nutrition
- medical dictionary online
- The Best Biology Dictionaries and Online Glossaries
- PubMed vs. Scopus vs. Web of Science
- What Is a Data Dictionary? A Practical Guide for Research Teams
- Tertiary Consumer: Definition and Food Web Role
- Pronation vs Supination: Definitions and Examples
- Dehydration Synthesis: Definition and Examples
Sources
- Xenobiotics modify vertical energy transfer from photoautotrophic biofilms to grazers.
- Metabarcoding reveals the dietary diversity and food web structure of spider functional guilds in a highly diverse subtropical forest.
- Pelagic food web realignment supports resilient larvae of Southern Bluefin Tuna in a warming ocean.
- Bioaccumulation and trophic transfer of phthalate esters in the food webs of Jinpu Bay, China: Health risks assessment for spotted seals.
- Aridity-induced energy reallocation from green to brown food webs predicts grassland carbon storage.
- Trophic magnification of antibiotics in a coral reef food web from the South China Sea: Bioaccumulation, source apportionment, and human health risks.
- Trophic transfer and biological effects of azithromycin across a freshwater food chain.
- Why does community ecology need chemistry? Because keystone molecules can govern food webs.
- Drought and Nitrogen Addition Modulate Wolf Spider-Associated Responses in a Detrital Food Web Without Detectable Functional Cascades.
- Interplay of Morphology and Polymer Composition Drives Estuarine Fate and Food Web Distribution of Nanoplastics: Evidence from a Multitrophic Mesocosm Using Upconversion Nanoparticle Tracers.
- Trophic transfer of silver nanoparticles in a detritus-based food chain within a karst stream: A comparative study of direct exposure versus trophic transfer.
- An Initial Assessment of Microplastic Distribution across Trophic Levels in Benthic Ecosystems of Tidal Flats.
- Microplastic pollution decouples soil food web structure-function cascades in plastic-mulched arid agroecosystems: Northwest China as a global testbed.
- Food web structure selects for parasite host range.