Z-Scores and Percentiles: How They Relate and How to Convert
By Dr. Zubair Khalid, DVM, MS, PhD ·
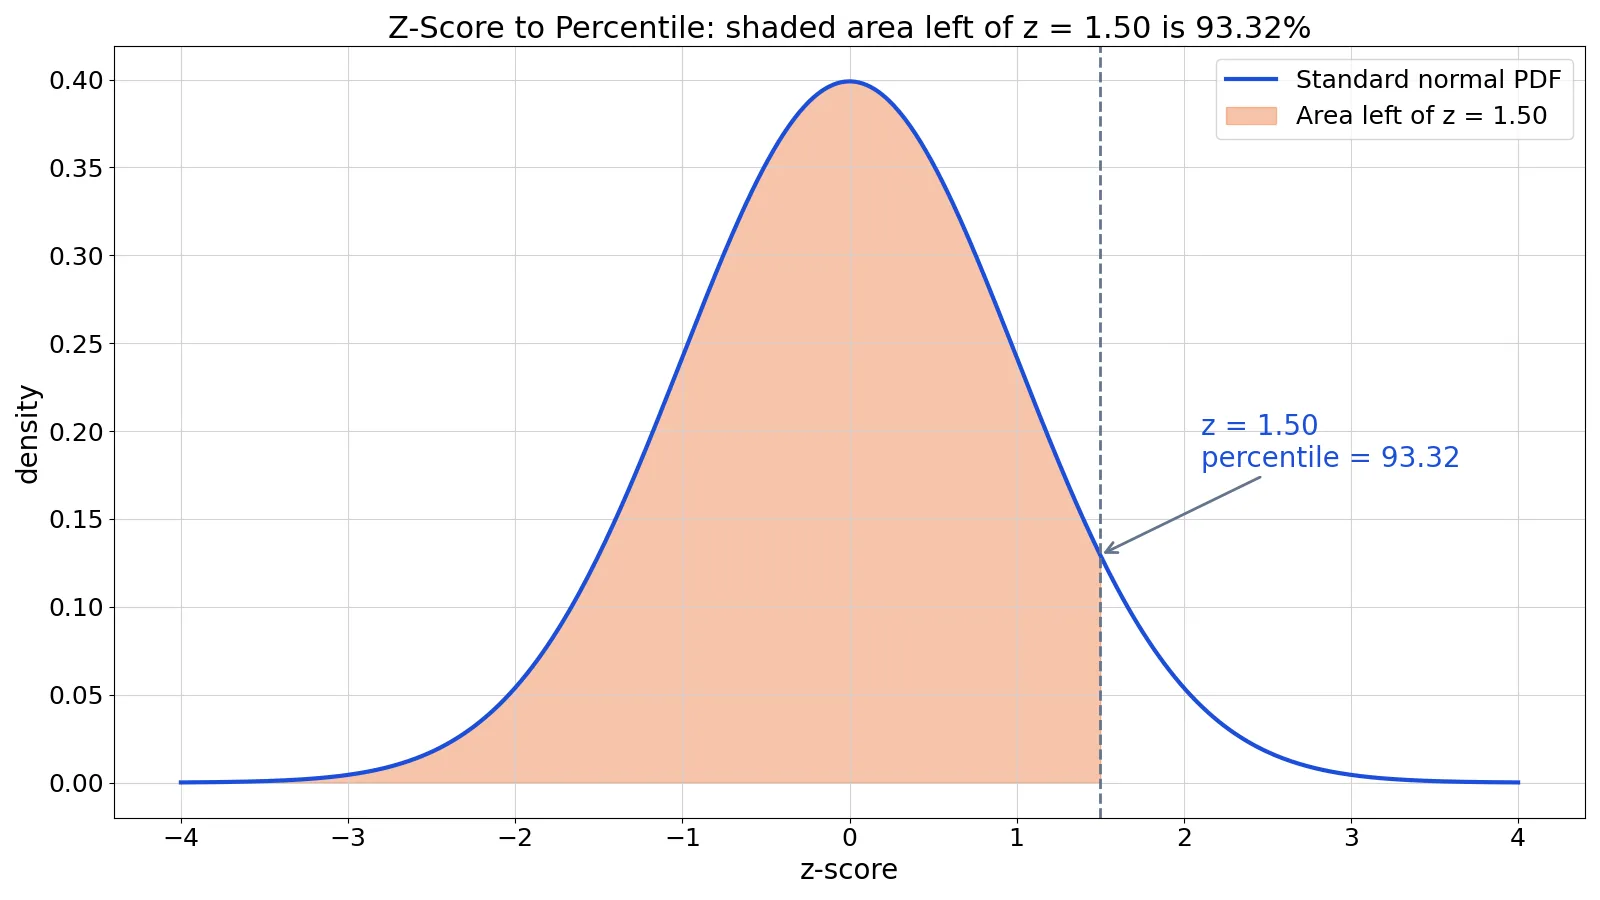
Z-scores and percentiles are two ways of saying where a value sits in a distribution. A z-score counts standard deviations from the mean, and a percentile reports the percentage of values at or below that point. If your data follow a normal distribution, you can convert one to the other with a single formula.
Quick Answer
- A z-score is a standardized distance from the mean: $z = (x - \mu) / \sigma$ [1].
- A percentile is the percentage of values at or below a given score [2].
- Under a normal distribution, the percentile equals the area under the curve to the left of $z$, written $\Phi(z)$.
- Convert a z-score to a percentile with $\text{percentile} = \Phi(z) \times 100$.
- Convert a percentile to a z-score with $z = \Phi^{-1}(\text{percentile} / 100)$.
What Z-Scores and Percentiles Mean
A z-score, also called a standard score, tells you how many standard deviations a value lies above or below the mean [1]. A z-score of 0 means the value equals the mean. A z-score of 2 means the value is two standard deviations above it. Because z-scores are unitless, they let you compare values from different scales, such as a height in centimeters and an exam score in points [3].
A percentile is a measure of position in an ordered data set. If you score at the 90th percentile, then 90% of the scores are the same as or below yours, and the remaining 10% are the same as or above it [2]. Percentiles divide ordered data into hundredths, while quartiles divide it into quarters. The first quartile is the 25th percentile, the median is the 50th percentile, and the third quartile is the 75th percentile [2].
The precise statistical definition of a percentile depends on the method used. Different software packages implement different rules, and the National Institute of Standards and Technology notes that nine methods have been evaluated in the statistical literature [4]. For a normal distribution, the percentile is defined as the cumulative probability to the left of a given z-score.
How It Works
The conversion rests on the standard normal distribution, which has a mean of 0 and a standard deviation of 1 [5]. Any normal variable can be converted to this standard scale with the z-score formula:
$$z = \frac{x - \mu}{\sigma}$$
Each symbol means the following:
- $x$ is the raw value you want to locate.
- $\mu$ (mu) is the population mean.
- $\sigma$ (sigma) is the population standard deviation.
- $z$ is the number of standard deviations between $x$ and the mean.
Once you have $z$, the percentile is the area under the standard normal curve to the left of that value:
$$\text{percentile} = \Phi(z) \times 100$$
Here $\Phi$ (the capital Greek letter phi) is the cumulative distribution function of the standard normal distribution. It returns a proportion between 0 and 1, so multiplying by 100 gives a percentage. To go the other way, invert the function:
$$z = \Phi^{-1}\!\left(\frac{\text{percentile}}{100}\right)$$
The inverse function $\Phi^{-1}$ takes a proportion and returns the z-score that cuts off that much area on the left.
The empirical rule gives you a few anchor points to check your work. About 68% of values lie between $z = -1$ and $z = 1$, about 95% lie between $z = -2$ and $z = 2$, and about 99.7% lie between $z = -3$ and $z = 3$ [5]. So a z-score of 1 sits near the 84th percentile, and a z-score of 2 sits near the 97.7th percentile.
Worked Example
Suppose you have 40 exam scores. The sample mean is 72.0000 and the sample standard deviation, computed with $n - 1$ in the denominator, is 6.5044. Here are the scores:
| 60 | 64 | 66 | 68 | 70 | 72 | 74 | 76 | 78 | 80 |
|---|---|---|---|---|---|---|---|---|---|
| 62 | 65 | 67 | 69 | 71 | 73 | 75 | 77 | 79 | 81 |
| 63 | 66 | 68 | 70 | 72 | 74 | 76 | 78 | 80 | 82 |
| 61 | 64 | 67 | 69 | 71 | 73 | 75 | 77 | 79 | 88 |
The steps below convert three raw scores to z-scores and then to percentiles.
| Step | Value |
|---|---|
| Sample size | n = 40 |
| Sample mean | 72.0000 |
| Sample standard deviation (ddof = 1) | 6.5044 |
| z-score for raw score 60 | (60 - 72.0000) / 6.5044 = -1.8449 |
| Percentile for z = -1.8449 | 3.2526 |
| z-score for raw score 72 | (72 - 72.0000) / 6.5044 = 0.0000 |
| Percentile for z = 0.0000 | 50.0000 |
| z-score for raw score 88 | (88 - 72.0000) / 6.5044 = 2.4599 |
| Percentile for z = 2.4599 | 99.3050 |
A score of 60 is 1.8449 standard deviations below the mean, which places it at the 3.25th percentile. A score of 72 equals the mean, so it lands at the 50th percentile. A score of 88 is 2.4599 standard deviations above the mean, putting it at the 99.31th percentile.
Now suppose you want the percentile for a z-score of 1.5000. The area to the left of that value is 0.933193, so the percentile is 93.3193.
Here is the code that produces the percentile for the raw score 88:
from scipy.stats import norm
z = (88 - 72) / 6.5044
percentile = norm.cdf(z) * 100
print(f"{percentile:.4f}")
Output:
99.3050The norm.cdf function returns the cumulative probability up to a given z-score, which is exactly the area you need for a percentile. If you want to try your own numbers, the Z-Score Calculator handles the arithmetic for you.
How to Interpret It
Read a z-score as a distance and a percentile as a rank. A negative z-score means the value is below the mean, and a positive z-score means it is above. The percentile always runs from 0 to 100 and tells you the share of the distribution below that point.
Two cautions matter here. First, a percentile is not a percentage score. Scoring at the 80th percentile on a 100-point test does not mean you scored 80 points. It means you did as well as or better than 80% of the test takers [3]. Second, the conversion assumes normality. If your data are skewed or have heavy tails, the z-score to percentile mapping will be off, sometimes badly.
When you compare values from different distributions, z-scores are the fairer comparison because they account for both the center and the spread [3]. A raw score of 85 means different things on a test with a mean of 60 and a test with a mean of 80.
When to Use It (and when not to)
Use the z-score to percentile conversion when your variable is approximately normally distributed and you want to communicate a position in familiar terms. This comes up often with standardized test scores, growth charts, and quality control measurements. It also works well when you need to compare measurements on different scales, since z-scores strip away the original units [1].
Avoid the conversion when the distribution is clearly not normal. Income, house prices, and many count variables are right-skewed, so the normal curve will understate or overstate percentiles at the tails. Avoid it too when you have a small sample and cannot check the shape of the distribution. In those cases, compute the percentile rank directly from the ordered data instead, using a method such as the one in SciPy's percentileofscore function [6].
If you are working with ordered data rather than a theoretical curve, see Percentiles: What They Are and How to Calculate Them for the empirical approach.
Z-Score vs Percentile Rank
These two measures answer different questions. The z-score is a standardized distance from the mean. The percentile rank is a position within an ordered set of values.
| Feature | Z-Score | Percentile Rank |
|---|---|---|
| What it measures | Distance from the mean in standard deviations | Share of values at or below a point |
| Units | None | Percentage (0 to 100) |
| Requires normality for conversion | Yes | No |
| Typical range | Roughly -3 to 3 for most data | 0 to 100 |
| Sensitive to outliers | Yes, through the mean and SD | Less so, since it uses ranks |
| Common use | Comparing across different scales | Reporting standings and growth |
A z-score of 0 always maps to the 50th percentile under normality, but the two are not interchangeable in general. The percentile rank can be computed for any data set, normal or not, while the z-score to percentile conversion depends on the shape of the distribution [6].
Common Mistakes
- Treating a percentile as a percentage score. A 90th percentile score is not 90%. The fix is to state the rank explicitly: "scored at or above 90% of test takers."
- Using the population standard deviation when you have a sample. The z-score formula uses $\sigma$, but sample data call for $s$ with $n - 1$ in the denominator. Mixing them shifts every z-score.
- Assuming normality without checking. Plot a histogram or a normal quantile plot first. If the shape is skewed, use empirical percentiles instead.
- Confusing "less than" with "less than or equal to." Percentile definitions differ on ties. SciPy's
percentileofscoreoffersrank,weak,strict, andmeanoptions for exactly this reason [6]. - Reading the z-table backward. The standard normal table gives area to the left of z. If you need the area to the right, subtract from 1. The Z-Table guide walks through both directions.
- Rounding z-scores too early. Keep at least four decimal places before looking up the percentile, or your answer can drift by a full percentage point.
Limitations
The conversion assumes a normal distribution, and real data often depart from it. Skewness and heavy tails distort the tails most, which is exactly where percentiles matter for decisions about outliers and cutoffs. A z-score of 3 corresponds to the 99.87th percentile under normality, but in a skewed distribution the same z-score may sit far lower in the actual ranking.
Percentile definitions also vary across software. NIST documents multiple methods for computing percentiles from ordered data, and the choice of method changes the answer for small samples [4]. When you report a percentile, say which method you used. For large samples the differences are usually small, but for samples under about 20 values they can be visible [4].
Finally, z-scores depend on the mean and standard deviation, both of which are sensitive to extreme values. A single outlier can inflate the standard deviation and compress every other z-score toward zero. If outliers are a concern, look at How to Find Outliers: IQR Method and Z-Scores Explained before you trust the conversion.
Frequently Asked Questions
What percentile is a z-score of 1.5?
A z-score of 1.5 corresponds to the 93.32th percentile under the standard normal distribution. That means about 93.32% of values fall at or below that point. You can verify this with norm.cdf(1.5) * 100 in Python, which returns 93.3193.
How do I convert a percentile to a z-score?
Divide the percentile by 100 to get a proportion, then apply the inverse normal function. In Python, norm.ppf(0.90) returns about 1.2816, so the 90th percentile sits at a z-score of roughly 1.28. In Excel, NORM.S.INV(0.90) gives the same result.
Is a z-score the same as a percentile?
No. A z-score is a distance from the mean measured in standard deviations. A percentile is the share of values at or below a point. They are linked only when the data follow a normal distribution, and even then they are different quantities.
What does a negative z-score mean for a percentile?
A negative z-score means the value is below the mean, so its percentile is below 50. For example, a z-score of -1.8449 corresponds to the 3.25th percentile. The more negative the z-score, the lower the percentile.
Can I use z-scores to find percentiles for any data set?
Only if the data are approximately normal. For skewed or non-normal data, compute the percentile rank directly from the sorted values. SciPy's percentileofscore function does this without assuming any distribution [6]. For a full walkthrough of the empirical method, see How Do You Calculate Percentile? Formula and Example.
References
- z-score, SciPy v1.18.0 Manual
- 13.3 Measures of Position - Principles of Finance 2e | OpenStax
- 3.4: Measures of Position - Statistics LibreTexts
- 7.2.6.2. Percentiles
- 6.1 The Standard Normal Distribution - Introductory Statistics 2e | OpenStax
- percentileofscore, SciPy v1.18.0 Manual
Further Reading
Related Articles
- Percentiles: What They Are and How to Calculate Them
- How to Find Outliers: IQR Method and Z-Scores Explained
- How Do You Calculate Percentile? Formula and Example
- Bivariate Data: Definition, Examples and Analysis
- ANOVA Table Explained: Components, Formulas and Example
- Understanding the Z-Table: How to Use It for Probability and Percentiles
- How to Interpret DALI Z-Scores: What They Really Tell You About Structural Similarity
- Statistical Z-Table: How to Use It and Find Probabilities