How to Find Outliers: IQR Method and Z-Scores Explained
By Dr. Zubair Khalid, DVM, MS, PhD ·
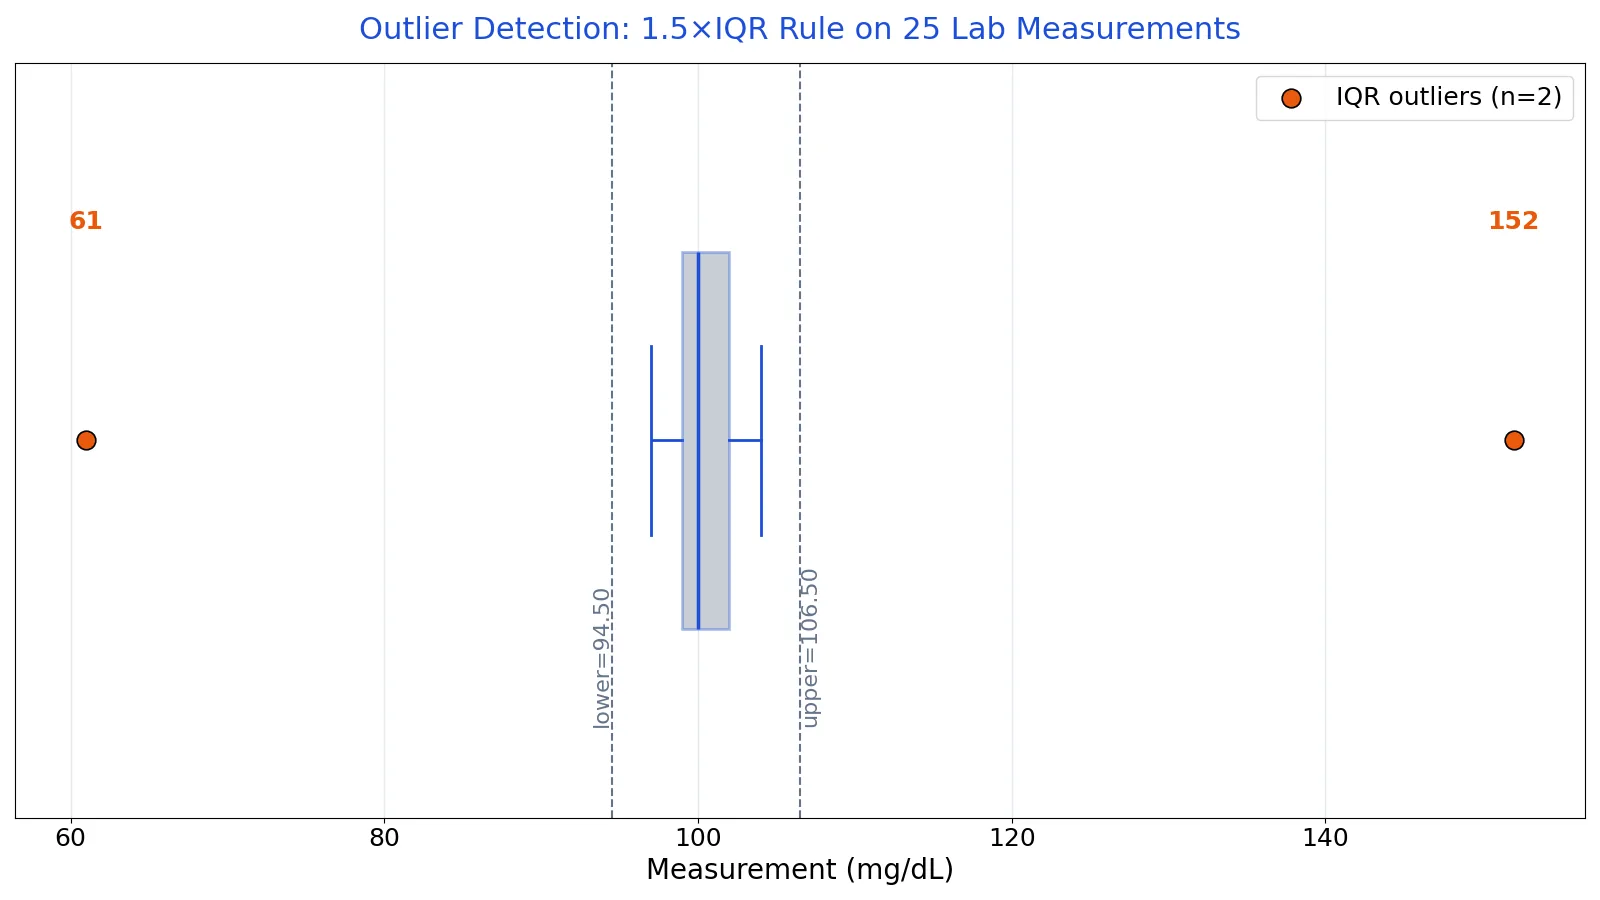
To find outliers, you compare each value against a boundary built from the rest of the data. The IQR method flags anything below $Q_1 - 1.5 \times IQR$ or above $Q_3 + 1.5 \times IQR$, while the z-score method flags anything with $|z| > 2$ or $|z| > 3$. Both are quick, both are widely used, and they answer slightly different questions.
Quick Answer
- IQR method: sort the data, find $Q_1$ and $Q_3$, compute $IQR = Q_3 - Q_1$, then flag values outside $[Q_1 - 1.5 \times IQR,\ Q_3 + 1.5 \times IQR]$ [1].
- Z-score method: compute $\bar{x}$ and $s$, then flag values where $|z| = |x - \bar{x}| / s$ exceeds your cutoff, commonly 2 or 3 [2].
- The IQR rule makes no assumption about the distribution shape. The z-score rule assumes roughly normal data [3].
- Both methods are labeling tools, not verdicts. A flagged point still needs investigation before you delete it [4].
- On the 25-value example below, both methods flag the same two values: 152 and 61.
Before You Start
You need one numeric variable and a decision about what counts as "far." Outliers are observations that lie an abnormal distance from the other values in a sample, and the definition leaves it to you to decide what abnormal means [4]. That decision is the whole game.
Two things to check first.
Look at the shape. A histogram or box plot tells you whether the data are symmetric or skewed. The IQR rule works on skewed data, but its fences can extend too far on the compressed side of a skewed distribution and declare false outliers on the stretched side [1]. The z-score rule is worse on skewed data because the mean and standard deviation are themselves pulled by extreme values [2].
Decide whether you are labeling or testing. Labeling means flagging candidates for a closer look. Testing means formally deciding whether a point comes from a different distribution, which calls for a procedure like Grubbs' test [3]. The methods here are labeling methods.
If you want a quick check without writing code, the Outlier Calculator applies the same fences and z-score thresholds described below.
Step by Step
Method 1: The IQR Rule
- Sort the values from smallest to largest.
- Find $Q_1$, the 25th percentile, and $Q_3$, the 75th percentile. Use a consistent percentile convention, since different software interpolates slightly differently.
- Compute the interquartile range.
$$IQR = Q_3 - Q_1$$
- Build the fences.
$$\text{Lower fence} = Q_1 - 1.5 \times IQR$$ $$\text{Upper fence} = Q_3 + 1.5 \times IQR$$
- Flag every value outside the fences. Tukey proposed exactly this interval, $[Q_1 - 1.5\,IQR,\ Q_3 + 1.5\,IQR]$, as the outlier boundary [1].
The 1.5 multiplier is a convention, not a law. Some fields use 3.0 for "extreme" outliers, which is why box plots often show two tiers of points.
Method 2: Z-Scores
- Compute the sample mean $\bar{x}$.
- Compute the sample standard deviation $s$, using $n - 1$ in the denominator.
- Convert each value to a z-score.
$$z = \frac{x - \bar{x}}{s}$$
- Flag values where $|z|$ exceeds your cutoff. A cutoff of 2 or 3 is typical.
One practical caution: the mean and standard deviation are themselves affected by outliers, so a single extreme value inflates $s$ and shrinks every other z-score. A common workaround is to remove the suspected outlier, recompute the mean and standard deviation, and then calculate the z-score of the suspected point against those cleaner statistics [2].
Worked Example
The dataset is a quality-control run of 25 lab measurements in mg/dL.
| Index | Value | Index | Value | Index | Value |
|---|---|---|---|---|---|
| 1 | 98 | 10 | 100 | 19 | 98 |
| 2 | 101 | 11 | 101 | 20 | 102 |
| 3 | 99 | 12 | 98 | 21 | 101 |
| 4 | 103 | 13 | 102 | 22 | 99 |
| 5 | 100 | 14 | 100 | 23 | 100 |
| 6 | 97 | 15 | 99 | 24 | 152 |
| 7 | 102 | 16 | 103 | 25 | 61 |
| 8 | 104 | 17 | 101 | ||
| 9 | 99 | 18 | 100 |
Sorted values:
61, 97, 98, 98, 98, 99, 99, 99, 99, 100, 100, 100, 100, 100, 101, 101, 101, 101, 102, 102, 102, 103, 103, 104, 152
Quartiles and fences:
- $Q_1 = 99.0000$
- $Q_3 = 102.0000$
- $IQR = 102.0000 - 99.0000 = 3.0000$
- Lower fence $= 99.0000 - 1.5 \times 3.0000 = 94.5000$
- Upper fence $= 102.0000 + 1.5 \times 3.0000 = 106.5000$
Only two values fall outside $[94.5000, 106.5000]$: 152 and 61. Everything else sits between 97 and 104, so the fences are tight and the two extremes stand well clear.
Z-scores:
- $\bar{x} = 100.8000$
- $s = 13.3604$
- For 152: $(152 - 100.8000) / 13.3604 = 3.8322$
Using a cutoff of $|z| > 2$, the flagged values are again 152 and 61. The z-score of 61 is $-2.9797$.
Notice how much the two extremes inflate $s$. Without them, the standard deviation of the remaining 23 values is far smaller, and the z-scores of ordinary points would be larger. That is the masking effect in miniature.
Python:
import pandas as pd
s = pd.Series([98,101,99,103,100,97,102,104,99,100,
               101,98,102,100,99,103,101,100,98,102,
               101,99,100,152,61])
q1, q3 = s.quantile(0.25), s.quantile(0.75)
iqr = q3 - q1
lower, upper = q1 - 1.5*iqr, q3 + 1.5*iqr
outliers = s[(s < lower) | (s > upper)].tolist()  # [152, 61]
z = (s - s.mean()) / s.std(ddof=1)
z_outliers = s[z.abs() > 2].tolist()  # [152, 61]
print(f"IQR outliers: {outliers}; z-score outliers (|z|>2): {z_outliers}; fences = [{lower:.4f}, {upper:.4f}]")
Output:
IQR outliers: [152, 61]; z-score outliers (|z|>2): [152, 61]; fences = [94.5000, 106.5000]Excel check: QUARTILE.INC returns $Q_1 = 99.0000$ and $Q_3 = 102.0000$, giving the same fences of 94.5000 and 106.5000. STDEV.S returns 13.3604, matching the Python result.
Other Ways to Do It
Box plots. A box plot draws the fences implicitly. Points beyond the whiskers are the flagged values, which makes it the fastest visual check. See Box Plot Outliers: How to Identify and Interpret Them for how to read the whiskers and the two outlier tiers.
Modified z-score. When the data are skewed, the median and MAD replace the mean and standard deviation, which removes the masking problem. The comparison in How to Detect Outliers: Grubbs Test, IQR Fences and Modified Z-Score walks through when each is appropriate.
Grubbs' test. A formal hypothesis test for exactly one outlier in normally distributed data. The test statistic is the largest absolute deviation from the sample mean in units of the sample standard deviation [5]. It is more rigorous than a threshold rule but assumes normality and handles only one outlier at a time [3].
Adjusted box plots. For skewed data, the medcouple adjustment shifts the fences asymmetrically. It performs better than plain Tukey fences on skewed distributions, though it can occasionally place a fence beyond the data extremes [1].
Percentile-based checks. If you already work in z-score terms, Z-Scores and Percentiles: How They Relate and How to Convert shows how a z-score maps to a tail probability, which turns a cutoff into a stated error rate.
Troubleshooting
The fences look too wide. Your IQR is large because the middle half of the data is spread out. Check whether the data are skewed. On skewed data, Tukey fences extend too far on the compressed side and flag false outliers on the stretched side [1].
Nothing is flagged but the plot looks wrong. With small samples, the quartiles are unstable, and a wide IQR can push the fences past a value that still looks extreme on the plot. A cutoff of 1.5 is a convention, not a guarantee.
The z-score flags too many points. About 5 percent of ordinary values from a normal distribution exceed $|z| = 2$ by chance, so in a large sample a cutoff of 2 flags many genuine points. Use a cutoff of 3 for large samples.
Two outliers hide each other. Masking occurs when you test for one outlier but two or more are present, because the extra outliers inflate the test statistic's denominator [3]. Swamping is the opposite problem, where testing for too many outliers causes both a true outlier and a normal point to be declared [3].
The flagged point is a data entry error. Check the raw record before anything else. A misplaced decimal or a transposed digit is a common cause.
Common Mistakes
- Deleting flagged values immediately. An outlier may hold valuable information about the process or the data collection step, so investigate the cause before removing anything [4]. Fix the error if there is one, and keep the point if the value is genuine [6].
- Applying z-scores to skewed data. The mean and standard deviation are distorted by the very values you are trying to detect [2]. Use the IQR rule or a modified z-score instead.
- Mixing percentile conventions. Different tools interpolate quartiles differently, so $Q_1$ and $Q_3$ can differ by a fraction and shift the fences. Pick one convention and state it.
- Treating the 1.5 multiplier as fixed. It is a convention. If your field uses 3.0 for extreme outliers, say so.
- Running a single-outlier test repeatedly. Applying a test for one outlier sequentially is not appropriate for detecting several [3].
- Forgetting that the cutoff is a choice. A cutoff of 2 flags roughly 5 percent of a normal sample by chance alone. Report the cutoff you used.
Limitations
Neither method tells you whether a flagged value is wrong. They only tell you it is unusual relative to the rest of the sample. A value can be a legitimate measurement from a heavy-tailed process and still sit beyond the fence, and a value can be a recording error and still sit comfortably inside it.
The z-score approach is the more fragile of the two. It assumes an approximately normal distribution, and it depends on statistics that outliers themselves distort [3][2]. The IQR approach is more resistant but still misleads on strongly skewed data, where the fences are asymmetric in the wrong direction [1]. For formal decisions, use a test designed for the purpose, and remember that most such tests assume a single outlier and normal data [5].
Frequently Asked Questions
How do I find outliers in a small dataset?
Sort the values, find the median of the lower half and the median of the upper half to get $Q_1$ and $Q_3$, then apply the 1.5×IQR fences. With fewer than about 20 points, the fences can be unstable, so pair the calculation with a box plot or dot plot. Visual inspection matters more as the sample shrinks.
What z-score threshold should I use to find an outlier?
A cutoff of $|z| > 2$ is common for flagging candidates, and $|z| > 3$ is common for stronger evidence. The choice is a tradeoff between catching real anomalies and flagging ordinary variation. In a normal distribution, about 5 percent of values fall beyond $|z| = 2$ and about 0.3 percent beyond $|z| = 3$.
Why do the IQR method and z-scores disagree?
They measure distance differently. The IQR rule uses the middle half of the data as its yardstick, so it is unaffected by extreme values. The z-score uses the mean and standard deviation, both of which the outliers themselves inflate. On skewed or contaminated data, the two methods can flag different sets of points.
Can I remove an outlier just because it is flagged?
No. Investigate first. If the value is a data entry error, correct or remove it. If the value is genuine, it may carry important information about the process, and removing it changes your mean, standard deviation, and any model you fit [4][6]. Document the decision either way.
How do I calculate outliers in Excel?
Use QUARTILE.INC for $Q_1$ and $Q_3$, subtract to get the IQR, then build the fences with $Q_1 - 1.5 \times IQR$ and $Q_3 + 1.5 \times IQR$. For z-scores, use AVERAGE and STDEV.S. On the example above, QUARTILE.INC returns 99.0000 and 102.0000, and STDEV.S returns 13.3604.
References
- Empirical Evaluation of the Relative Range for Detecting Outliers - PMC
- 3.5: Working with Outliers - Statistics LibreTexts/03%3A_Descriptive_Statistics/3.05%3A_Working_with_Outliers)
- 1.3.5.17. Detection of Outliers
- 7.1.6. What are outliers in the data?
- 1.3.5.17.1. Grubbs' Test for Outliers
- 12.7: Outliers - Statistics LibreTexts/12%3A_Linear_Regression_and_Correlation/12.07%3A_Outliers)
Related Articles
- Box Plot Outliers: How to Identify and Interpret Them
- Z-Scores and Percentiles: How They Relate and How to Convert
- ANOVA Table Explained: Components, Formulas and Example
- How to Detect Outliers: Grubbs Test, IQR Fences and Modified Z-Score
- Range and Interquartile Range: How to Find IQR
- Statistical Analysis Methods