What Is Data Mining? Definition, Meaning and Examples
By Dr. Zubair Khalid, DVM, MS, PhD ·
Data mining is the process of extracting useful, often previously unknown patterns from large data sets using automated methods [1]. It sits between raw data storage and decision making, turning tables of records into statements you can act on. This article gives you the data mining definition in plain and precise terms, shows how it differs from statistics and machine learning, and walks through a small worked example you can reproduce.
Quick Answer
- Data mining is the automated extraction of useful patterns from large databases or data sets [1].
- It combines statistics, machine learning, and database techniques to find actionable insights in structured and unstructured data [2].
- A typical project moves through problem definition, exploratory analysis, dimension reduction, modeling, evaluation, and deployment [3].
- Common methods include classification and regression trees, neural networks, association rules, and clustering [3].
- It is not the same as statistics or machine learning. Data mining is the whole applied process, and those fields supply many of its tools.
What Data Mining Means
In everyday use, data mining means finding meaning in large volumes of data. Companies collect records automatically, then study them for patterns and discrepancies that solve a problem [4]. A grocery chain that logs every loyalty-card purchase is doing the collection. Looking for products that sell together is the mining.
The precise definition is narrower. Data mining is the automatic extraction of useful, often previously unknown information from large databases or data sets [1]. Two words carry the weight. "Automatic" means the search is done by algorithms, not by an analyst reading rows one at a time. "Previously unknown" means the output is a pattern you did not already know to look for.
That second word is what separates mining from ordinary reporting. A monthly sales report tells you what happened. A mining step tells you something you had not asked about, such as which product pairs appear together far more often than chance would suggest.
The process around the algorithm matters as much as the algorithm. A data mining course typically covers problem definition, exploratory data analysis, dimension reduction, alternative models, calibration, evaluation, and deployment [3]. The model is one step in a longer chain that starts with a question and ends with something in production.
How It Works
Data mining is a family of methods, so there is no single formula. The most common entry point is association rule mining, which measures how often items appear together. For a pair of items $A$ and $B$, support is the share of transactions containing both:
$$\text{support}(A, B) = \frac{\text{count of transactions containing } A \text{ and } B}{n}$$
Here $n$ is the total number of transactions, and the count is the number of baskets holding both items. Support answers a simple question: how common is this combination? A high support value means the pair shows up often enough to matter operationally.
A second common task is splitting a numeric outcome into groups. One simple split uses the median as a threshold:
$$\text{median} = \text{middle value of the sorted outcome column}$$
Records above the threshold form the high group, records at or below it form the low group. Comparing the group means shows whether the split separates anything useful. This is the logic behind classification and regression trees, which choose splits that make the resulting groups as different as possible [3].
Both examples share the same shape. You define a pattern, count how often it occurs, and compare that count against what you would expect by chance or against a baseline. The algorithm's job is to search many candidate patterns and rank them.
Worked Example
The data set is 30 retail transactions with product line items, stored as two columns: txn_id and product. Each row is one product in one basket, so a basket with three items produces three rows.
| txn_id | products |
|---|---|
| 1 | Bread, Milk, Eggs |
| 2 | Bread, Butter |
| 3 | Milk, Eggs, Cheese |
| 4 | Bread, Milk, Butter |
| 5 | Bread, Milk, Eggs, Cheese |
| 6 | Milk, Cheese |
| 7 | Bread, Butter |
| 8 | Bread, Milk, Eggs |
| 9 | Milk, Eggs |
| 10 | Bread, Milk, Cheese |
| 11 | Bread, Eggs |
| 12 | Milk, Butter, Cheese |
| 13 | Bread, Milk |
| 14 | Bread, Milk, Eggs, Butter |
| 15 | Milk, Cheese |
| 16 | Bread, Cheese |
| 17 | Bread, Milk, Eggs |
| 18 | Milk, Butter |
| 19 | Bread, Milk, Cheese |
| 20 | Bread, Eggs, Butter |
| 21 | Milk, Eggs, Cheese |
| 22 | Bread, Milk |
| 23 | Bread, Milk, Eggs |
| 24 | Milk, Cheese |
| 25 | Bread, Butter |
| 26 | Bread, Milk, Eggs, Cheese |
| 27 | Milk, Eggs |
| 28 | Bread, Milk, Butter |
| 29 | Bread, Cheese |
| 30 | Milk, Eggs, Cheese |
The steps are:
- Count the transactions. There are $n = 30$.
- List the distinct products. There are five: Bread, Butter, Cheese, Eggs, and Milk.
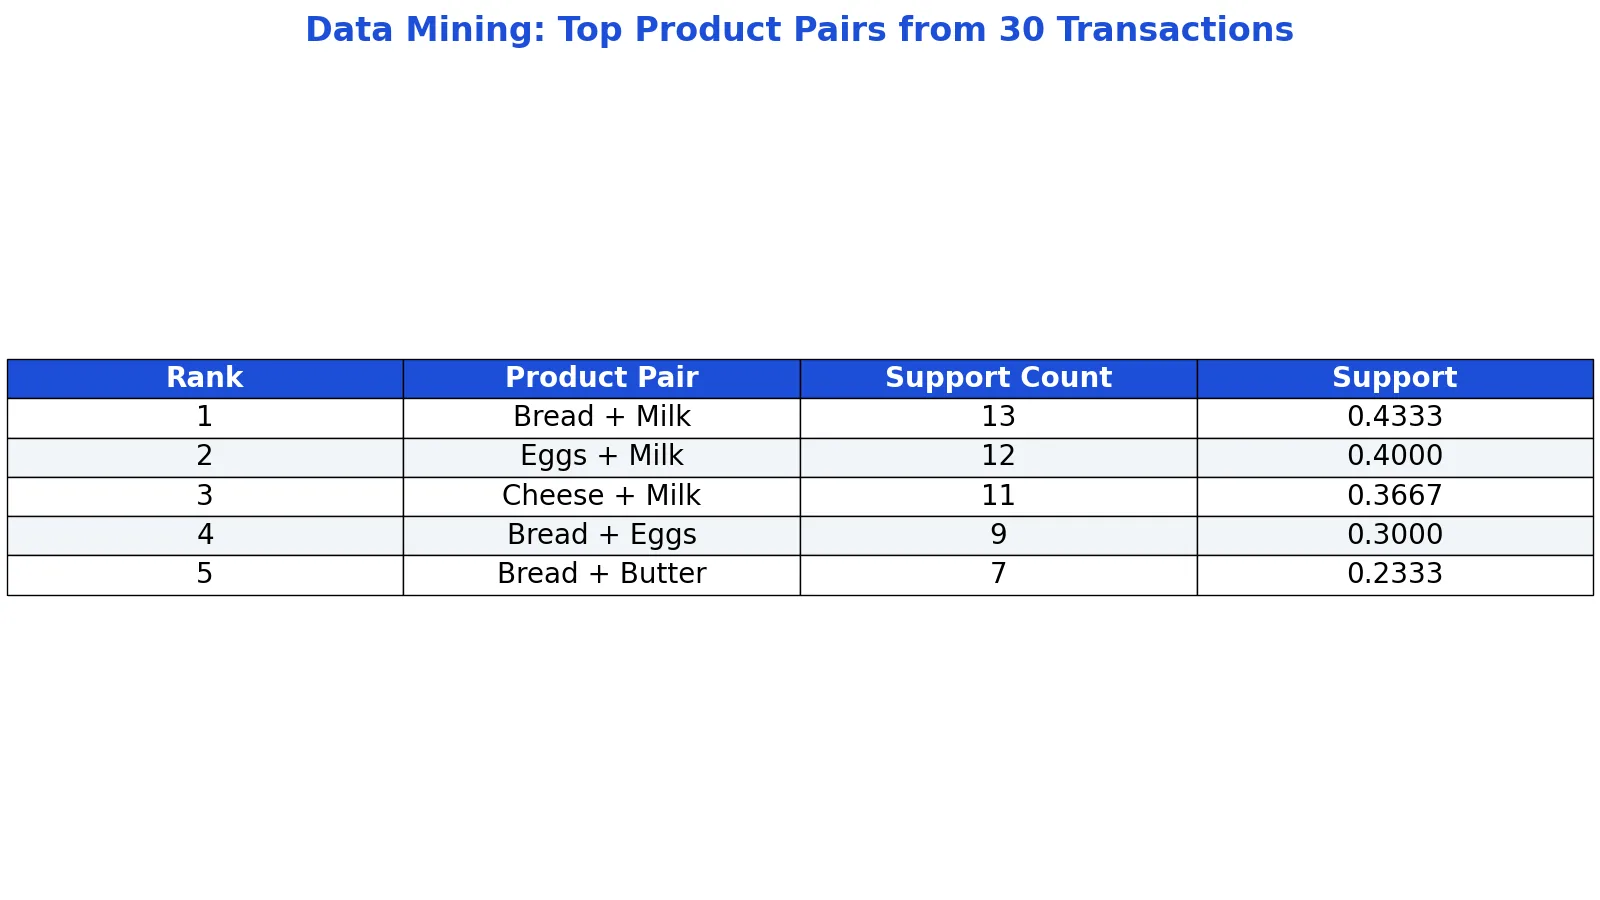
- Count every pair of products that appears in the same basket. The top pair is Bread and Milk, appearing in 13 baskets.
- Convert the count to support. Support is $13 / 30 = 0.4333$, so about 43 percent of baskets contain both.
- Split on spend. The median spend is 12.9000. Baskets above it average 17.5133, and baskets at or below it average 10.0933.
The code below reproduces the pair counts.
import pandas as pd, itertools
df = pd.read_csv('transactions.csv')
baskets = df.groupby('txn_id')['product'].apply(list)
pairs = {}
for items in baskets:
    for a, b in itertools.combinations(sorted(set(items)), 2):
        pairs[(a, b)] = pairs.get((a, b), 0) + 1
top = sorted(pairs.items(), key=lambda kv: -kv[1])[:5]  # top pair: Bread + Milk count=13 support=0.4333
Output:
Top pair: Bread + Milk (count=13, support=0.4333); split threshold=12.9000, mean_high=17.5133, mean_low=10.0933The top five pairs are:
| Pair | Count | Support |
|---|---|---|
| Bread + Milk | 13 | 0.4333 |
| Eggs + Milk | 12 | 0.4000 |
| Cheese + Milk | 11 | 0.3667 |
| Bread + Eggs | 9 | 0.3000 |
| Bread + Butter | 7 | 0.2333 |
Milk appears in three of the five top pairs, including the top three, which is the kind of pattern a mining run surfaces without anyone asking for it.
How to Interpret It
Read support as a frequency, not a cause. Bread and Milk co-occur in 43 percent of baskets. That does not mean buying bread makes anyone buy milk. It means the two items share shelf space in customer behavior, which is enough to justify a store layout or a bundle promotion.
The spend split is a second kind of result. The high group averages 17.5133 and the low group averages 10.0933, a gap of about 7.42. That gap tells you the split separates baskets with different spending levels. It does not tell you why, and it does not tell you that raising spend on low baskets is possible.
Always compare a mined pattern against a baseline. If Milk appears in most baskets anyway, then "Eggs + Milk" at 0.4000 may be close to what independence would predict. A pattern is interesting when it departs from the baseline, not when it is merely large.
When to Use It (and when not to)
Use data mining when you have more records than you can inspect by hand and a question that can be phrased as a pattern. Market basket analysis, churn prediction, fraud screening, and risk scoring all fit. The method is used across industry, banking, government, and health care delivery [1].
Use it when the data collection system already integrates input from multiple sources, because the quality of the input limits the output [1]. Use it when you can evaluate results against observed outcomes and refine the model over time [1].
Do not use it as a first step on a problem you have not defined. A mining run on an undefined question produces a list of patterns with no way to rank them. Do not use it when the data is too small, wrong, or insufficient, because those conditions cause mining to fail [5]. Do not use it when the cost of a false positive is high and you have no way to check the flagged cases.
Data Mining vs Statistics and Machine Learning
These three overlap heavily, and the boundaries are conventions rather than laws. The table below gives the practical difference.
| Aspect | Data Mining | Statistics | Machine Learning |
|---|---|---|---|
| Main goal | Find useful patterns in large data sets [1] | Estimate and test parameters, quantify uncertainty | Build models that predict well on new data |
| Typical setting | Applied business, health, government problems [1] | Designed studies and experiments | Prediction and automation tasks |
| Emphasis | The full process from problem definition to deployment [3] | Inference and model assumptions | Generalization and predictive accuracy |
| Shared tools | Trees, neural networks, clustering, association rules [3] | Regression, density estimation, mixture models [5] | Classifiers, forests, kernel methods [5] |
The cleanest way to hold the distinction: statistics and machine learning supply methods, and data mining is the applied process that selects among them, runs them on real data, and puts the result to work [3][5].
Common Mistakes
- Treating a high count as a strong pattern. A pair can be frequent simply because both items are popular. Fix: compare the observed count against what independence would predict before calling it a finding.
- Skipping problem definition. Starting with the algorithm instead of the question produces unrankable output. Fix: write the decision the result will inform before you run anything [3].
- Ignoring data quality. Bad data, wrong data, and insufficient data are named causes of mining failure [5]. Fix: profile the source tables before modeling.
- Confusing correlation with cause. Co-occurrence in baskets is not a causal effect. Fix: treat mined patterns as hypotheses and test them with a controlled comparison when the stakes are high [5].
- Overfitting to the sample. A pattern that holds in your 30 transactions may not hold in the next 30. Fix: evaluate on held-out data and refine the model against observed results [1].
- Deploying without evaluation. A model that never gets checked against reality drifts. Fix: compare predicted results against observed ones on a schedule [1].
Limitations
Data mining finds patterns in the data you have, and it cannot find patterns that are not there. If a variable was never recorded, no method recovers it. If the sample is biased, the mined patterns inherit the bias. The method also produces false positives at scale, and a large search over many candidate patterns will surface some that are pure noise [5].
Interpretation is the other limit. A mined rule tells you what co-occurs, not why. Turning a pattern into a decision requires domain knowledge, a baseline, and often an experiment. Mining is a step in a longer process, and it is only as good as the problem definition and evaluation that surround it [3].
Frequently Asked Questions
What is the simple data mining definition?
Data mining is the automatic extraction of useful, often previously unknown information from large databases or data sets [1]. In practice it means running algorithms over collected records to surface patterns that inform decisions. It is a process, not a single tool.
Is data mining the same as machine learning?
No, though they overlap. Machine learning supplies many of the algorithms data mining uses, such as classifiers and forests [5]. Data mining is the broader applied process that includes problem definition, data preparation, model selection, evaluation, and deployment [3]. You can mine data with purely statistical methods and no machine learning at all.
What is database mining, and is it the same thing?
"Database mining" is an older phrasing for the same idea. The modern term is data mining, and it covers structured sources like relational databases plus unstructured data such as text [2]. The underlying activity is identical: extracting useful patterns from stored records.
What are common data mining methods?
Common methods include classification and regression trees, neural networks, association rules such as market basket analysis, and clustering [3]. These cover both supervised learning, where you have a known outcome to predict, and unsupervised learning, where you look for structure without labels [3].
How much data do you need for data mining to work?
There is no fixed threshold, but insufficient data is a recognized cause of failure [5]. The practical test is whether the pattern you are looking for can appear often enough to distinguish from noise. In the worked example, 30 transactions were enough to rank product pairs, but not enough to make strong claims about causes.
References
- Tepas JJ. (2009). Data mining: childhood injury control and beyond. The Journal of trauma
- 4.8: Data Mining - Workforce LibreTexts
- IT 170 - Description
- Big Data and Data Mining: Defining the Differences | Maryville Online
- Statistics 36-350: Data Mining (Fall 2009)