Test Statistic Calculators for Hypothesis Testing in Biology
By Dr. Zubair Khalid, DVM, MS, PhD ·

A test statistic is one number that measures how far your sample data fall from the null hypothesis, and the p-value is the probability of seeing a statistic at least that extreme if the null hypothesis were true. Every test statistic calculator, whether it is a browser page, a spreadsheet function, or a scripted pipeline, exists to convert that first number into the second. The rule of thumb for choosing one is simple. For one quick test on a small, clean table, a web calculator or spreadsheet is enough. For large, paired, hierarchical, or publication-bound data, use scriptable software such as R or Python so the analysis can be repeated exactly by someone else.
This guide covers the main test statistic calculators for hypothesis testing in biology, explains each option on its own terms with its pros and cons, compares them on the criteria that decide real choices, walks through worked scenarios, and lists the mistakes that most often invalidate a result.
What a Test Statistic Actually Is
Null hypothesis. The default claim that there is no effect, no difference, or no association. In an enzyme experiment, the null hypothesis says the treatment does not change activity. In a genetic cross, it says the offspring counts follow the expected ratio.
Test statistic. A standardized summary of the gap between your data and that null claim. Common ones in biology include t (the difference between means relative to the noise in the data), chi-square (the mismatch between observed and expected counts), F (the spread among group means in ANOVA), U (rank separation in the Mann-Whitney test), and r or z (correlation). Each statistic follows a known distribution when the null hypothesis is true, which is what lets software attach a probability to it.
p-value. The probability of a test statistic at least as extreme as the one observed, calculated under the null hypothesis. A p-value below the significance threshold alpha, conventionally 0.05 in much of biology, leads you to reject the null.
Degrees of freedom. The number of values in the calculation that are free to vary, determined by sample size and design. A two-sample t-test with 10 observations per group has 18 degrees of freedom. The calculator needs this number to find the p-value.
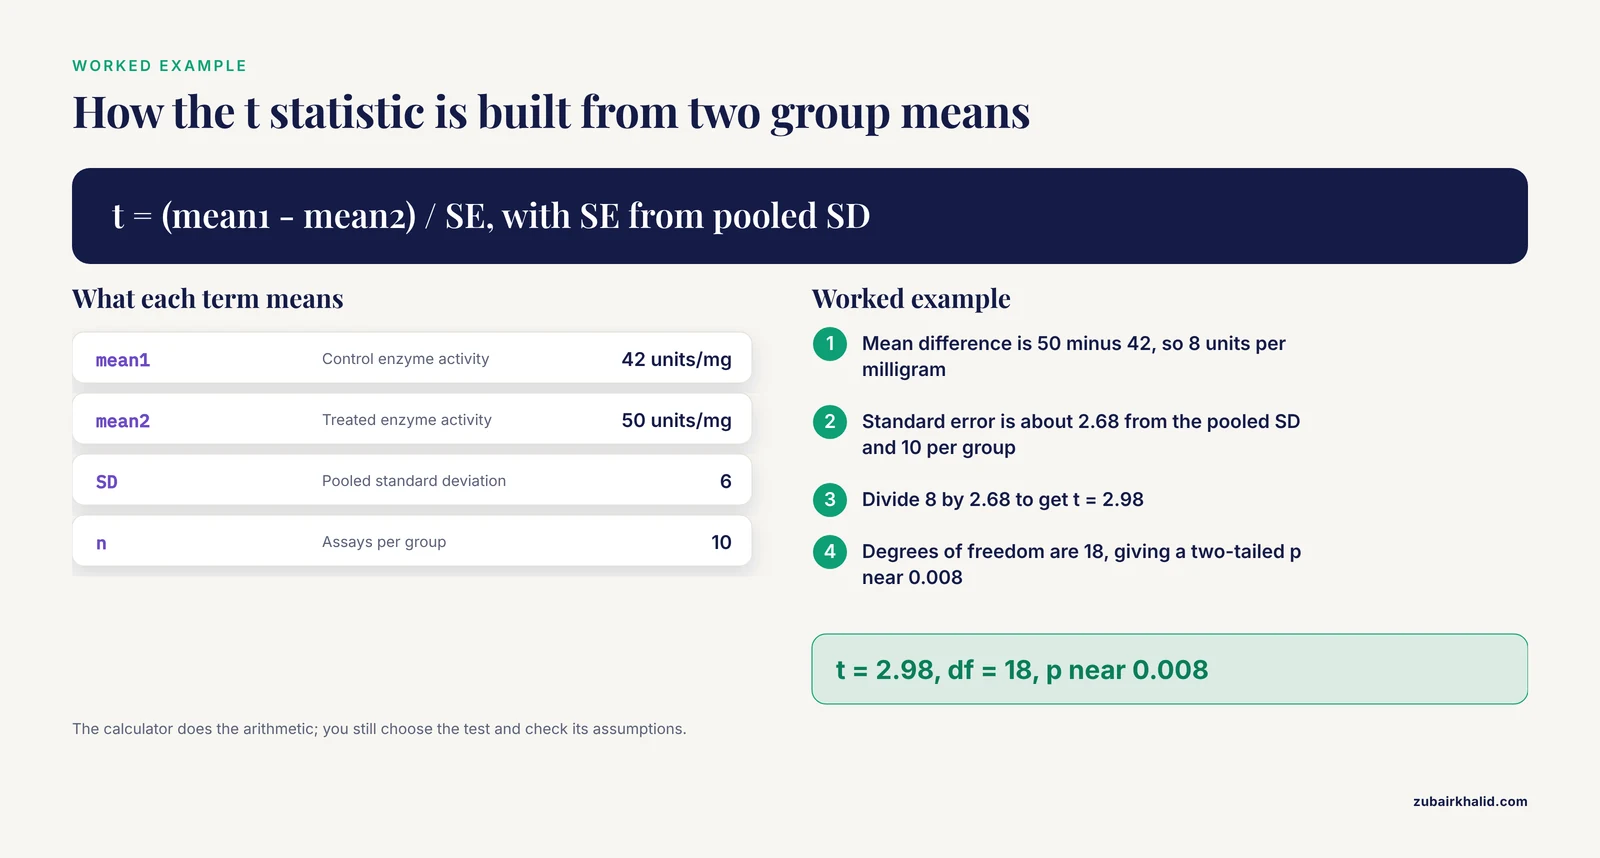
A worked example makes the machinery concrete. Suppose 10 control enzyme assays average 42 units per milligram and 10 treated assays average 50 units per milligram, with a pooled standard deviation of 6. The t statistic is the mean difference divided by its standard error, 8 divided by about 2.68, which gives t = 2.98 with 18 degrees of freedom and a two-tailed p near 0.008. A calculator does that arithmetic in a fraction of a second. The analyst still has to choose the test, verify its assumptions, and interpret the output.
Count data work the same way with a different statistic. In a hypothetical dihybrid cross expecting a 9:3:3:1 ratio, observed counts of 320, 104, 108, and 36 sit very close to the expected 319.5, 106.5, 106.5, and 35.5. The chi-square statistic sums the squared differences divided by the expected counts and comes out near 0.09 with 3 degrees of freedom, giving p near 0.99. The data are fully consistent with the expected ratio.
A typical calculator output reports four things together: the statistic itself, the degrees of freedom, the p-value, and often a confidence interval for the effect. All four belong in a lab report, because the p-value alone says nothing about how big the effect is.
Why Biologists Reach for Calculators
Statistics is usually a service course in a biology curriculum, and most working biologists are trained in organisms first and analysis second. The volume of modern data has meanwhile made hand calculation impossible. A single RNA-seq experiment produces test statistics for thousands of genes, and even a modest method-comparison study can involve dozens of formal tests. Calculators, from the humblest web form to a full pipeline, are how that work gets done.
There is also direct evidence that beginners can learn scriptable tools. A teaching study introduced R, a free programming language for statistics, as a complement to SPSS for teaching confirmatory factor analysis, a method for measuring how reliably a questionnaire or instrument scores a trait, to nine non-statisticians that included healthcare graduate students and community stakeholders [1]. The pairing worked. That result generalizes to any biology lab weighing whether its members can handle a code-based calculator.
Test Statistic Calculator Options at a Glance
The comparison table below is the core of this article. Each row is a category of tool rather than a single product, and most working labs end up using two or three of them side by side.
| Calculator type | Best for | Typical tests | Strengths | Limitations |
|---|---|---|---|---|
| , - | , - | , - | , - | , - |
| Web single-test calculators | One quick test on a small table | t-test, chi-square, Fisher exact, correlation | No setup, free, guided input fields | One test at a time, no data storage, no audit trail |
| Spreadsheets (Excel, Google Sheets) | Lab courses and small datasets | T.TEST, CHISQ.TEST, Z.TEST, regression | Familiar, widely available, visible formulas | Short test menu, easy to mis-set options, fragile row alignment |
| Point-and-click packages (SPSS, Prism, JMP, Minitab, SAS) | Core lab analyses and clinical-style studies | t-tests, ANOVA, nonparametric tests, regression, survival analysis | Guided menus, publication-ready plots, documented output tables | License cost, click paths are hard to reproduce from a methods paragraph |
| Scriptable languages (R, Python) | Research analyses, automation, publication | Every standard test plus exact, permutation, and bootstrap methods | Free, reproducible scripts, enormous package libraries | Learning curve, silent defaults, easy to run many tests and pick a favorite |
| Bioinformatics calculators and pipelines | Sequencing, omics, and instrument comparison | Differential expression, pseudobulk mixed models, outlier and heterogeneity tests | Built for high-dimensional biological data at scale | Require scripting and strict input formats |
| Handheld graphing calculators | Classroom exercises and exams | t-tests, chi-square, simple regression | Allowed where laptops are not, low cost | Tiny datasets only, no reproducibility |
Web Calculators for Single Tests
Free browser calculators from statistics textbooks, universities, and software vendors cover the tests biology coursework uses most: the t-test, chi-square goodness of fit, Fisher exact test for a 2 by 2 table, and correlation.
Pros:
- Nothing to install, and the labeled input fields teach you what the test needs.
- Ideal for a Punnett-style count table or a quick check of a lab notebook comparison.
- Results appear with the test statistic, degrees of freedom, and p-value together.
Cons:
- One test at a time, with no memory of your data between runs.
- No assumption checks, so normality and independence are entirely on you.
- Hand entry invites transcription errors, and the result lives in a screenshot rather than a repeatable file.
A web calculator is a reasonable first look. Anything headed for a manuscript should be re-run in software you can name, version, and repeat.
Spreadsheets as Everyday Biology Calculators
Excel and Google Sheets are the default biology calculator in most teaching labs. The relevant functions are T.TEST for comparing two groups (with arguments for one-tailed versus two-tailed testing and for paired versus independent samples), CHISQ.TEST for comparing observed and expected counts, Z.TEST for a known-variance comparison, CORREL for association, and LINEST for linear regression. Excel's Data Analysis ToolPak adds ANOVA and a fuller t-test menu.
Pros:
- Data, calculations, and plots live in one file that instructors and collaborators can open.
- Formulas sit visible in cells, which makes simple calculations self-documenting.
- Nearly every computer already has one.
Cons:
- The test menu is short. Base Excel has no built-in Mann-Whitney U or Fisher exact test.
- Options are easy to mis-set. The T.TEST type argument silently switches between paired and unpaired calculations, and the wrong choice changes the answer.
- Sorting or filtering rows can misalign paired observations without any warning.
Spreadsheets handle a lab report well. They strain quickly once the analysis involves repeated measures, many tests, or data beyond a few thousand rows.
Point-and-Click Statistical Packages
Packages such as SPSS, GraphPad Prism, JMP, Minitab, and SAS wrap statistical tests in menus. You select columns, choose a test, and the output table reports the test statistic, degrees of freedom, p-value, and confidence interval in a format that translates directly into a results section.
Pros:
- Guided dialogs reduce the chance of running a test that does not match the design.
- Output is standardized and documented, which helps when a supervisor or reviewer checks the work.
- Plotting is integrated, so the figure and the test come from the same data.
Cons:
- Licenses cost money, which matters for students and small labs.
- A click path is hard to write down. Two people repeating the same analysis from the same methods paragraph can land on different options.
- Defaults still need checking on every run, including tails, variance assumptions, and pairing.
SPSS remains common in health and life science teaching, and many educators now pair it with a scriptable language rather than replace it, a sensible pattern for a lab in transition.
Scriptable Tools: R and Python
R and Python are free languages that compute every standard test statistic and most nonstandard ones. In R, t.test() runs t-tests, chisq.test() runs chi-square tests, fisher.test() runs Fisher exact tests, wilcox.test() runs Mann-Whitney U tests, aov() and lm() handle ANOVA and regression, and shapiro.test() checks normality. In Python, the SciPy library provides scipy.stats.ttest_ind, chi2_contingency, and mannwhitneyu, and statsmodels adds regression and post-hoc tools.
Pros:
- Free on every platform, with package libraries covering genomics, ecology, imaging, and epidemiology.
- The script is the audit trail. Re-running it reproduces every statistic, which is what data journals and reviewers increasingly ask for.
- Permutation tests, bootstrapped confidence intervals, and exact tests are one function call away.
Cons:
- The learning curve is real, although the teaching trial described earlier shows that non-statisticians can pick R up when it is introduced through a concrete case study [1].
- Silent defaults can bite. A function may assume two-tailed testing or a particular variance treatment unless you say otherwise.
- Running twenty tests and reporting the two that look good is trivially easy in code, and no calculator will stop you.
For a research career in the life sciences, R or Python is the tool to learn. The question is not whether to adopt one but when.
Bioinformatics Calculators for High-Throughput Data
A bioinformatics calculator is a package or pipeline that computes test statistics at scale for biological measurements such as gene expression matrices, methylation arrays, sequencing counts, or instrument readouts. These tools exist because high-throughput biology breaks the one-test-at-a-time model.
Differential expression packages such as DESeq2, edgeR, and limma compute a test statistic for every gene and then adjust the p-values for the thousands of tests run at once, controlling the false discovery rate, the expected share of false positives among the results you call significant.
Single-cell RNA sequencing introduced a subtler problem. Early studies often treated thousands of cells from one patient as thousands of independent observations, an error called pseudoreplication that inflates test statistics. An integrated analysis of cutaneous T cell lymphoma assembled 244 samples from 132 patients, noted that earlier small studies had suffered exactly this problem, and applied pseudobulk aggregation, which collapses cells into one profile per donor before testing, together with robust linear mixed-effects modeling [2].
Instrument comparison is another specialty. A systematic evaluation of 14 digital PCR systems, eight droplet-based and six chip-based, used Cochran's and Grubbs' tests, standard procedures for flagging statistical outliers in replicated measurements, to identify platforms whose precision was out of line. Absolute copy number concentrations varied across platforms, with relative standard deviations of 6.05 to 12.71 percent, while copy number ratios were far more stable, with relative standard deviations as low as 0.47 percent [3]. The lesson travels beyond PCR. Formal outlier tests exist because eyeballing a table does not scale, and ratios often compare better than absolute values when instruments differ.
Meta-analysis calculators pool results across studies. A systematic review of Leptospira exposure among occupationally at-risk workers pooled 42 studies covering 11,155 participants with a random-effects model, which allows the true effect to vary between studies, and measured heterogeneity with Cochran's Q and the I² statistic, the share of observed variation attributable to real differences between studies rather than chance [4]. Egger's regression test checked for small-study bias. General-purpose statistical software computes all of these quantities, and dedicated meta-analysis packages automate the whole sequence.
How to Choose a Test Statistic Calculator for Biology Research
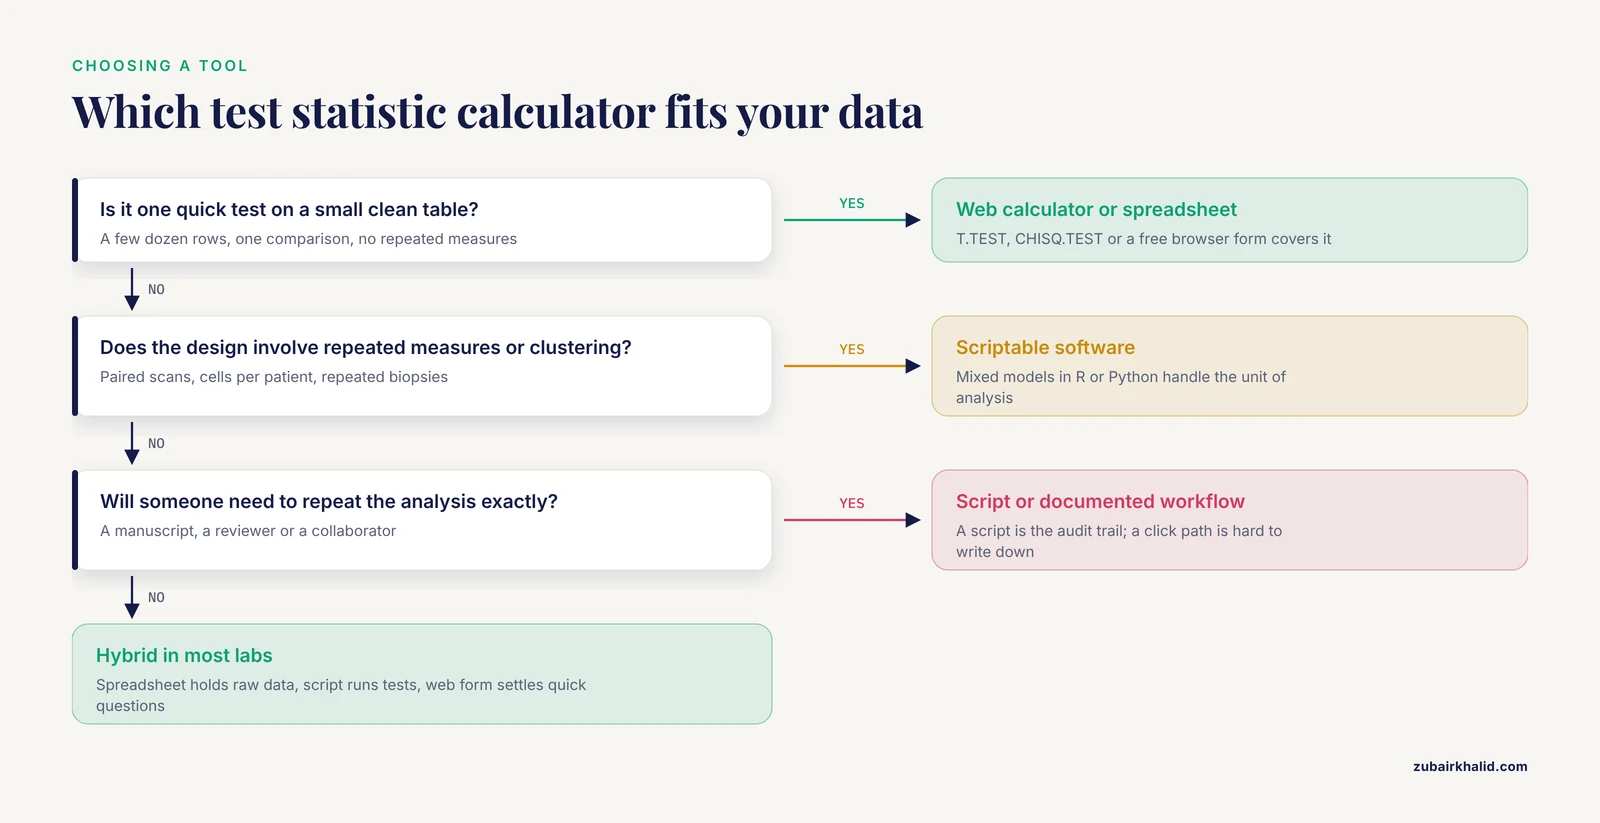
Five criteria decide most choices.
- Design complexity. One comparison of two groups fits any tool. Repeated measures, clustered sampling, or batch effects push you toward mixed models in scriptable software.
- Data volume. Beyond a few hundred rows or a handful of tests, manual entry into a web calculator becomes the bottleneck and the main error source.
- Reproducibility. If anyone will need to repeat the analysis, a script or a documented point-and-click workflow beats a screenshot of a web form.
- Audience. Coursework tolerates spreadsheets. Manuscripts expect named software and versions. Collaborators may expect R scripts they can extend.
- Your trajectory. A student planning a research career benefits from learning R or Python early, because the same skills transfer directly to bioinformatics calculators later.
Most working biologists converge on a hybrid. A spreadsheet holds the raw data, a scriptable environment runs the tests, and a web calculator settles quick questions during lab meeting.
Worked Scenarios
Scenario 1: Two treatment groups and a small sample
A lab measures enzyme activity in 10 control and 10 treated samples. The plan: state the null hypothesis, check normality in each group, and run a two-sample t-test if the data are approximately normal or a Mann-Whitney U test if they are not. This is the standard workflow in small-sample biology. A laser dentistry study of 70 teeth divided into seven groups followed exactly this pattern, using the Kolmogorov-Smirnov test to assess normality and then Kruskal-Wallis and Mann-Whitney U tests for comparisons at alpha = 0.05 [5]. Any calculator in the table can run these tests. The spreadsheet T.TEST covers the parametric version, and R's wilcox.test() covers the rank-based alternative.
Scenario 2: Comparing categories between groups
A survey compares nicotine product choices between medical and non-medical students, 388 participants in total. Category counts, such as disposable e-cigarettes versus traditional cigarettes, call for a chi-square test, while a skewed dependence score calls for a Mann-Whitney U test. That is precisely the analysis pair used in the published study of physiotherapy and humanities students [6]. The calculator choice here is flexible. A web chi-square calculator, Excel's CHISQ.TEST, and R's chisq.test() all return the same statistic from the same contingency table.
Scenario 3: Paired measurements on the same subjects
Fifty breast cancer patients each received two PET scans, one with a FAPI tracer and one with FDG, so the two sensitivity estimates are paired, not independent. Comparing paired binary outcomes requires the McNemar test rather than an ordinary chi-square test. The study used the exact McNemar test, which computes the p-value directly from the paired data instead of from an approximation, and reported a primary-lesion sensitivity of 100 percent (95 percent CI 92.9 to 100.0) for FAPI versus 92 percent (95 percent CI 80.4 to 100) for FDG, with exact McNemar p = 0.0625, so the difference did not reach statistical significance [7]. Two lessons follow. First, pairing changes which test statistic is valid. Second, a numerically higher result with a p-value just above 0.05 is not a positive finding, however promising it looks.
Scenario 4: High-throughput data with hidden structure
A single-cell dataset contains many cells per patient, and a methylation study contains repeated biopsies per participant. In both cases the independent unit is the donor, not the cell or the methylation site. A pipeline for exercise-associated DNA methylation in skeletal muscle worked with a public cohort of 195 samples from 52 participants, estimated evidence at each methylation site within subcohorts, combined those estimates with Fisher's method, a way of merging p-values from independent tests, and calibrated the result with permutation testing, which rebuilds the null distribution by shuffling labels, reaching permutation p ≤ 0.002 [8]. Cross-validation was grouped by individual so that measurements from the same person never appeared in both the training and test sets. The lymphoma atlas described in the bioinformatics section handled the same issue on the single-cell side by aggregating cells to one profile per patient before modeling [2]. A desktop calculator cannot run these designs. A bioinformatics calculator in R or Python can, and respecting the unit of analysis is what separates a defensible test statistic from an inflated one.
Common Mistakes and Limitations
- Pseudoreplication. Treating cells, reads, or wells as independent replicates when the true replicate is the animal, patient, or culture inflates test statistics and shrinks p-values artificially. The single-cell lymphoma analysis documented this failure in prior studies and corrected it with pseudobulk aggregation [2]. Before running any test, name the independent unit out loud.
- Skipping assumption checks. t-tests and ANOVA assume approximately normal residuals and independent observations. Combining p-values across evidence sources assumes those sources are independent, and one computational drug-prioritization study deliberately reported rank concordance instead of a combined-probability test because its evidence streams shared overlapping cell-cycle and DNA-damage signal [9]. Logistic regression has its own trap, quasi-complete separation, which appeared across all algorithms in a prohormone prediction comparison and restricted how well the models generalized [10]. When a test statistic looks absurdly large, check the assumptions before celebrating.
- Forcing tests onto tiny samples. A calculator will happily return a p-value from two observations per group, and the number will be meaningless. An imaging mass cytometry study of brain metastases had four tissue samples from three patients and therefore ran descriptive and exploratory statistics only, with no formal group comparison [11]. Knowing when not to compute a p-value is part of the skill.
- Over-reading point estimates. As the paired PET scenario showed, a numerically higher sensitivity with a p-value just above 0.05 is not a demonstrated difference. Confidence intervals carry the uncertainty that the point estimate hides.
- Trusting method comparisons uncritically. A meta-research analysis of machine learning versus logistic regression for trauma mortality prediction, with 17 studies and 243,324 patients in its primary analysis, found that the apparent advantage of machine learning was shaped by evaluation practices, including pitting the best-performing model against a single logistic regression comparator [12]. When a comparison favors your preferred calculator or method, ask how the comparison was constructed.
- Ignoring multiplicity. Testing thousands of genes guarantees small p-values by chance. High-throughput workflows control the false discovery rate and use permutation-based calibration, as the methylation pipeline did [8]. A single web calculator has no such guard, because it assumes you ran one test.
- Trusting defaults. One-tailed versus two-tailed, equal versus unequal variance, paired versus unpaired, and continuity corrections all change the statistic. Check every option on every run, in every tool.
- Confusing significance with importance. A p-value of 0.04 attached to a 2 percent change in tumor size and a p-value of 0.04 attached to a 40 percent change are not the same finding. The test statistic and the p-value measure evidence against the null, not the size or biological importance of the effect. Report effect sizes and confidence intervals alongside every p-value.
- Expecting the calculator to fix the design. No test statistic rescues a confounded experiment, a missing control group, or a non-random sample. For high-stakes decisions, regulatory submissions, or unfamiliar designs, bring in a biostatistician before the data are collected, not after.
Frequently Asked Questions
What is a test statistic in simple terms?
It is one number that summarizes how far your data are from what the null hypothesis predicts. The calculator compares that number against a known distribution to produce the p-value.
Which test statistic calculator should a biology student start with?
Start with a spreadsheet for coursework, because T.TEST and CHISQ.TEST cover most lab reports. Add a free web calculator for quick single tests, and start learning R before thesis work, because research datasets outgrow both.
Can Excel handle hypothesis testing for biology lab reports?
Yes. T.TEST, CHISQ.TEST, and the Data Analysis ToolPak cover t-tests, chi-square tests, and basic ANOVA. The limits show up with nonparametric tests, repeated measures, and large datasets, where R or a dedicated package is the better tool.
What is the best test statistic calculator for bioinformatics data?
A scriptable pipeline in R or Python built on packages designed for high-throughput biology, such as DESeq2 or limma. Sequencing data need batch processing, false discovery control, and reproducible code, which web calculators and spreadsheets cannot provide.
How do I choose the right statistical test for my experiment?
Match the test to the design before you open any tool. Ask whether the data are counts or measurements, whether groups are paired or independent, how many groups there are, and whether the data meet the assumptions. Then choose the calculator that runs that test and documents the run.
Are free web calculators acceptable for published research?
For a single simple test, yes, provided you record the tool, the inputs, and the output. Most journals expect the final analysis to be reproducible in named software, so re-run anything central to the paper in R, Python, or a documented package.
Sources
- Teaching Confirmatory Factor Analysis to Non-Statisticians: A Case Study for Estimating Composite Reliability of Psychometric Instruments.
- Large-scale integrated single-cell analysis reveals molecular subtypes and microenvironmental remodeling in cutaneous T cell lymphoma.
- A multi-platform evaluation of digital PCR systems for DNA quantification: Implications for method standardization and metrological comparability.
- Global seroprevalence of Leptospira spp. infection in workers with occupational risk: a systematic review with meta-analysis.
- In Vitro Evaluation of Temperature Variation in Dental Tissues During Er:YAG Laser-Assisted Ceramic Veneer Removal.
- Does medical education protect against nicotine dependence? A comparison of e-cigarette use among physiotherapy and humanities students.
- Comparison of (68)ga fapi pet/ct and (18)f-fdg pet/ct in primary staging of breast cancer.
- A Batch-Aware, Subject-Grouped Pipeline to Prioritize HIIT-Associated DNA Methylation Candidates with Cross-Cohort Evaluation in Skeletal Muscle.
- Bias-Controlled Computational Prioritisation of Therapeutic Hypotheses From Heterogeneous Molecular Data Identifies PLK1 as the Leading MTX-Combination Candidate in Choriocarcinoma.
- Comparison of prohormone processing prediction using different artificial intelligence algorithms.
- Single cell imaging mass spectrometry spatial immune profiling of brain metastasis from non-small-cell lung cancer patients treated with immune checkpoint inhibitors.
- Systematic bias in comparative evaluations of machine learning vs logistic regression for clinical prediction models: a meta-research analysis using trauma mortality as an empirical case.