How to Average Percentages Correctly (With Examples)
By Dr. Zubair Khalid, DVM, MS, PhD ·
To average percentages correctly, you usually need a weighted average, not a plain mean. A simple mean treats every percentage as equally important even when the groups behind them have different sample sizes. Weight each percentage by the number of observations it came from, then divide by the total.
Quick Answer
- A simple mean of percentages is only correct when every percentage comes from the same number of observations.
- When group sizes differ, use a weighted average: multiply each percentage by its count, add the products, and divide by the total count.
- The weighted average answers "what is the overall rate across all observations?" The simple mean answers "what is the average of these group rates?"
- The two can differ by several percentage points, and the gap grows as group sizes become more unequal.
- If you only have the percentages and no counts, you cannot compute the correct overall rate.
Before You Start
You need three things before you average anything.
First, know what each percentage represents. A percentage is a ratio with a numerator and a denominator. "80% passed" means 80 out of 100, or 0.8 as a proportion. The denominator is the group size, and it is the weight you will need.
Second, decide what question you are answering. If you want the overall rate across all groups combined, weight by group size. If you want the unweighted mean of the group rates as a summary of the rates themselves, a simple mean is fine. These are different questions with different answers.
Third, check that the percentages are on the same base. Mixing a pass rate, a growth rate, and a share of a budget in one average produces a number with no clear meaning.
Measurement error is another reason to be careful. A percentage computed from 25 people carries more uncertainty than one computed from 400 people, and weighting by sample size partly reflects that difference in precision [1][2].
Step by Step
- List each group with its percentage and its count. Write the percentage as a proportion (80% becomes 0.80) and note the denominator.
- Convert each percentage to a proportion. Divide by 100. This keeps the arithmetic clean and avoids decimal errors later.
- Multiply each proportion by its count. This recovers the numerator, the number of "successes" or events in that group.
- Add the numerators. This gives the total number of events across all groups.
- Add the counts. This gives the total number of observations.
- Divide the total numerator by the total count. The result is the weighted average as a proportion.
- Convert back to a percentage. Multiply by 100.
The formula for a weighted average of percentages is:
$$\bar{p}_w = \frac{\sum_{i=1}^{k} n_i p_i}{\sum_{i=1}^{k} n_i}$$
Here $n_i$ is the count for group $i$ and $p_i$ is that group's proportion. The simple mean, for comparison, is:
$$\bar{p} = \frac{\sum_{i=1}^{k} p_i}{k}$$
Notice that the simple mean ignores $n_i$ entirely. That is the whole source of the disagreement.
Worked Example
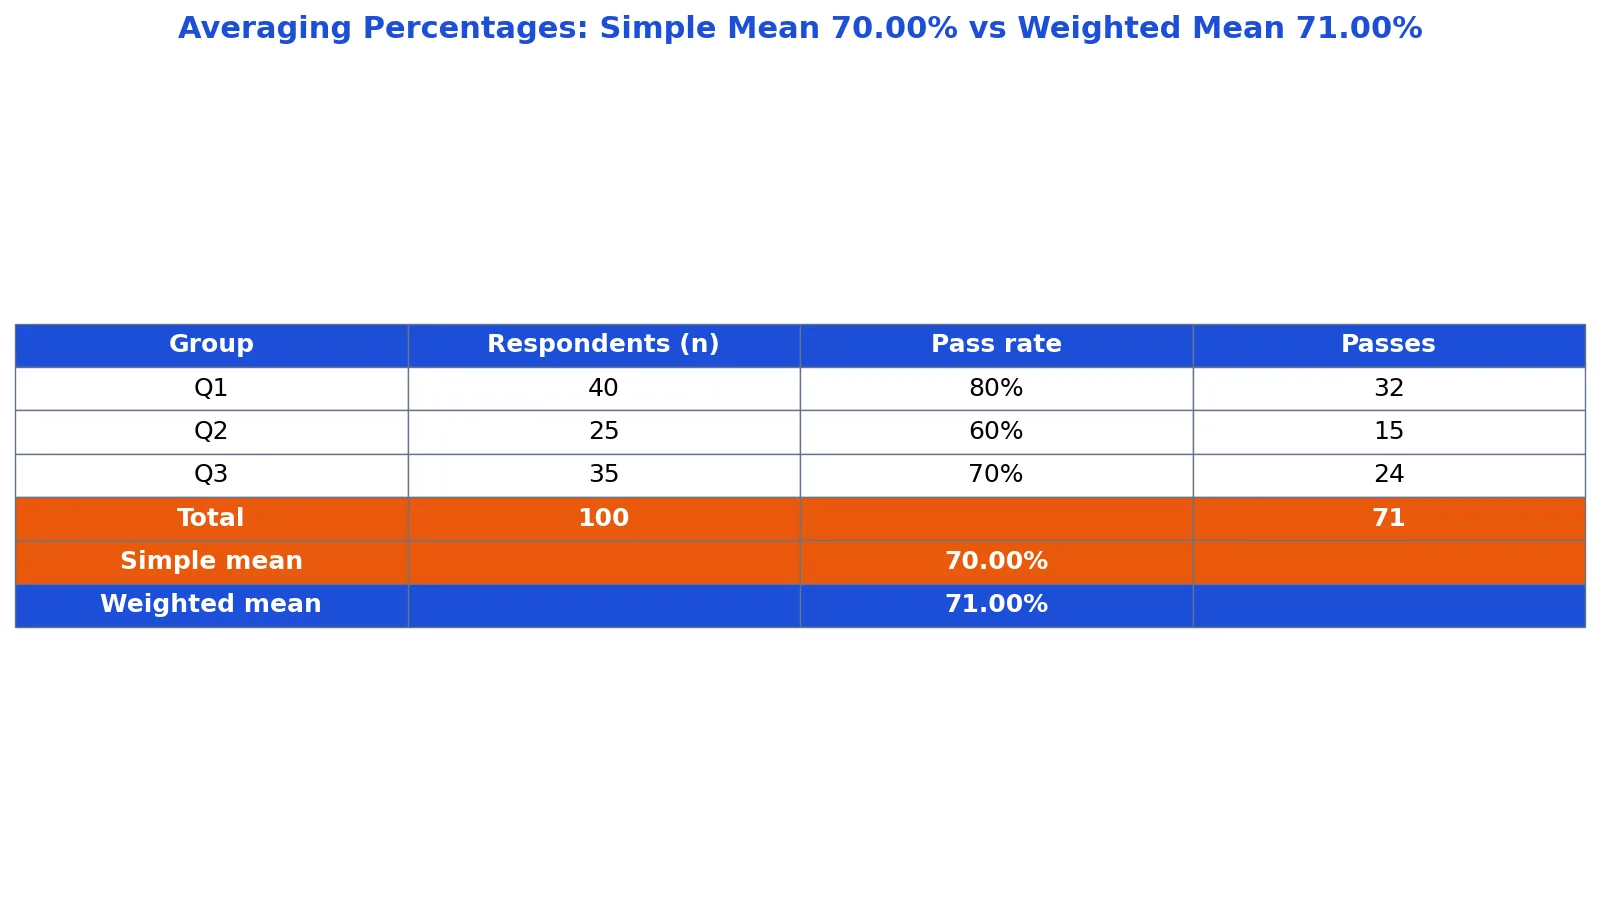
Three survey questions had different numbers of respondents and different pass rates.
| Group | Respondents | Pass rate | Passes |
|---|---|---|---|
| Q1 | 40 | 80% | 32 |
| Q2 | 25 | 60% | 15 |
| Q3 | 35 | 70% | 24 |
Walking through the steps:
- Q1: n = 40, rate = 80% -> passes = 32
- Q2: n = 25, rate = 60% -> passes = 15
- Q3: n = 35, rate = 70% -> passes = 24
- Simple (unweighted) mean of the three percentages: (80% + 60% + 70%) / 3 = 70.0000%
- Total respondents: 40 + 25 + 35 = 100
- Total passes: 32 + 15 + 24 = 71
- Weighted average (correct): 71 / 100 = 0.7100 = 71.0000%
- Difference (simple minus weighted): 70.0000% - 71.0000% = -1.0000 percentage points
The simple mean says 70%. The correct overall pass rate is 71%, because the largest group (Q1) also had the highest pass rate, so it pulls the combined rate up. The simple mean understates the true rate by 1 percentage point here. With more uneven group sizes, that gap gets larger.
Here is the same calculation in Python:
import numpy as np
n = np.array([40, 25, 35])
pct = np.array([0.80, 0.60, 0.70])
simple = pct.mean()
weighted = (n * pct).sum() / n.sum()
print(f"simple = {simple:.4f}, weighted = {weighted:.4f}")
Output:
simple = 0.7000, weighted = 0.7100The simple value is the unweighted mean of the three rates. The weighted value is the overall rate across all 100 respondents. Only the second one answers "what percentage passed overall?"
Other Ways to Do It
Spreadsheet formula. If your counts are in column B and your rates in column C, the weighted average is =SUMPRODUCT(B2:B4,C2:C4)/SUM(B2:B4). This works whether the rates are stored as decimals or as percentages, as long as they are consistent. For a walkthrough of percentage formulas in a spreadsheet, see how to find percentage in Excel.
From raw counts only. If you have the numerators and denominators, skip the percentages entirely. Add the numerators, add the denominators, and divide. This is the same computation and avoids rounding error from pre-rounded rates.
When all counts are equal. If every group has the same $n$, the weighted average equals the simple mean. In that special case, averaging the percentages directly is correct.
Using a calculator. For quick checks, a percentage and percent change calculator handles the division and conversion steps. The weighting logic still has to come from you, since the tool does not know your group sizes.
Related averages. The same weighting principle applies to other rate statistics. If you are averaging ranks or cut points instead of rates, the method differs, as covered in how do you calculate percentile. For a general treatment of weights, see how to calculate a weighted average.
Troubleshooting
The weighted average falls outside the range of the group rates. This cannot happen with correct arithmetic. If it does, you have a data entry error, a misplaced decimal, or a count that does not match its percentage.
The counts do not match the percentages. If a group says 80% but the count and numerator disagree, trust the raw counts. Percentages are often rounded, and rounding accumulates.
You only have percentages. Without counts, you cannot compute the overall rate. You can report the simple mean, but label it clearly as the average of the group rates, not the overall rate.
The percentages sum to something odd. Percentages that are shares of a whole should sum to 100% within each group. If they do not, check whether you are mixing categories.
Very different group sizes. When one group dominates, the weighted average will sit close to that group's rate. That is correct behavior, but it can surprise people who expect a value near the middle.
Common Mistakes
- Averaging percentages directly when group sizes differ. This is the most common error. Fix it by weighting each rate by its count before dividing.
- Treating a percentage as a plain number. A percentage is a ratio. Fix it by converting to a proportion and tracking the denominator.
- Forgetting to convert back to a percentage. Dividing proportions gives a proportion. Fix it by multiplying by 100 at the end.
- Mixing rates with different denominators in one average. A rate per 100 and a rate per 1,000 are not comparable. Fix it by converting to a common base first.
- Rounding the group rates before weighting. Pre-rounded rates introduce error. Fix it by using raw numerators and denominators when you have them.
- Reporting the simple mean as the overall rate. These are different quantities. Fix it by naming which one you computed and why.
Limitations
A weighted average gives you the overall rate, but it hides variation between groups. Two datasets can share the same weighted average while one has consistent rates across groups and the other swings widely. If the spread matters, report the group rates alongside the combined figure.
Weighting by sample size assumes each observation is comparable and independent. If groups were measured differently, at different times, or with different definitions of "pass," combining them into one rate can mislead even when the arithmetic is correct. The weighted average is also sensitive to very large groups, which can dominate the result and make smaller groups nearly invisible in the final number.
Frequently Asked Questions
Can you average percentages directly?
Yes, but only when every percentage comes from the same number of observations. When group sizes differ, the direct mean gives the average of the group rates, not the overall rate. For an overall rate, weight each percentage by its group size.
How do you calculate a percentage average with different sample sizes?
Multiply each percentage by its group count, add those products, and divide by the total count. In the survey example, 80% of 40, 60% of 25, and 70% of 35 combine to 71 out of 100, which is 71%. The simple mean of the same rates is 70%.
What is the difference between a simple mean and a weighted average of percentages?
The simple mean adds the rates and divides by the number of rates. The weighted average adds the underlying counts and divides by the total count. The simple mean summarizes the rates. The weighted average summarizes the observations.
Why is my weighted average different from the simple average?
The gap comes from unequal group sizes combined with different rates. Groups with more observations pull the weighted average toward their own rate. If all groups had equal counts, the two values would match.
How do I average percentages in Excel?
Use =SUMPRODUCT(counts, rates)/SUM(counts), replacing the ranges with your actual cells. Keep the rates in the same format throughout, either all decimals or all percentages. If you have raw numerators and denominators, sum each column and divide instead.
References
- Bland JM, Altman DG (1996). Statistics Notes: Measurement error. BMJ
- Bland JM, Altman DG (1996). Statistics notes: Measurement error. BMJ
Further Reading
- NIST/SEMATECH e-Handbook of Statistical Methods
- OpenStax. Introductory Statistics 2e
- Krzywinski M, Altman N (2013). Importance of being uncertain. Nature Methods
- Krzywinski M, Altman N (2013). Significance, P values and t-tests. Nature Methods