Excel STDEV Function: Syntax, Formula and Examples
By Dr. Zubair Khalid, DVM, MS, PhD ·
Excel STDEV estimates the standard deviation of a sample, which tells you how widely values spread around their average. It is one of the oldest statistical functions in the program and still works in every current version, though Microsoft now points users toward its replacement. This article covers the syntax, a worked example with real numbers, and the errors that trip people up.
Quick Answer
- What it does: Estimates standard deviation based on a sample of a population [1].
- Syntax:
STDEV(number1, [number2], ...)where number1 is required and later arguments are optional [1]. - The math: It uses the "n-1" method, also called the sample standard deviation [1].
- Modern replacement: Microsoft recommends STDEV.S instead, since STDEV is kept only for backward compatibility and may not be available in future versions [1].
- Population instead? Use STDEVP or STDEV.P when your data is the entire population, not a sample [1].
Syntax
The function takes between 1 and 255 number arguments [1].
| Argument | Required? | Meaning |
|---|---|---|
| number1 | Required | The first number argument corresponding to a sample of a population [1] |
| number2, ... | Optional | Number arguments 2 to 255 corresponding to a sample of a population [1] |
You can also pass a single array or a reference to an array instead of comma-separated arguments [1]. The formula looks like this:
$$s = \sqrt{\frac{\sum (x - \bar{x})^2}{n - 1}}$$
Here $x$ is each value, $\bar{x}$ is the sample mean, and $n$ is the sample size. The STDEVA documentation states the same structure for its own calculation, with the sample mean taken as AVERAGE(value1, value2, ...) [2].
How It Works
STDEV measures dispersion. If every value in your sample sits close to the mean, the standard deviation is small. If values scatter widely, it grows. Because the formula divides by $n - 1$ instead of $n$, the result is slightly larger than the population standard deviation for the same data. That adjustment compensates for the fact that a sample rarely captures the full spread of the population it came from.
Argument handling matters as much as the math. When an argument is an array or a reference, only numbers in that array or reference are counted. Empty cells, logical values and text inside the range are ignored, but an error value inside the range makes the formula return that error. This is different from typing values directly into the formula. Logical values and text representations of numbers that you type straight into the argument list are counted [1]. Arguments that are error values, or text that cannot be translated into numbers, cause errors [1].
If you want logical values and text inside a reference to be included, STDEVA does that instead. STDEVA treats TRUE as 1 and text or FALSE as 0 when they appear in a reference [2]. The STDEV function deliberately excludes them [2]. For a population calculation that includes text and logical values, STDEVPA is the matching function, and it uses the "n" method rather than "n-1" [3].
Worked Example
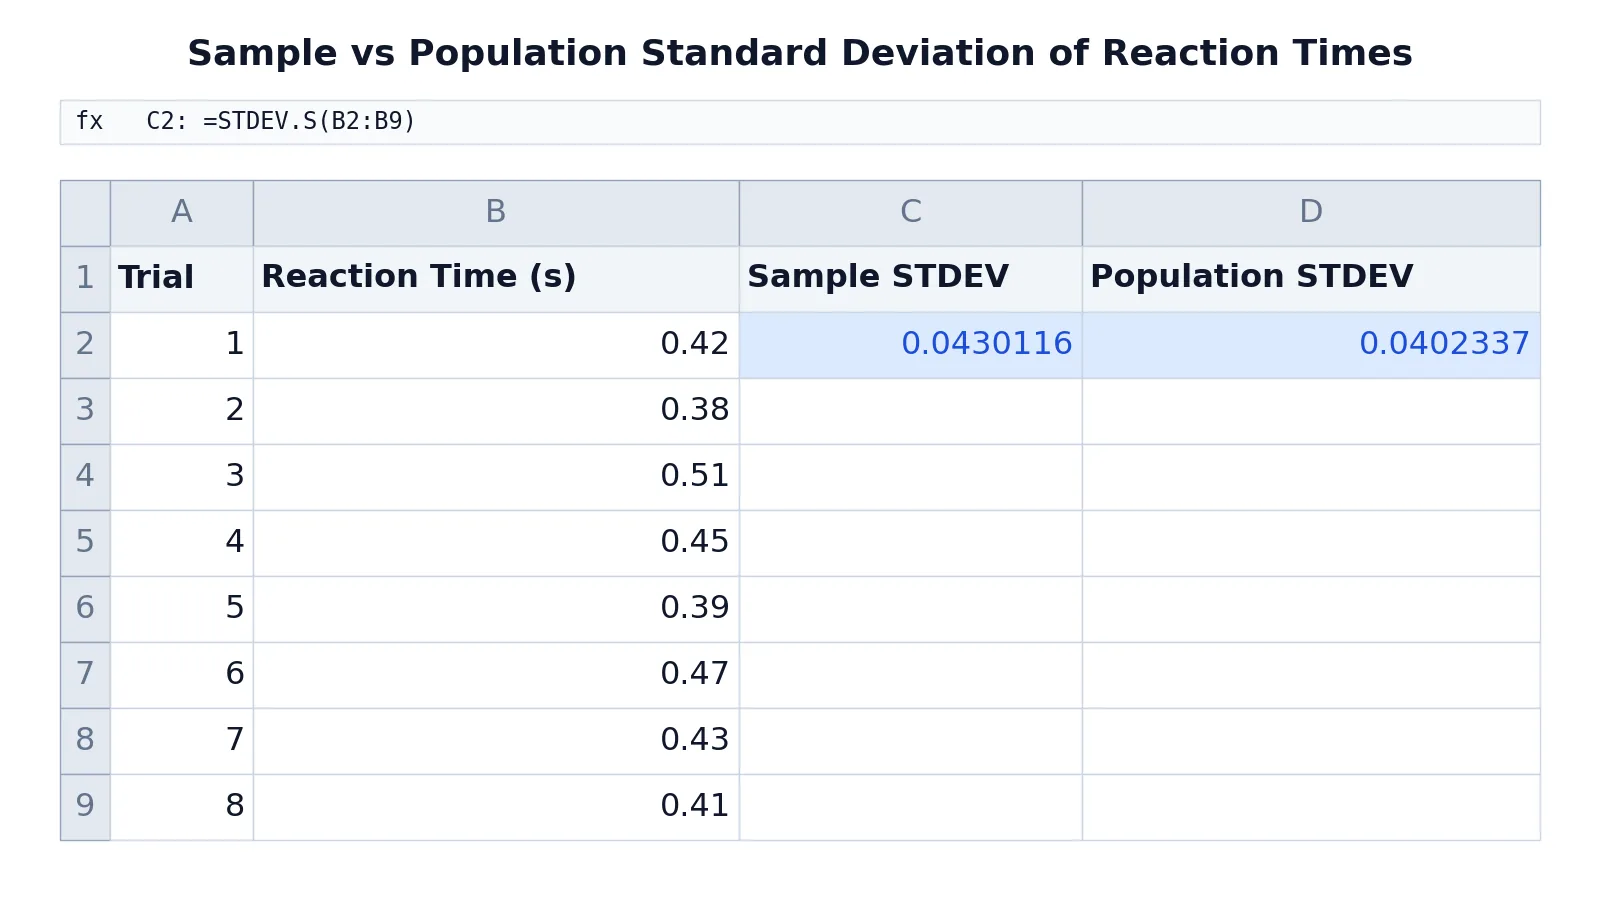
Suppose you ran eight reaction time trials and recorded each result in seconds. You want the sample standard deviation of those eight measurements.
| A | B | C | D | |
|---|---|---|---|---|
| 1 | Trial | Reaction Time (s) | Sample STDEV | Population STDEV |
| 2 | 1 | 0.42 | =STDEV.S(B2:B9) -> displays 0.0430116 | =STDEV.P(B2:B9) -> displays 0.0402337 |
| 3 | 2 | 0.38 | ||
| 4 | 3 | 0.51 | ||
| 5 | 4 | 0.45 | ||
| 6 | 5 | 0.39 | ||
| 7 | 6 | 0.47 | ||
| 8 | 7 | 0.43 | ||
| 9 | 8 | 0.41 |
Cell C2 holds the sample standard deviation of the eight reaction times using STDEV.S, and it returns 0.0430116. Cell D2 holds the population standard deviation of the same eight values using STDEV.P, and it returns 0.0402337. The sample figure is larger, exactly as the $n - 1$ denominator predicts.
If you are working in an older workbook, =STDEV(B2:B9) returns the same 0.0430116 as STDEV.S, because the two functions share the same calculation [1]. The difference is that STDEV.S is the version Microsoft wants you to use going forward.
More Examples
A single range. =STDEV(B2:B9) returns 0.0430116 for the reaction time data above. This is the most common pattern, one contiguous block of numbers.
Multiple ranges. =STDEV(B2:B9, D2:D9) pools two separate blocks into one sample. Each block is treated as part of the same sample, not as two independent samples.
Mixed arguments. =STDEV(B2:B9, 0.5) adds the typed value 0.5 to the sample. Typed numbers are always counted, even when the ranges around them contain text or blanks [1].
Ignoring blanks and labels. If column B also contained the word "missing" in one cell, STDEV would skip it, because text inside a reference is ignored [1]. That behavior is convenient for messy data but dangerous if the text was meant to be a number.
Choosing between sample and population. If your eight trials are the complete set you care about, use =STDEV.P(B2:B9) and get 0.0402337. If they are a sample drawn from a larger process, keep the sample version.
When you need to summarize filtered rows, functions like Excel SUBTOTAL handle hidden rows differently from STDEV, which always sees the whole range you give it.
Errors and How to Fix Them
#DIV/0! This appears when fewer than two numeric values are available. The $n - 1$ denominator becomes zero with a single value, so the calculation cannot proceed. Add more data points or check that your range actually contains numbers.
#VALUE! This happens when an argument is an error value or text that cannot be translated into numbers [1]. Typing =STDEV(B2:B9, "abc") fails for that reason. Remove the offending argument or clean the source data.
Wrong result from a text-heavy range. If a column stores numbers as text, STDEV ignores them because they sit inside a reference [1]. The count of usable values drops and the result shifts. Convert the column to real numbers first.
Unexpectedly large or small values. Check whether you meant the sample or the population version. Using STDEV on a full population overstates the spread slightly, and using STDEVP on a sample understates it.
Errors from a referenced cell. If any cell in the range holds an error such as #N/A, the whole STDEV formula can fail. Trace the source cell and fix it before recalculating.
Common Mistakes
- Confusing sample and population. STDEV assumes its arguments are a sample [1]. If your data is the entire population, use STDEVP or STDEV.P [1]. The fix is to ask whether your rows are everything or a subset.
- Expecting text and logicals to count. STDEV ignores logical values and text inside a reference [1]. If you need TRUE and FALSE included, switch to STDEVA [2].
- Assuming STDEV and STDEV.S differ numerically. They do not. STDEV is the legacy name for the same calculation [1]. The reason to switch is future availability, not accuracy.
- Passing a range with hidden rows. STDEV does not skip hidden rows. If you filter data and expect the result to change, it will not. Use a function built for visible rows instead.
- Forgetting that typed text is counted. Text representations of numbers typed directly into the argument list are counted [1], while the same text inside a reference is ignored. This inconsistency produces results that look wrong until you spot the pattern.
- Reading too much into one number. Standard deviation is easiest to interpret when the spread is roughly symmetric. A single extreme outlier can inflate it and make the sample look more variable than it is.
Limitations
STDEV only describes dispersion around the mean. It says nothing about the shape of the distribution, so two datasets with identical standard deviations can look completely different. It is also sensitive to outliers, since each value's distance from the mean is squared before summing. One bad measurement can dominate the result.
The function also cannot tell you whether your sample is representative. A small sample drawn from a narrow slice of a process will produce a small standard deviation that says more about your sampling than about the process. Pair it with a count and a mean before drawing conclusions. If you need to summarize data under conditions, functions covered in Excel SUMIF and SUMIFS let you build conditional aggregates alongside your dispersion measures.
Frequently Asked Questions
What is the difference between STDEV and STDEV.S?
They calculate the same thing. STDEV.S is the modern name, and STDEV is retained for backward compatibility [1]. Microsoft recommends moving to STDEV.S because the older function may not be available in future versions of Excel [1]. Results are identical for the same inputs.
Does Excel STDEV calculate sample or population standard deviation?
Sample. STDEV assumes its arguments are a sample of the population and uses the "n-1" method [1]. If your data represents the entire population, you must use STDEVP or STDEV.P instead [1]. The population version divides by $n$ and returns a slightly smaller number.
Why does my STDEV formula return #DIV/0!?
The formula needs at least two numeric values. With one value, the $n - 1$ denominator is zero and Excel cannot divide by it. Check that your range contains at least two numbers and that none of them are stored as text, since text inside a reference is ignored [1].
Does STDEV count blank cells and text?
No. When an argument is an array or reference, only numbers are counted, and empty cells, logical values and text are ignored [1]. Error values are not ignored and make the formula return an error. Typed logical values and typed text representations of numbers are a different case and are counted [1]. Use STDEVA if you want logical values and text in a reference included [2].
When should I use STDEV instead of STDEVA?
Use STDEV when your range contains only numbers and you want text and logical values excluded from the calculation [2]. Use STDEVA when TRUE, FALSE and text values in a reference should participate, with TRUE evaluating as 1 and text or FALSE as 0 [2]. For population data with those same rules, STDEVPA is the matching function [3].
If you are building a reporting sheet around this function, the text and formatting techniques in Excel TEXT and the conditional logic in IFS in Excel pair well with a standard deviation column.
References
- STDEV function | Microsoft Support
- STDEVA function | Microsoft Support
- STDEVPA function | Microsoft Support
Further Reading
- Calculating the Mean and Standard Deviation with Excel | Educational Research Basics by Del Siegle | Neag School of Education | University of Connecti
- Broman KW, Woo KH (2018). Data Organization in Spreadsheets. The American Statistician
- Ziemann M, Eren Y, El-Osta A (2016). Gene name errors are widespread in the scientific literature. Genome Biology