3 Dice Probability: Sample Space and Examples
By Dr. Zubair Khalid, DVM, MS, PhD ·
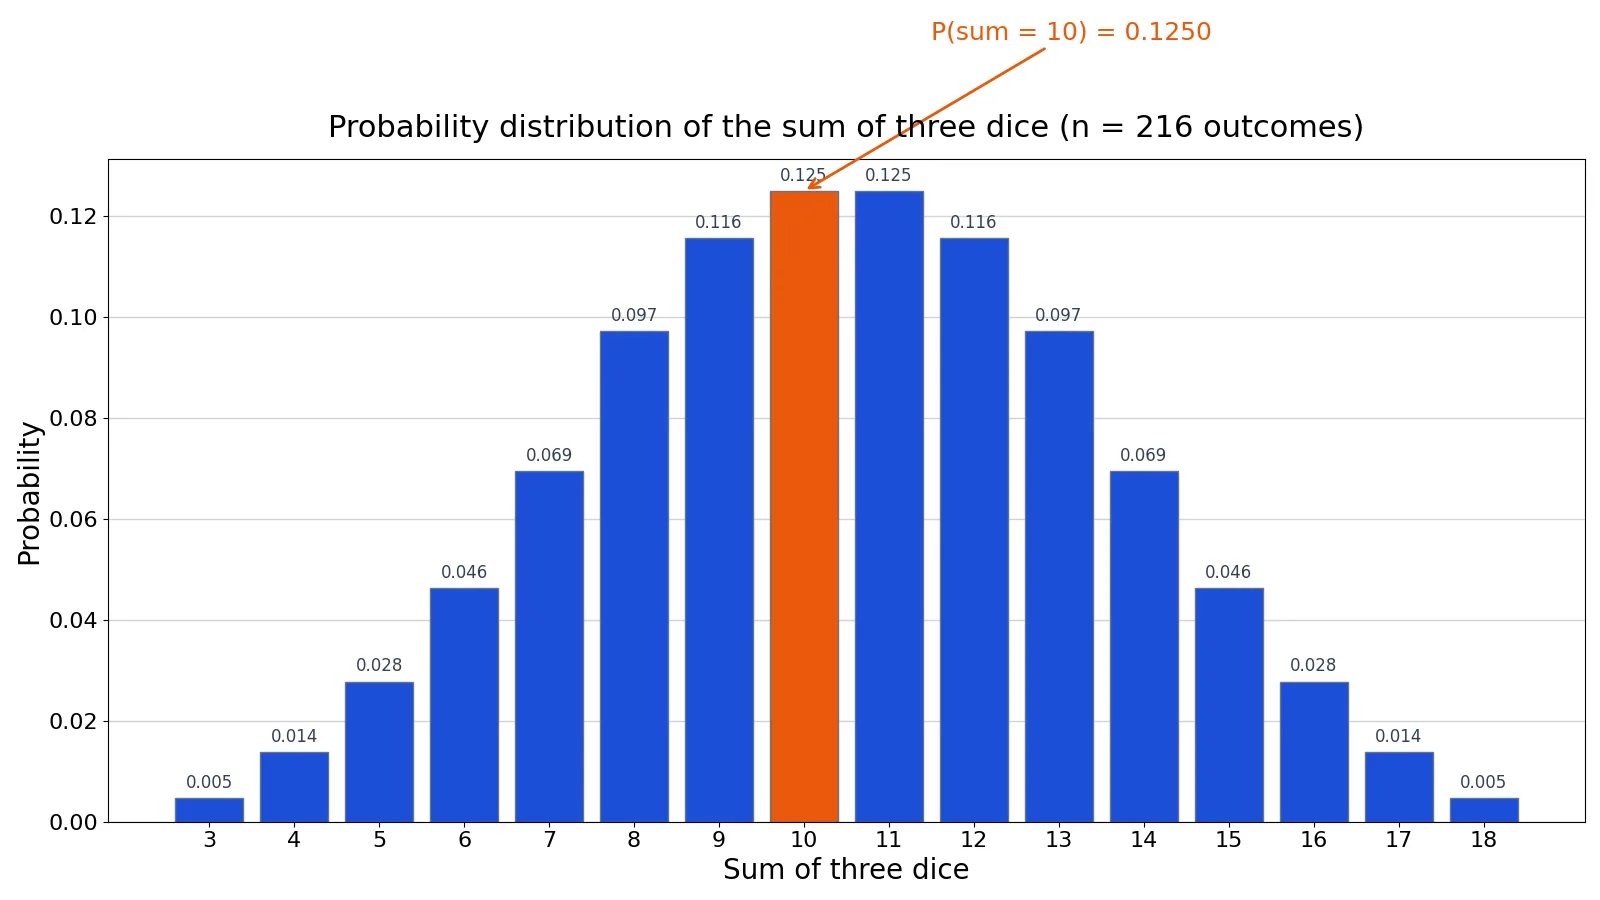
Rolling 3 dice produces 216 equally likely ordered outcomes, because each die has 6 faces and the rolls are independent. That sample space is the foundation for every probability question about three dice, from "what is the chance the sum is 10?" to "how often do all three dice match?" This article builds the sample space, counts favorable outcomes, and works through a full example with real recorded rolls.
Quick Answer
- Three fair six-sided dice give $6 \times 6 \times 6 = 216$ equally likely ordered outcomes.
- The sum of 3 dice ranges from 3 to 18, and the distribution is symmetric around the mean of 10.5.
- The most likely sums are 10 and 11, each with 27 favorable outcomes and probability $27/216 = 0.1250$.
- The expected sum is $3 \times 3.5 = 10.5000$, with variance $8.7500$ and standard deviation $2.9580$.
- Probabilities for a sum are counts divided by 216, so every answer is a fraction with denominator 216.
What 3 Dice Probability Means
In plain terms, 3 dice probability is the chance of a particular result when you roll three six-sided dice at once. The result might be a specific sum, a specific combination like three sixes, or a condition such as "at least two dice match."
The precise statistical definition: the experiment is rolling three fair, six-sided dice. Each die is independent, and each face has probability $1/6$. The sample space is the set of all ordered triples $(a, b, c)$ where each of $a$, $b$, and $c$ is an integer from 1 to 6. Because the dice are fair and independent, all 216 triples are equally likely, so the probability of any event $A$ is
$$P(A) = \frac{\text{number of outcomes in } A}{216}$$
This is the discrete uniform model. OpenStax frames the same experiment as a discrete distribution where you bet on a number appearing and count matches across three dice [1].
How It Works
The counting mechanism rests on two rules.
Multiplication rule for the sample space. Each die contributes 6 independent choices, so the total number of ordered outcomes is $6 \times 6 \times 6 = 216$. Order matters here: $(1, 2, 3)$, $(3, 2, 1)$, and $(2, 1, 3)$ are three distinct outcomes even though they show the same three numbers.
Counting favorable outcomes. For a target sum $s$, you count the integer triples with $a + b + c = s$ and $1 \le a, b, c \le 6$. One clean way is to fix the first two dice and solve for the third: for each pair $(a, b)$, the third die must be $c = s - a - b$, and it counts only if $1 \le c \le 6$. The generating-function approach gives the same counts, since the number of ways to obtain a total is the coefficient of $x^s$ in $(x + x^2 + x^3 + x^4 + x^5 + x^6)^3$ [2].
Here is each symbol in the probability formula:
| Symbol | Meaning |
|---|---|
| $A$ | The event you care about, such as "sum equals 10" |
| $P(A)$ | Probability the event occurs, between 0 and 1 |
| Numerator | Count of ordered triples satisfying the event |
| 216 | Total ordered triples in the sample space |
For the mean and spread of the sum $X$:
$$E[X] = n\mu = 3 \times 3.5 = 10.5$$
$$\text{Var}(X) = n\sigma^2 = 3 \times \frac{35}{12} = 8.75$$
$$\text{SD}(X) = \sqrt{8.75} = 2.9580$$
where $n = 3$ is the number of dice, $\mu = 3.5$ is the mean of one fair die, and $\sigma^2 = 35/12$ is the variance of one fair die. The variance of a sum of independent variables adds, which is why you multiply by 3.
Worked Example
The dataset is a lab dice-tray trial: twelve recorded rolls of three fair six-sided dice, one row per roll.
| die1 | die2 | die3 |
|---|---|---|
| 1 | 1 | 1 |
| 1 | 2 | 3 |
| 2 | 2 | 2 |
| 3 | 3 | 3 |
| 4 | 4 | 4 |
| 5 | 5 | 5 |
| 6 | 6 | 6 |
| 1 | 6 | 6 |
| 2 | 5 | 5 |
| 3 | 4 | 4 |
| 1 | 2 | 6 |
| 2 | 3 | 5 |
These twelve rolls are a small empirical sample. The theoretical results below come from enumerating the full sample space, not from these twelve rows.
Step 1: Size the sample space. Each die has 6 faces, so the ordered outcomes number $6 \times 6 \times 6 = 216$.
Step 2: Count favorable outcomes for a sum of 10. Enumerating every triple with $a + b + c = 10$ gives 27 outcomes.
Step 3: Compute the probability. $P(\text{sum} = 10) = 27 / 216 = 0.1250$, or 12.5%.
Step 4: Check the complement. $1 - 0.1250 = 0.8750$, so there is an 87.5% chance the sum is not 10.
Step 5: Compute the mean. $E[X] = 3 \times 3.5 = 10.5000$.
Step 6: Compute the variance. $\text{Var}(X) = 3 \times (35/12) = 8.7500$.
Step 7: Compute the standard deviation. $\sqrt{8.7500} = 2.9580$.
Step 8: Find the most likely sums. The maximum count is 27, reached at sums 10 and 11. Both are tied as the modal outcomes.
The full count and probability table for every sum:
| Sum | Count | Probability |
|---|---|---|
| 3 | 1 | 0.0046 |
| 4 | 3 | 0.0139 |
| 5 | 6 | 0.0278 |
| 6 | 10 | 0.0463 |
| 7 | 15 | 0.0694 |
| 8 | 21 | 0.0972 |
| 9 | 25 | 0.1157 |
| 10 | 27 | 0.1250 |
| 11 | 27 | 0.1250 |
| 12 | 25 | 0.1157 |
| 13 | 21 | 0.0972 |
| 14 | 15 | 0.0694 |
| 15 | 10 | 0.0463 |
| 16 | 6 | 0.0278 |
| 17 | 3 | 0.0139 |
| 18 | 1 | 0.0046 |
The table is symmetric: sum 3 and sum 18 each have 1 outcome, sum 4 and sum 17 each have 3, and so on. This symmetry follows from mapping each die value $v$ to $7 - v$.
Here is the enumeration in Python:
import itertools
space = list(itertools.product(range(1,7), repeat=3))
fav = [t for t in space if sum(t) == 10]
print(len(fav), len(space), f"{len(fav)/len(space):.4f}")  # 27 216 0.1250
Output:
27 216 0.1250You can reproduce the same counts by hand or with a probability calculator if you want to test other sums or conditions.
How to Interpret It
A probability of 0.1250 for a sum of 10 means that in a long run of rolls, about 12.5% of them should total 10. It does not predict any single roll. Over 1,000 rolls you would expect roughly 125 tens, but the observed count will vary around that figure.
The distribution shape matters too. Sums near the middle (9 through 12) carry most of the probability mass, while extreme sums (3, 4, 17, 18) are rare. This is the beginning of the bell shape that appears as you add more dice, and the CRC reference notes that the total-sum distribution approaches a Gaussian as the number of dice grows [2].
If you compare the twelve recorded rolls against theory, remember that twelve rolls is far too few to confirm a distribution. The empirical relative frequency of a sum in twelve rolls can easily differ from 0.1250 by chance. That gap between observed and theoretical frequency is exactly what experimental probability studies examine.
When to Use It (and when not to)
Use this framework when:
- The dice are fair and six-sided, so each face has probability $1/6$.
- Rolls are independent, meaning one die's result does not affect another's.
- You need exact probabilities for sums, matches, or specific combinations.
- You are building a discrete distribution table for a game or simulation.
Do not use it when:
- The dice are loaded or biased. Then you need estimated face probabilities from data, not the uniform model.
- Dice have a different number of sides. The sample space becomes $k^3$ for $k$-sided dice.
- You are modeling a process where rolls are not independent, such as drawing cards without replacement.
- You need long-run behavior from a tiny sample. Twelve rolls cannot validate a 216-outcome model.
3 Dice vs 2 Dice
The closest related idea is the two-dice sample space, which is smaller and has a different shape.
| Feature | 2 dice | 3 dice |
|---|---|---|
| Sample space size | 36 | 216 |
| Sum range | 2 to 12 | 3 to 18 |
| Most likely sum | 7 | 10 and 11 (tied) |
| Peak count | 6 | 27 |
| Peak probability | 6/36 = 0.1667 | 27/216 = 0.1250 |
| Mean sum | 7.0 | 10.5 |
| SD of sum | 2.4152 | 2.9580 |
Two dice peak at a single sum. Three dice peak at two adjacent sums because the mean of 10.5 falls between 10 and 11. The peak probability also drops as you add dice, since the total probability spreads across more possible sums.
Common Mistakes
- Treating combinations as equally likely. The outcome $(1, 1, 2)$ is not one of 56 equally likely combinations. Ordered triples are equally likely, and $(1, 1, 2)$ covers 3 of the 216 outcomes. Fix: always count ordered outcomes.
- Forgetting that order matters. If you count only unordered sets, your denominator is wrong. Fix: keep the denominator at 216 and count ordered triples.
- Assuming the most likely sum is the mean. The mean is 10.5, which is not a possible sum. Fix: report 10 and 11 as the tied modes.
- Using the wrong denominator for a conditional question. "Given the first die is 6, what is the chance the sum is 12?" has a sample space of 36, not 216. Fix: shrink the sample space to match the condition, as in conditional probability.
- Confusing "at least one 6" with "exactly one 6." These have different counts. Fix: define the event precisely before counting.
- Trusting a small empirical sample. Twelve rolls cannot confirm a theoretical probability. Fix: use the enumeration for theory and treat small samples as noisy.
Limitations
The uniform model assumes fair, independent dice. Real dice can have manufacturing bias, wear, or throwing patterns that shift face probabilities, and the model cannot detect that from theory alone. You would need many recorded rolls and a goodness-of-fit test to check fairness.
The enumeration approach also scales poorly by hand. With three dice there are 216 outcomes, which is manageable. With ten dice the sample space is over 60 million, so you switch to generating functions, dynamic programming, or simulation. The exact counting method is best for small numbers of dice and for teaching the logic behind the probabilities.
Frequently Asked Questions
How many outcomes are there when rolling 3 dice?
There are 216 ordered outcomes, because each of the three dice has 6 possible faces and $6 \times 6 \times 6 = 216$. Each outcome is equally likely when the dice are fair. Order matters, so $(1, 2, 3)$ and $(3, 2, 1)$ count as two separate outcomes.
What is the probability of rolling a sum of 10 with 3 dice?
The probability is $27/216 = 0.1250$, or 12.5%. There are 27 ordered triples that sum to 10. This ties with a sum of 11 as the most likely result.
What sum is most likely when rolling 3 dice?
Sums 10 and 11 are tied as the most likely, each with 27 favorable outcomes and probability 0.1250. The distribution is symmetric around the mean of 10.5, which is why the two central sums share the peak.
What is the average sum of 3 dice?
The expected sum is 10.5, computed as $3 \times 3.5$. The variance is 8.75 and the standard deviation is about 2.9580. The mean is not itself a possible sum, since sums are whole numbers.
Can I use the same method for loaded dice?
Not directly. The 216-outcome uniform model requires each face to have probability $1/6$. With loaded dice you would estimate each face's probability from data and weight the outcomes accordingly, which changes every probability in the table.
References
- 4.8 Discrete Distribution (Dice Experiment Using Three Regular Dice) - Introductory Statistics 2e | OpenStax
- Dice
Further Reading
- NIST/SEMATECH e-Handbook of Statistical Methods
- OpenStax. Introductory Statistics 2e
- Krzywinski M, Altman N (2013). Importance of being uncertain. Nature Methods
- Krzywinski M, Altman N (2013). Significance, P values and t-tests. Nature Methods
Related Articles
- Probability of A Given B: Conditional Probability Formula and Examples
- Third Variable Problem: Definition and Examples
- Binomial Distribution: Formula, Mean and Examples
- Geometric Distribution: Formula and Examples
- Simple Random Sampling: Definition, Steps and Examples
- Experimental Probability
- Designing Experiments with Limited Sample Sizes
- Sample Size Formulas for Common Experimental Designs