How to Calculate the Resolution of a Light Microscope
By Dr. Zubair Khalid, DVM, MS, PhD ·
Key Takeaways
- The resolution of a light microscope, defined as the minimum distinguishable distance between two points, is fundamentally limited by the diffraction of light and is calculated using either the Abbe diffraction limit (d = λ / (2 × NA)) or the Rayleigh criterion (d = 0.61 × λ / NA).
- Key parameters influencing resolution are the wavelength of light (λ) and the numerical aperture (NA) of the objective lens; shorter wavelengths and higher NAs yield better resolution, with typical values for conventional light microscopy ranging from 200–350 nm.
- Numerical aperture (NA) is determined by the refractive index of the immersion medium (n) and the angular aperture of the objective (θ), with oil immersion (n ≈ 1.51) typically providing the highest NA (up to 1.5) for optimal resolution compared to air (n = 1.00) or water (n = 1.33).
- Practical resolution is influenced by factors beyond theoretical calculation, including optical aberrations, sample scattering, detector pixel size (requiring Nyquist sampling), and contrast, necessitating experimental verification using fluorescent beads or calibration gratings.
- Super-resolution techniques like expansion microscopy (ExM) and STORM can achieve effective resolutions significantly below the diffraction limit (~60 nm and ~20 nm, respectively) by manipulating the optical path or localization precision, respectively.
The resolution of a light microscope is the smallest distance between two points at which they can be distinguished as separate objects, calculated using the formula d = λ / (2 × NA) for the Abbe diffraction limit or d = 0.61 × λ / NA for the Rayleigh criterion, where λ is the wavelength of light and NA is the numerical aperture of the objective lens. This calculation is essential for determining whether a microscope can resolve the fine details needed for a given experiment, such as distinguishing bacterial cells, subcellular organelles, or fluorescently labeled structures. By knowing the theoretical resolution limit, researchers can select appropriate objectives, immersion media, and fluorophores to match their imaging goals, and they can critically evaluate whether observed features are genuine or artifacts of diffraction.
At a Glance
| Parameter | Description |
|---|---|
| Purpose | Calculate the smallest resolvable distance between two points in a light microscope image |
| Key Formula (Rayleigh) | d = 0.61 × λ / NA |
| Key Formula (Abbe) | d = λ / (2 × NA) |
| Variables | λ = wavelength of light (nm); NA = numerical aperture of objective |
| Typical Range | 200–350 nm for conventional light microscopy; ~60 nm with expansion microscopy [<a href="#ref-1">1</a>] |
| Common Application | Selecting objectives, evaluating image quality, planning super-resolution experiments |
| Limitation | Theoretical value; actual resolution depends on sample, optics alignment, and detector |
The Scientific Principle: Why Light Has a Resolution Limit
Light microscopy is fundamentally constrained by the wave nature of light. When light passes through a lens, it diffracts, causing a point source of light to appear as a blurred spot called an Airy disk rather than an infinitely small point. The Airy disk has a central bright region surrounded by concentric rings of decreasing intensity. Two point sources can be distinguished only if their Airy disks do not overlap too extensively.
The diffraction limit was first described by Ernst Abbe in 1873, who established that the resolution of a microscope is limited by the wavelength of light and the angular aperture of the objective. This principle is why conventional light microscopy cannot resolve structures smaller than approximately half the wavelength of light, typically around 200–350 nm for visible light. As noted in the ROOT-ExM protocol, "conventional light microscopy is limited in resolution by the diffraction limit of light, restricting the visualization of the nanoscale organization of biomolecules" [<a href="#ref-1">1</a>]. This limitation has driven the development of super-resolution techniques such as expansion microscopy (ExM) and stochastic optical reconstruction microscopy (STORM), which achieve effective resolutions of ~60 nm and ~20 nm, respectively [<a href="#ref-1">1</a>, <a href="#ref-2">2</a>].
The Rayleigh Criterion
The most commonly used formula for calculating microscope resolution is the Rayleigh criterion:
d = 0.61 × λ / NA
Where:
- d = the minimum resolvable distance (in the same units as λ)
- λ = the wavelength of light used for imaging (typically in nanometers)
- NA = the numerical aperture of the objective lens
- 0.61 = a constant derived from the first minimum of the Airy disk intensity distribution
The Rayleigh criterion states that two point sources are resolved when the center of one Airy disk falls on the first minimum of the other. This corresponds to a ~26% intensity dip between the two peaks, which is generally detectable by the human eye or a camera.
The Abbe Diffraction Limit
An alternative formulation, the Abbe diffraction limit, is often used for describing the resolution of periodic structures such as grating lines:
d = λ / (2 × NA)
The Abbe formula gives a slightly larger resolution value (i.e., less optimistic) than the Rayleigh criterion for the same NA and wavelength. For example, with λ = 550 nm and NA = 1.4, the Rayleigh criterion gives d = 0.61 × 550 / 1.4 ≈ 240 nm, while the Abbe formula gives d = 550 / (2 × 1.4) ≈ 196 nm. The choice between formulas depends on the imaging context: the Rayleigh criterion is standard for point-like objects (e.g., fluorescent beads, single molecules), while the Abbe limit is more appropriate for periodic structures (e.g., grating lines, striated muscle fibers).
Materials and Instrumentation Choices
Wavelength (λ)
The wavelength of light used for imaging directly affects resolution. Shorter wavelengths yield better resolution because they diffract less. Common choices include:
- Blue light (450–495 nm): Provides the best resolution for visible light microscopy but may cause more photobleaching and phototoxicity in live samples.
- Green light (495–570 nm): A common compromise between resolution and sample compatibility.
- Red light (620–750 nm): Penetrates deeper into tissue but gives poorer resolution.
- UV light (below 400 nm): Offers the best theoretical resolution but requires quartz optics and specialized objectives, and can damage biological samples.
For fluorescence microscopy, the emission wavelength of the fluorophore is used in the resolution calculation, not the excitation wavelength. For example, imaging with Alexa Fluor 488 (emission maximum ~520 nm) will give better resolution than imaging with Alexa Fluor 647 (emission maximum ~670 nm) under the same objective.
Numerical Aperture (NA)
The numerical aperture is the most critical factor in determining resolution because it appears in the denominator of both formulas. NA is defined as:
NA = n × sin(θ)
Where:
- n = the refractive index of the medium between the specimen and the objective lens
- θ = half the angular aperture of the objective (the maximum angle at which light can enter the lens)
Higher NA values allow the objective to collect more diffracted light, improving resolution. NA is determined by the objective design and the immersion medium:
| Immersion Medium | Refractive Index (n) | Typical Maximum NA |
|---|---|---|
| Air | 1.00 | 0.95 |
| Water | 1.33 | 1.2 |
| Glycerol | 1.47 | 1.3 |
| Oil | 1.51 | 1.4–1.5 |
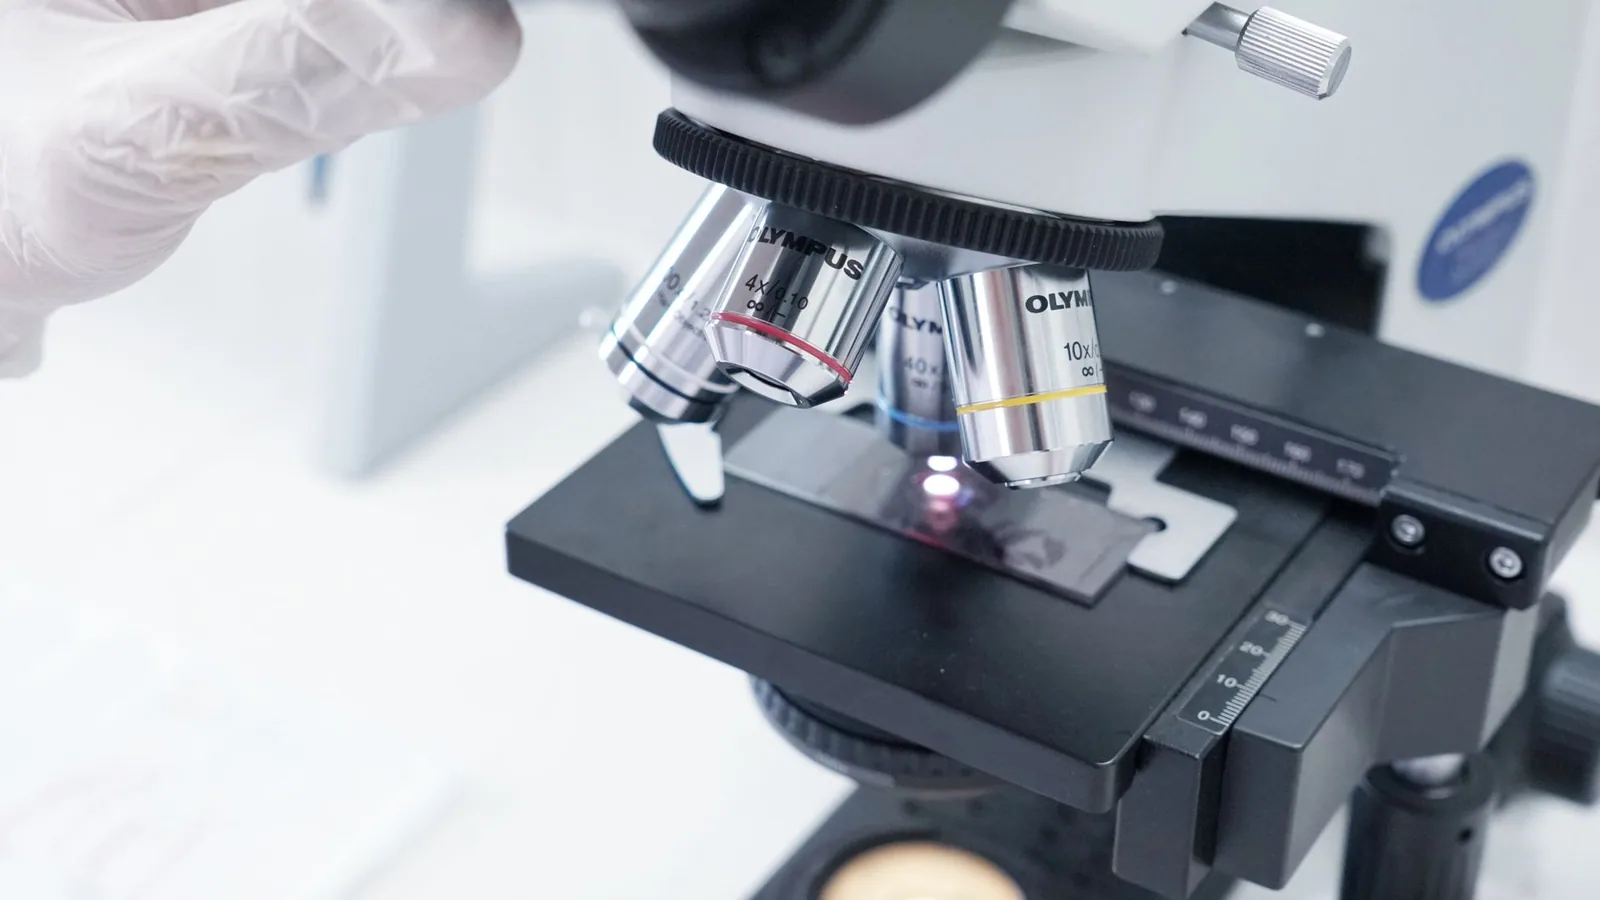
The NA is always printed on the objective barrel. For example, a "60×/1.2NA water immersion objective" has an NA of 1.2 [<a href="#ref-3">3</a>]. Using an immersion medium with a refractive index matching the objective's design is essential; using air with an oil-immersion objective will drastically reduce NA and resolution.
Objective Selection
When selecting an objective for a resolution-critical application, consider:
- NA value: Higher NA always gives better resolution, but higher NA objectives typically have shorter working distances and are more expensive.
- Immersion medium: Oil-immersion objectives (NA up to 1.5) provide the best resolution for fixed, mounted samples. Water-immersion objectives (NA up to 1.2) are preferred for live-cell imaging to maintain physiological conditions.
- Correction for coverslip thickness: Many high-NA objectives are designed for #1.5 coverslips (0.17 mm thickness). Using incorrect coverslip thickness introduces spherical aberration that degrades resolution.
Detector Considerations
The detector (camera or photomultiplier tube) must have a pixel size appropriate for the resolution of the optical system. The Nyquist sampling theorem requires that the pixel size be at least half the resolution limit to avoid undersampling. For example, if the theoretical resolution is 200 nm, the pixel size in the image plane should be ≤100 nm. This is achieved by selecting a camera with small pixels or by using additional magnification (e.g., a 1.5× or 2× tube lens) to match the pixel size to the optical resolution.
Controls and Calibration
Positive Control: Fluorescent Beads
To verify that your microscope achieves its theoretical resolution, image sub-resolution fluorescent beads (e.g., 100 nm diameter beads) and measure the full width at half maximum (FWHM) of their point spread function (PSF). The measured FWHM should be close to the theoretical resolution calculated from the Rayleigh criterion. For example, in dual-view oblique plane microscopy, "the median bead FWHM for 100 nm diameter fluorescent beads in x, y, and z" was measured to validate system performance [<a href="#ref-3">3</a>].
Negative Control: Known Unresolvable Features
Image a sample with features smaller than the theoretical resolution limit (e.g., 50 nm beads with a 1.4 NA objective). These should appear as diffraction-limited spots with no internal structure. If they appear resolved, there may be an artifact or the resolution calculation may be incorrect.
Calibration Standard: Grating Slide
A calibration grating with known line spacing (e.g., 200 lines/mm, giving 5 μm spacing) can verify that the microscope is correctly calibrated for magnification and that the resolution calculation is consistent with observed performance.
Conceptual Workflow for Calculating Resolution
Step 1: Identify the Wavelength
Determine the wavelength of light used for imaging. For brightfield microscopy, use the peak wavelength of the illumination (e.g., 550 nm for white light with a green filter). For fluorescence microscopy, use the emission maximum of the fluorophore.
Example: Imaging with DAPI (emission ~460 nm) or Alexa Fluor 488 (emission ~520 nm).
Step 2: Determine the Numerical Aperture
Read the NA directly from the objective barrel. If the NA is not printed, it can sometimes be found in the manufacturer's specifications. For example, a "60×/1.2NA" objective has NA = 1.2 [<a href="#ref-3">3</a>].
Step 3: Choose the Appropriate Formula
- Use the Rayleigh criterion (d = 0.61 × λ / NA) for point-like objects, fluorescent beads, and general imaging of cellular structures.
- Use the Abbe formula (d = λ / (2 × NA)) for periodic structures or when comparing with the theoretical diffraction limit of the optical system.
Step 4: Perform the Calculation
Example 1: 100× oil-immersion objective (NA = 1.4), imaging with green light (λ = 550 nm)
Rayleigh criterion: d = 0.61 × 550 nm / 1.4 = 239.6 nm ≈ 240 nm
This means two points can be distinguished if they are at least 240 nm apart.
Example 2: 40× dry objective (NA = 0.75), imaging with blue light (λ = 470 nm)
Rayleigh criterion: d = 0.61 × 470 nm / 0.75 = 382.3 nm ≈ 382 nm
Example 3: 60× water-immersion objective (NA = 1.2), imaging with red light (λ = 640 nm)
Rayleigh criterion: d = 0.61 × 640 nm / 1.2 = 325.3 nm ≈ 325 nm
Step 5: Interpret the Result
The calculated resolution is the theoretical best-case scenario. Actual resolution may be worse due to:
- Optical aberrations (spherical, chromatic)
- Misalignment of the microscope
- Refractive index mismatch between immersion medium and sample
- Sample thickness and scattering
- Detector noise and pixel size
If the calculated resolution is insufficient for your application (e.g., you need to resolve 100 nm structures), consider:
- Using a higher NA objective
- Using a shorter wavelength fluorophore
- Employing super-resolution techniques such as expansion microscopy or STORM [<a href="#ref-1">1</a>, <a href="#ref-2">2</a>]
Quality Checks
Verify the NA Value
Always confirm the NA printed on the objective. Some objectives have adjustable NA (e.g., with an iris diaphragm), and the NA must be set to the maximum value for best resolution.
Check Immersion Medium
Ensure the correct immersion medium is used. Using oil with a water-immersion objective (or vice versa) will degrade resolution and may damage the objective. The refractive index mismatch introduces spherical aberration that broadens the PSF.
Measure the Point Spread Function
For critical applications, experimentally measure the PSF using sub-resolution fluorescent beads. The FWHM of the PSF should be within ~20% of the theoretical resolution. If the measured FWHM is significantly larger, investigate potential causes such as:
- Incorrect immersion medium
- Dirty optics
- Thermal drift during acquisition
- Incorrect coverslip thickness
Test with a Known Sample
Image a sample with known feature sizes (e.g., a calibration grating or a sample with well-characterized structures) to verify that the calculated resolution matches observed performance.
Result Interpretation
What the Resolution Value Tells You
The calculated resolution is the minimum distance at which two point-like objects can be distinguished as separate. Features smaller than this distance will appear blurred together. For example, if the resolution is 250 nm, two fluorescent proteins that are 100 nm apart will appear as a single spot.
Resolution vs. Magnification
Resolution and magnification are often confused. Magnification makes small features appear larger, but it does not improve resolution. If the resolution is 250 nm, magnifying the image 1000× will still show blurry features at the 250 nm scale. The goal is to match magnification to resolution: too little magnification undersamples the image, while too much magnification (empty magnification) only enlarges blur.
Resolution in Different Dimensions
Most resolution calculations assume lateral (x-y) resolution. Axial (z) resolution is typically 2–3 times worse than lateral resolution. For example, in dual-view oblique plane microscopy, the measured FWHM in x and y was 0.29–0.31 μm, while the axial FWHM was 0.83 μm [<a href="#ref-3">3</a>]. Axial resolution depends on the same factors (λ and NA) but also on the depth of field of the objective.
Effective Resolution with Super-Resolution Techniques
Super-resolution techniques can achieve effective resolutions beyond the diffraction limit. Expansion microscopy physically expands the sample, achieving "an effective lateral resolution of ~60 nm using a standard confocal microscope" [<a href="#ref-1">1</a>]. STORM achieves "localization precision of up to ~20 nm" by precisely localizing individual fluorophores [<a href="#ref-2">2</a>]. In these cases, the effective resolution is calculated differently: for expansion microscopy, the resolution is the diffraction-limited resolution divided by the expansion factor; for STORM, the resolution is determined by localization precision rather than the diffraction limit.
Troubleshooting
| Observation | Likely Cause | Discriminating Check |
|---|---|---|
| Measured PSF FWHM much larger than calculated resolution | Incorrect immersion medium | Check that immersion oil/water matches objective specification; clean objective front lens |
| Measured PSF FWHM slightly larger than calculated resolution | Spherical aberration from coverslip thickness mismatch | Verify coverslip thickness (#1.5 = 0.17 mm); adjust correction collar if available |
| Image appears blurry despite correct resolution calculation | Sample too thick or scattering | Reduce sample thickness; use mounting medium with matching refractive index |
| Resolution varies across the field of view | Field curvature or off-axis aberrations | Center the region of interest; use flat-field correction |
| Calculated resolution seems too good (too small) | Using excitation wavelength instead of emission wavelength for fluorescence | Confirm you are using the emission maximum, not the excitation wavelength |
| Features smaller than resolution appear resolved | Artifact from noise or processing | Check raw data; verify with known control sample |
| Resolution changes with focus position | Thermal drift or mechanical instability | Allow system to equilibrate; use autofocus if available |
Limitations
Theoretical vs. Practical Resolution
The calculated resolution is a theoretical maximum that assumes perfect optics, aberration-free conditions, and optimal sample preparation. In practice, resolution is often 20–50% worse due to:
- Optical aberrations: Spherical aberration from refractive index mismatch, chromatic aberration from using multiple wavelengths
- Sample properties: Scattering, absorption, and autofluorescence degrade the signal-to-noise ratio, making it harder to distinguish two closely spaced points
- Detector limitations: Pixel size, noise, and dynamic range affect the ability to record fine details
- Mechanical stability: Vibration, thermal drift, and stage movement during acquisition blur the image
Resolution vs. Contrast
Resolution is meaningless without sufficient contrast. Even if the optical system can theoretically resolve 200 nm features, those features must have sufficient contrast against the background to be detected. For fluorescence microscopy, this means adequate labeling density and brightness. For brightfield microscopy, this means sufficient absorption or phase differences.
The Resolution of Live-Cell Imaging
Live-cell imaging often requires compromises that reduce resolution:
- Lower light levels to avoid phototoxicity
- Faster acquisition speeds that increase noise
- Water-immersion objectives (lower NA than oil immersion) to maintain physiological conditions
- Thicker samples (cells in culture or tissue) that scatter light
Wavelength Dependence in Multicolor Imaging
When imaging multiple fluorophores, each color has a different resolution. For example, imaging DAPI (λ = 460 nm) and Alexa Fluor 647 (λ = 670 nm) with a 1.4 NA objective gives resolutions of ~200 nm and ~292 nm, respectively. The blue channel will resolve finer details than the red channel.
Documentation
What to Record
For reproducibility and quality assurance, document the following for each imaging session:
- Microscope model and objective: Manufacturer, magnification, NA, immersion medium
- Wavelength(s): Excitation and emission wavelengths for each channel
- Calculated resolution: Show the formula and calculation for each channel
- Measured resolution: PSF FWHM from bead calibration, if performed
- Sample details: Mounting medium, coverslip thickness, sample thickness
- Detector settings: Camera model, pixel size, binning, gain
Example Documentation Entry
Date: 2025-01-15
Microscope: Nikon Ti2-E
Objective: CFI Plan Apo Lambda 100× Oil, NA 1.45
Immersion: Nikon Type F oil (n = 1.515)
Wavelength: Alexa Fluor 488, emission 520 nm
Theoretical resolution (Rayleigh): d = 0.61 × 520 nm / 1.45 = 218.6 nm
Measured PSF FWHM (100 nm beads): 245 nm
Coverslip: #1.5 (0.17 mm)
Camera: Hamamatsu Orca Fusion BT, pixel size 6.5 μm
Effective pixel size in sample: 6.5 μm / 100 = 65 nm (Nyquist adequate)
Biosafety Considerations
While calculating microscope resolution is a purely conceptual activity with no direct biosafety implications, the samples being imaged may require biosafety precautions. For routine teaching laboratory work with BSL-1 organisms (e.g., non-pathogenic E. coli strains, yeast, or plant tissues), standard microbiological practices apply as outlined in the Biosafety in Microbiological and Biomedical Laboratories (BMBL) 6th Edition [<a href="#ref-4">4</a>]. These include:
- Decontaminating the microscope stage and objectives after use with appropriate disinfectants
- Using coverslips and slides that are properly disposed of as biohazardous waste
- Wearing laboratory coats and gloves when handling biological samples
- Following institutional biosafety committee guidelines for any recombinant or synthetic nucleic acid work [<a href="#ref-5">5</a>]
For samples requiring higher containment (BSL-2 or above), consult your institutional biosafety officer and the BMBL guidelines before imaging [<a href="#ref-4">4</a>].
Frequently Asked Questions
1. Why do I get different resolution values from the Rayleigh and Abbe formulas?
The Rayleigh criterion (d = 0.61λ/NA) and Abbe formula (d = λ/2NA) use different definitions of resolution. The Rayleigh criterion is based on the ability to distinguish two point sources, while the Abbe formula describes the resolution of periodic structures. The Rayleigh criterion is more commonly used for biological imaging because most structures are not perfectly periodic. The Abbe formula gives a slightly smaller (better) resolution value, but both are valid in their respective contexts.
2. Can I improve resolution by using a shorter wavelength?
Yes, shorter wavelengths give better resolution because they diffract less. However, there are practical limits: UV light (below 400 nm) requires quartz optics and can damage biological samples, while blue light (450–495 nm) causes more photobleaching and phototoxicity than green or red light. For live-cell imaging, the compromise between resolution and sample health often favors green or red fluorophores.
3. Does increasing magnification improve resolution?
No, magnification does not improve resolution. Magnification makes small features appear larger, but it cannot reveal details smaller than the diffraction limit. If the resolution is 250 nm, magnifying the image 1000× will show a 250 nm blur enlarged to 250 μm, but the blur will still contain no finer detail. The goal is to match magnification to resolution so that the pixel size in the image plane is at least half the resolution (Nyquist sampling).
4. How does expansion microscopy achieve better resolution without changing the objective?
Expansion microscopy physically expands the sample by embedding it in a swellable hydrogel and then expanding the gel. The expansion factor (e.g., 4.3× in the ROOT-ExM protocol) increases the physical distance between features while preserving their relative spatial relationships [<a href="#ref-1">1</a>]. After expansion, the same diffraction-limited microscope can resolve features that were originally below the resolution limit. The effective resolution is the diffraction-limited resolution divided by the expansion factor. For example, with a confocal microscope resolution of ~250 nm and a 4.3× expansion factor, the effective resolution becomes ~60 nm [<a href="#ref-1">1</a>].
Related Clinical & Scientific Guides
- Loop-Mediated Isothermal Amplification (LAMP) Assay for Rapid Detection of African Swine Fever Virus in Oral Fluids
- How to Calculate the Concentration of Protein Using the Lowry Assay
- DNA Extraction from Saliva: Non-Invasive Sampling and Protocols
References and Further Reading
[1] [ROOT-ExM: Super-Resolution Imaging of Proteins in Arabidopsis Roots by Expansion Microscopy](https://pubmed.ncbi.nlm.nih.gov/42305134/) [2] [Accessible STORM Imaging: An Optimized Workflow for Conventional Widefield Epifluorescence/TIRF Setups](https://pubmed.ncbi.nlm.nih.gov/42158021/) [3] [High content 3D imaging by dual-view oblique plane microscopy](https://pubmed.ncbi.nlm.nih.gov/41356843/) [4] [Biosafety in Microbiological and Biomedical Laboratories (BMBL), 6th Edition](https://www.cdc.gov/labs/bmbl/index.html) [5] [NIH Guidelines for Research Involving Recombinant or Synthetic Nucleic Acid Molecules](https://osp.od.nih.gov/policies/biosafety-and-biosecurity-policy/nih-guidelines-for-research-involving-recombinant-or-synthetic-nucleic-acid-molecules/)Related Articles
- How to Calculate the Field of View on a Microscope
- How to Calculate the Magnification of a Microscope Image
- How to Calculate the Volume of a Bacterial Colony from Diameter
- How to Calculate Bacterial Colony-Forming Units (CFU) per mL
- How to Calculate the Limit of Detection for a qPCR Assay
- How to Calculate Cell Concentration Using a Hemocytometer