How to Calculate the Magnification of a Microscope Image
By Dr. Zubair Khalid, DVM, MS, PhD ·
Key Takeaways
- Total magnification of a microscope image is calculated by multiplying the magnification of the objective lens by the magnification of the eyepiece (ocular lens). Typical objective magnifications range from 4× to 100× (oil immersion), while common eyepiece magnifications are 10×.
- For digital imaging systems, additional magnification factors from camera adapters and digital zoom must be considered. Accurate quantitative analysis necessitates calibration of pixel size using a stage micrometer for each objective and camera combination.
- Magnification alone does not determine the ability to discern fine details; resolution, limited by the numerical aperture (NA) of the objective and the wavelength of light, is paramount. Maximum useful magnification is approximately 1000× NA, beyond which "empty magnification" occurs.
- Accurate reporting of microscopic observations requires the inclusion of a calibrated scale bar, which provides an absolute size reference independent of display magnification, alongside the total magnification value.
- Potential sources of error in magnification calculation and image interpretation include unacknowledged tube factors, geometric distortion, exceeding the maximum useful magnification, and using uncalibrated scale bars.
Calculating the magnification of a microscope image is the process of determining how many times larger an object appears when viewed through a microscope compared to its actual size. The total magnification is obtained by multiplying the magnification power of the objective lens by the magnification power of the eyepiece (ocular lens). This calculation is essential for accurately interpreting microscopic structures, reporting image dimensions in scientific publications, and calibrating measurement tools such as scale bars. Understanding magnification is fundamental for students, laboratory technicians, and early-career researchers who need to document and communicate their observations with precision.
At a Glance
| Aspect | Detail |
|---|---|
| Core Formula | Total Magnification = Objective Lens Magnification × Eyepiece Magnification |
| Typical Objective Magnifications | 4×, 10×, 20×, 40×, 60×, 100× (oil immersion) |
| Typical Eyepiece Magnifications | 10× (most common), 12.5×, 15×, 20× |
| Common Total Magnifications | 40× (4× objective), 100× (10× objective), 400× (40× objective), 1000× (100× objective with 10× eyepiece) |
| Additional Factors | Tube factor (if present), intermediate lens magnification, digital zoom (for camera systems) |
| Scale Bar Requirement | Essential for accurate image reporting; must be calibrated using a stage micrometer |
| Key Limitation | Magnification alone does not determine resolution; maximum useful magnification is limited by numerical aperture |
Scientific Principle of Microscope Magnification
Microscope magnification relies on the optical principle of combining two lens systems to enlarge the image of a specimen. The objective lens produces a magnified real image of the specimen, which is then further magnified by the eyepiece lens to produce a virtual image that the eye can view. The total magnification is the product of these two independent magnification factors.
The objective lens is the primary magnifying element. Its magnification power is engraved on the barrel (e.g., 10×, 40×, 100×). The eyepiece, also called the ocular lens, provides secondary magnification, typically 10× for standard laboratory microscopes. When using a 40× objective with a 10× eyepiece, the total magnification is 40 × 10 = 400×. This means the image appears 400 times larger than the actual specimen.
It is critical to understand that magnification is not the same as resolution. Resolution, the ability to distinguish two closely spaced points as separate, is determined by the numerical aperture (NA) of the objective lens and the wavelength of light used. The maximum useful magnification for a light microscope is approximately 1000× the NA of the objective. Beyond this point, further magnification produces "empty magnification," where the image becomes larger but no additional detail is resolved. As noted in the context of STORM imaging, localization precision can reach approximately 20 nm using specialized techniques, but conventional light microscopy is limited by the diffraction barrier [<a href="#ref-1">1</a>].
For digital imaging systems, additional magnification factors may apply. When a camera is attached to a microscope, the image sensor size, the camera adapter magnification, and the display monitor size all contribute to the final image magnification. In such cases, the total magnification must be calculated by considering the entire imaging chain, including any intermediate optics.
Materials and Instrumentation Choices
Microscope Components
The primary materials needed for calculating microscope magnification are the microscope itself and its documented specifications. Every microscope should have the following information readily available:
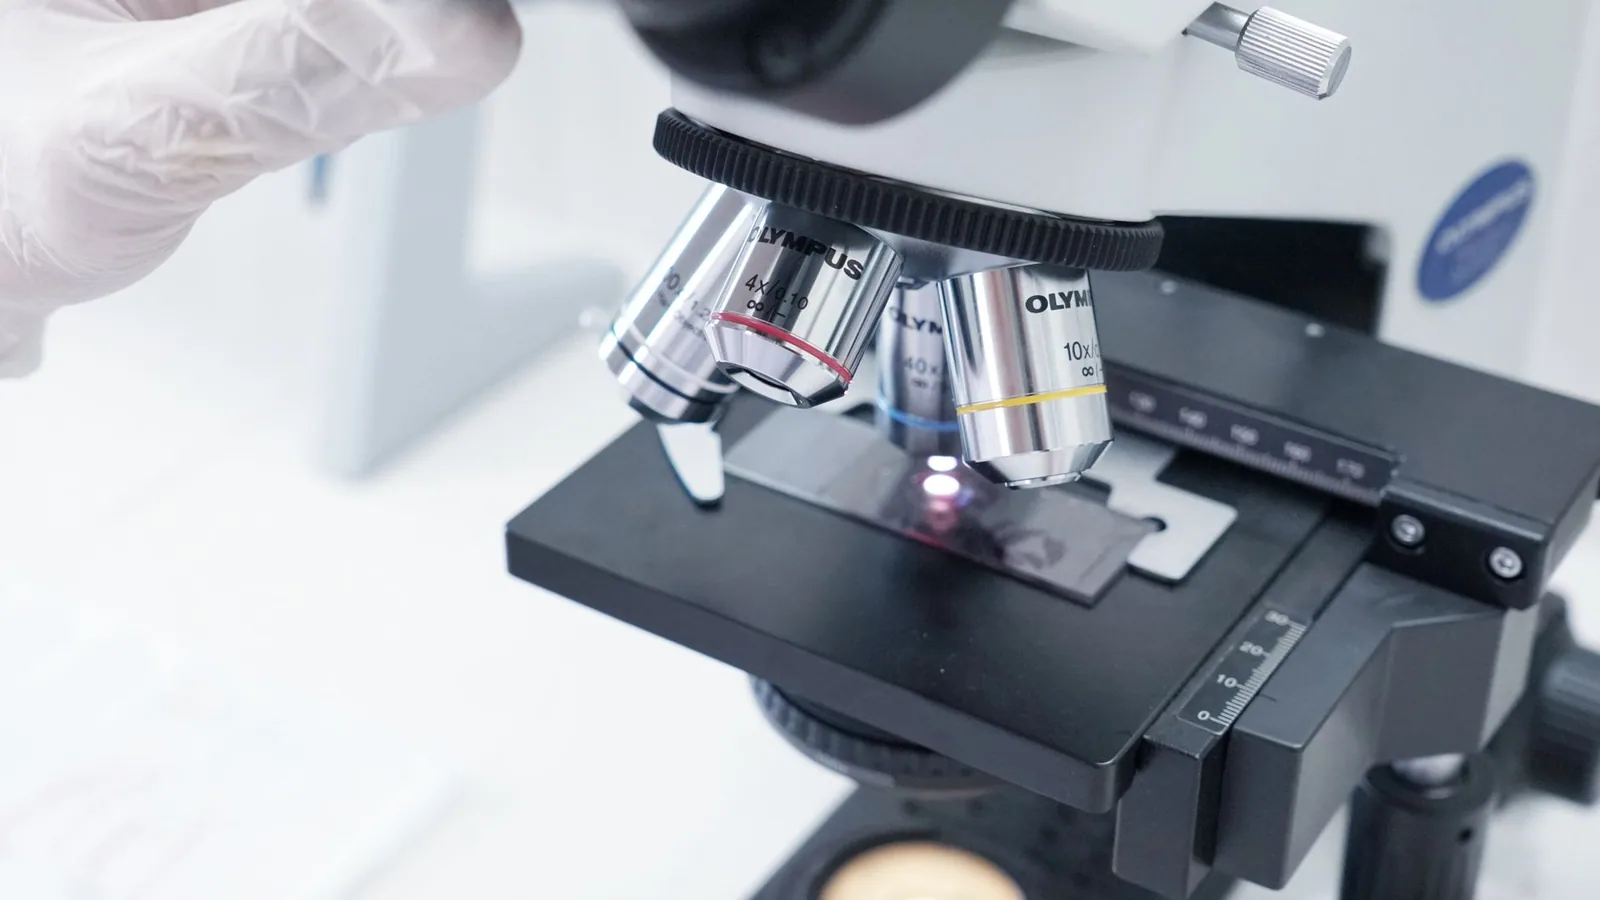
- Objective lenses: Each objective has its magnification and numerical aperture engraved on the side. Common magnifications include 4×, 10×, 20×, 40×, 60×, and 100×. The 100× objective is typically an oil-immersion lens requiring immersion oil between the lens and the coverslip.
- Eyepieces (oculars): The magnification is printed on the eyepiece barrel, usually 10×, but 12.5×, 15×, and 20× eyepieces are also available.
- Tube factor: Some microscopes, particularly research-grade or inverted models, have an additional magnification factor built into the optical tube. This is often 1× but can be 1.25×, 1.5×, or other values. Check the microscope manual.
- Intermediate lenses: Certain microscopy techniques (e.g., phase contrast, differential interference contrast) may include additional lens elements that affect magnification.
Calibration Tools
For accurate measurement and scale bar creation, a stage micrometer is essential. This is a microscope slide with an engraved scale, typically 1 mm or 2 mm long, divided into 100 or 200 divisions. Each division is 0.01 mm (10 μm). An ocular micrometer, which fits inside the eyepiece, can be used for direct measurements but must be calibrated against the stage micrometer for each objective.
Digital Imaging Considerations
When capturing digital images, additional factors influence the final magnification:
- Camera sensor size: The physical dimensions of the camera sensor affect the field of view and apparent magnification.
- C-mount adapter magnification: Adapters between the microscope and camera often have a magnification factor (e.g., 0.5×, 0.63×, 1×).
- Monitor display size: The final image on a computer monitor depends on the monitor's pixel density and resolution settings.
For quantitative image analysis, it is essential to calibrate the pixel-to-micrometer conversion for each objective and camera combination. This is typically done by imaging a stage micrometer and measuring the number of pixels per micrometer.
Controls and Calibration
Positive Controls
A positive control for magnification calculation involves using a stage micrometer with known dimensions. Image the micrometer at each objective magnification and verify that the measured distances match the expected values. For example, if the micrometer has 10 μm divisions, the distance between two marks should correspond to the expected number of pixels based on the calibrated pixel size.
Negative Controls
A negative control involves imaging a blank slide (no specimen) to ensure that no optical artifacts or dust particles are mistaken for specimen features. This also verifies that the imaging system is clean and properly focused.
Calibration Procedure
- Place the stage micrometer on the microscope stage.
- Focus on the micrometer scale using the lowest magnification objective.
- Adjust the illumination and contrast for clear visibility of the scale marks.
- Capture an image of the micrometer scale.
- Using image analysis software, measure the distance between two known scale marks (e.g., 100 μm apart).
- Record the number of pixels corresponding to this distance.
- Calculate the pixel size: Pixel size (μm/pixel) = Known distance (μm) / Number of pixels.
- Repeat for each objective magnification.
- For oil-immersion objectives, ensure proper oil contact and recalibrate if the oil type changes.
This calibration should be performed each time the microscope setup changes (e.g., new camera, different adapter, changed objective). As demonstrated in the context of endoscopic imaging, spatial-frequency conversion requires careful accounting of local magnification across the field of view, especially when geometric distortion is present [<a href="#ref-2">2</a>]. Similarly, for microscope images, calibration should be performed at the center of the field and, if distortion is suspected, at multiple positions across the field.
Conceptual Workflow for Calculating Magnification
Step 1: Identify Objective and Eyepiece Magnifications
Locate the magnification values on the objective lens and eyepiece. Record these values in your laboratory notebook. For example:
- Objective: 40×
- Eyepiece: 10×
- Tube factor: 1× (if applicable)
Step 2: Calculate Total Optical Magnification
Multiply the objective magnification by the eyepiece magnification, then multiply by any tube factor:
Total Optical Magnification = Objective × Eyepiece × Tube Factor
Example: 40 × 10 × 1 = 400×
Step 3: Account for Digital Imaging Factors (if applicable)
If using a camera system, determine the additional magnification from the camera adapter. The total digital magnification is:
Total Digital Magnification = Total Optical Magnification × Adapter Magnification
For example, with a 0.63× adapter: 400 × 0.63 = 252×
This value represents the magnification at the camera sensor. The final image on a monitor will have additional magnification based on the monitor size and resolution.
Step 4: Calibrate Pixel Size for Measurements
Using the stage micrometer image, calculate the pixel size for the specific objective and camera combination. This calibration is essential for adding accurate scale bars to images.
Step 5: Add Scale Bars to Images
Using image analysis software (e.g., ImageJ, Fiji, or proprietary microscope software), add a scale bar to the image. The scale bar should be placed in a consistent location (typically the lower right corner) and should include the length value (e.g., "10 μm") and the total magnification (e.g., "400×").
Step 6: Document All Parameters
Record the following information for each image:
- Microscope model and manufacturer
- Objective magnification and numerical aperture
- Eyepiece magnification
- Tube factor (if applicable)
- Camera model and adapter magnification
- Pixel size calibration value
- Total magnification (optical and digital)
- Date of calibration
Quality Checks
Verification of Magnification Accuracy
- Compare with known standards: Image a stage micrometer and verify that the measured distances match the expected values within ±5%.
- Check consistency across the field: Measure the same distance at the center and edges of the image. If significant variation exists, geometric distortion may be present, requiring field-specific calibration [<a href="#ref-2">2</a>].
- Validate with multiple objectives: Ensure that the total magnification calculated for each objective is consistent with the expected values.
Image Quality Assessment
- Check for proper focus: The image should be sharp, with clear edges and no blurring.
- Verify illumination uniformity: The background should be evenly illuminated without hot spots or shadows.
- Assess contrast: The specimen should be clearly distinguishable from the background.
- Check for artifacts: Dust, air bubbles, or lens smudges should be absent.
Documentation of Quality Checks
Maintain a calibration log that includes:
- Date of calibration
- Microscope and camera settings
- Pixel size values for each objective
- Any issues encountered and corrective actions taken
- Signature of the person performing the calibration
Result Interpretation
Understanding Magnification Values
The total magnification value indicates how many times larger the image appears compared to the actual specimen. For example, a 400× image means that a 1 μm structure appears as 400 μm (0.4 mm) in the image. However, this is the linear magnification; the area magnification is the square of the linear magnification (160,000× for 400×).
Relating Magnification to Resolution
Magnification alone does not guarantee that fine details are visible. The resolution of the microscope is determined by the numerical aperture of the objective and the wavelength of light. The Abbe diffraction limit for a light microscope is approximately 0.2 μm for visible light. Even at 1000× magnification, structures smaller than 0.2 μm will appear as blurred points. For super-resolution techniques like STORM, localization precision can reach approximately 20 nm, enabling visualization of structures beyond the diffraction limit [<a href="#ref-1">1</a>].
Scale Bar Interpretation
A scale bar provides an absolute reference for size, independent of the magnification value. When reporting images, always include a scale bar rather than relying solely on the magnification value, because the final image size on a printed page or screen may vary. The scale bar should be calibrated using the stage micrometer and should be accurate regardless of how the image is displayed.
Common Pitfalls in Interpretation
- Confusing optical and digital magnification: Digital zoom or cropping does not increase resolution; it only enlarges pixels.
- Assuming higher magnification always provides more detail: Beyond the maximum useful magnification, images become blurry and lack detail.
- Ignoring the tube factor: Some microscopes have a built-in magnification factor that must be included in calculations.
- Using uncallibrated scale bars: Scale bars from previous experiments or different objectives may be inaccurate.
Troubleshooting
| Observation | Likely Cause | Discriminating Check |
|---|---|---|
| Calculated magnification does not match expected value | Tube factor or intermediate lens not accounted for | Check microscope manual for tube factor; verify if any additional optics are in the light path |
| Scale bar measurements are inconsistent across the field | Geometric distortion from lens aberrations | Image a grid pattern and measure distances at center and edges; consider field-specific calibration [<a href="#ref-2">2</a>] |
| Image appears magnified but lacks detail (empty magnification) | Magnification exceeds maximum useful magnification based on NA | Calculate maximum useful magnification (1000× NA); reduce magnification or use higher NA objective |
| Pixel size calibration differs between calibration sessions | Changes in camera adapter, focus, or optical alignment | Repeat calibration with identical setup; ensure consistent focus and illumination |
| Scale bar appears correct at center but wrong at edges | Barrel distortion or pincushion distortion | Use distortion correction software or calibrate at multiple positions across the field |
| Digital image magnification does not match optical magnification | Camera adapter magnification factor unknown | Measure adapter magnification by imaging a stage micrometer with and without the adapter |
| Oil-immersion objective shows poor resolution | Incorrect oil type or air bubbles in oil | Clean objective and coverslip; apply fresh immersion oil; ensure bubble-free contact |
Limitations
Optical Limitations
- Diffraction barrier: Conventional light microscopy cannot resolve structures smaller than approximately 200 nm laterally and 500 nm axially. Super-resolution techniques like STORM can overcome this but require specialized equipment and fluorophores [<a href="#ref-1">1</a>].
- Depth of field: At high magnifications, the depth of field is very shallow (less than 1 μm at 100×), making it difficult to image thick specimens.
- Photobleaching: Fluorescent samples may fade during imaging, limiting the time available for calibration and acquisition.
Instrumentation Limitations
- Calibration drift: Mechanical components (stage, focus mechanism) may drift over time, requiring recalibration.
- Lens aberrations: Spherical aberration, chromatic aberration, and field curvature can affect measurement accuracy, especially at the edges of the field.
- Vibration: Environmental vibrations can cause image blurring, particularly at high magnifications. As demonstrated in SEM imaging, vibration distortion can significantly impair measurement accuracy, and correction may require both hardware and software approaches [<a href="#ref-3">3</a>].
User-Dependent Limitations
- Focus accuracy: Improper focus leads to inaccurate measurements.
- Calibration errors: Incorrect calibration of the stage micrometer or pixel size propagates to all subsequent measurements.
- Sampling bias: Selecting only the "best" images may introduce bias in quantitative analyses.
Specimen Limitations
- Specimen thickness: Thick specimens may be out of focus at high magnifications.
- Refractive index mismatch: Differences between the immersion medium and the specimen can cause spherical aberration.
- Autofluorescence: Some specimens exhibit autofluorescence that interferes with fluorescent imaging.
Documentation and Reporting
Laboratory Notebook Entries
For each microscopy session, record:
- Date and time
- Microscope model and serial number
- Objective lens used (magnification and NA)
- Eyepiece magnification
- Tube factor (if applicable)
- Camera model and adapter magnification
- Illumination settings (brightness, contrast, filter cubes)
- Calibration date and pixel size values
- Total magnification (optical and digital)
- Any issues encountered and corrective actions
Image File Metadata
Embed metadata in image files whenever possible. Include:
- Pixel size calibration
- Magnification values
- Scale bar information
- Acquisition date and time
- Microscope and camera settings
Reporting in Publications
When publishing microscope images, follow journal guidelines. Typically, include:
- A scale bar in each image
- The total magnification in the figure legend
- The microscope type and objective used
- Any image processing steps (e.g., contrast adjustment, deconvolution)
Example Documentation
Figure 1: Fluorescence image of mitochondria in HeLa cells. Scale bar: 10 μm. Total magnification: 630× (63× oil-immersion objective, 10× eyepiece, 1× tube factor). Image acquired using a Zeiss Axio Observer Z1 with a 63×/1.4 NA Plan-Apochromat objective and a Hamamatsu Orca Flash 4.0 camera. Pixel size: 0.1 μm/pixel. Image processing: background subtraction and contrast adjustment applied uniformly.
Biosafety Considerations
General Laboratory Safety
When working with microscopes in a teaching or research laboratory, follow standard biosafety practices as outlined in the Biosafety in Microbiological and Biomedical Laboratories (BMBL) guidelines [<a href="#ref-4">4</a>]. For routine microscopy of fixed specimens or non-pathogenic organisms, BSL-1 practices are typically sufficient.
Specimen Handling
- Fixed specimens: Formalin-fixed or otherwise chemically fixed specimens are generally safe to handle with standard precautions (gloves, lab coat).
- Live organisms: If imaging live microorganisms, ensure they are at BSL-1 level (e.g., non-pathogenic Escherichia coli K-12, Saccharomyces cerevisiae). Do not propagate or image select agents, clinical pathogens, or virulence-enhanced strains.
- Staining reagents: Some fluorescent dyes and chemical fixatives are toxic or carcinogenic. Follow manufacturer safety data sheets and use appropriate personal protective equipment.
Microscope Maintenance
- Clean objectives and eyepieces with lens paper and appropriate cleaning solution after each use.
- For oil-immersion objectives, remove immersion oil immediately after use to prevent damage to the lens.
- Disinfect microscope stages and controls if specimens are potentially infectious.
Waste Disposal
- Dispose of used slides, coverslips, and immersion oil according to institutional guidelines.
- Chemical waste (fixatives, stains) must be collected and disposed of as hazardous waste.
Recombinant or Synthetic Nucleic Acids
If imaging cells containing recombinant or synthetic nucleic acid molecules, follow the NIH Guidelines for Research Involving Recombinant or Synthetic Nucleic Acid Molecules [<a href="#ref-5">5</a>]. This may require additional containment levels or institutional approval.
Frequently Asked Questions
1. Why does my calculated magnification not match the value displayed on the microscope?
The displayed value on many microscopes is the optical magnification (objective × eyepiece) and does not account for tube factors, intermediate lenses, or camera adapter magnifications. Additionally, some microscopes have a built-in magnification changer (e.g., 1.25×, 1.6×) that may be engaged without the user noticing. Always verify the complete optical path and check the microscope manual for any additional magnification factors.
2. Can I use the same scale bar for images taken with different objectives?
No. Each objective has a different magnification, and therefore a different pixel-to-micrometer conversion factor. You must calibrate the scale bar for each objective individually. Even objectives with the same nominal magnification (e.g., two different 40× objectives) may have slightly different actual magnifications due to manufacturing tolerances. Always calibrate each objective separately.
3. How do I calculate magnification for a digital image displayed on a monitor?
The total magnification on a monitor depends on the optical magnification, the camera adapter magnification, the camera sensor size, and the monitor size and resolution. A practical approach is to image a stage micrometer and measure the distance between two marks on the monitor. The magnification is then: (distance on monitor in mm) / (actual distance in mm). For example, if a 10 μm (0.01 mm) mark appears as 10 mm on the monitor, the total magnification is 10 / 0.01 = 1000×.
4. What is the difference between magnification and resolution, and why does it matter?
Magnification is the factor by which an image is enlarged, while resolution is the ability to distinguish fine details. A microscope can have high magnification but poor resolution, resulting in a large but blurry image. The resolution is determined by the numerical aperture of the objective and the wavelength of light. The maximum useful magnification is approximately 1000× the numerical aperture. Beyond this, further magnification produces "empty magnification" with no additional detail. Always prioritize resolution over magnification when selecting objectives.
Related Clinical & Scientific Guides
- Loop-Mediated Isothermal Amplification (LAMP) Assay for Rapid Detection of African Swine Fever Virus in Oral Fluids
- How to Calculate the Concentration of Protein Using the Lowry Assay
- DNA Extraction from Saliva: Non-Invasive Sampling and Protocols
References and Further Reading
[1] Fernández de Córdoba J, Oña A, D'Agostino G. Accessible STORM Imaging: An Optimized Workflow for Conventional Widefield Epifluorescence/TIRF Setups. (2026). PubMed ID: 42158021. [Link](https://pubmed.ncbi.nlm.nih.gov/42158021/), Describes STORM imaging workflow and the importance of localization precision beyond the diffraction limit. [2] Wang Q. Interpreting Modulation Transfer Function in Endoscopic Imaging: Spatial-Frequency Conversion Across Imaging Spaces and the Digital Image Domain with Case Studies. (2026). PubMed ID: 41682343. [Link](https://pubmed.ncbi.nlm.nih.gov/41682343/), Provides a framework for spatial-frequency conversion and the importance of local magnification measurements. [3] Ding J, Liu L, Song M, Lu J, Zhang Y. Real-Time External Control Combined with Image Post-Processing for Mitigating SEM Vibration Distortion. (2026). PubMed ID: 41900201. [Link](https://pubmed.ncbi.nlm.nih.gov/41900201/), Illustrates the impact of vibration on high-magnification imaging and correction strategies. [4] CDC and NIH. Biosafety in Microbiological and Biomedical Laboratories (BMBL), 6th Edition. U.S. Department of Health and Human Services (2020). [Link](https://www.cdc.gov/labs/bmbl/index.html), Authoritative guidelines for biosafety practices in microbiological laboratories. [5] National Institutes of Health. NIH Guidelines for Research Involving Recombinant or Synthetic Nucleic Acid Molecules. [Link](https://osp.od.nih.gov/policies/biosafety-and-biosecurity-policy/nih-guidelines-for-research-involving-recombinant-or-synthetic-nucleic-acid-molecules/), Framework for safe handling of recombinant nucleic acids. [6] Overk C, Mobley WC. Stereology with OPEN-Stereo: low-cost, accessible, and accurate cellular quantification. (2025). PubMed ID: 41469449. [Link](https://pubmed.ncbi.nlm.nih.gov/41469449/), Demonstrates calibration and quantification methods for microscopy-based cell counting. [7] Borisova J, Morshchinin IV, Nazarova VI, Molodkina N, Nikitin NO. Low-Cost Microalgae Cell Concentration Estimation in Hydrochemistry Applications Using Computer Vision. (2025). PubMed ID: 40807815. [Link](https://pubmed.ncbi.nlm.nih.gov/40807815/), Provides a practical example of pixel-to-metric conversion for cell counting. [8] National Center for Biotechnology Information. NCBI Bookshelf: Molecular Biology and Laboratory Methods. [Link](https://www.ncbi.nlm.nih.gov/books/), Searchable collection of authoritative biomedical methods references.Related Articles
- How to Calculate the Resolution of a Light Microscope
- How to Calculate the Field of View on a Microscope
- How to Calculate the Doubling Time of a Bacterial Culture
- How to Calculate the Specific Growth Rate of a Microorganism
- How to Calculate the Limit of Detection for a qPCR Assay
- How to Calculate Cell Concentration Using a Hemocytometer