Bioinformatics Workflow Log Analysis: Step-by-Step Guide
By Dr. Zubair Khalid, DVM, MS, PhD ·
Bioinformatics workflow log analysis is the practice of reading the execution records that a pipeline framework and its tools write during a run, then using those records to verify, debug, audit, and reproduce the analysis. A single RNA-seq or amplicon project can chain dozens of tools across hundreds of samples. When a task fails at 2 a.m., or when a reviewer asks which version of an aligner produced a table, the answer lives in the logs, not in your memory.
By the end of this guide you will be able to locate every log artifact a Nextflow or Snakemake run produces, identify the first task that failed and read its stderr, decode exit codes such as 127 and 137, configure automatic retries with growing resources, resume a run without repeating finished work, extract runtime and quality metrics into a summary table, and turn the whole record into a methods paragraph you can paste into a manuscript.
You need a bash terminal with standard utilities (grep, cut, sort, uniq, tail, awk), a run directory from Nextflow 22 or later or Snakemake 7 or later, and optionally MultiQC for aggregating per-tool logs. Everything below works on a laptop against an existing run directory. No cluster access is required to read logs.
Why Bioinformatics Workflow Log Analysis Matters
Three properties make workflow logs worth analyzing as a deliberate step rather than an emergency reflex.
Traceability. Pipelines are built to record themselves. PipeCraft, a graphical toolkit for amplicon sequencing analysis, records all analytical steps and options in log files so that results remain traceable across sequencing platforms [1]. Watchdog 2.0 goes further, logging workflow execution along with module and software versions, and can generate a step-by-step analysis protocol from the log file that serves as a draft of a manuscript methods section [2]. Kronos, a workflow assembler for genome analytics, builds a run manager into every workflow that logs all runtime events, which makes runs auditable and distributable to other systems [3]. The pattern extends to graphical applications too. EEG-Pype, a preprocessing pipeline for resting-state EEG, saves a separate log alongside its outputs to improve reproducibility and documentation [4].
Method sensitivity. Two runs that differ only in a logged parameter can produce different biology. In a comparison of eight 16S rRNA gene analysis workflows applied to dairy processing surface microbiota, the number of genera identified ranged from 114 to 173 depending on the method, and centered log-ratio transformation (a per-sample compositional normalization) inflated alpha and beta diversity values compared with rarefaction [5]. In RNA-seq, the contribution of individual workflow steps to technical variation, and the ability of different normalization methods to remove that variation, is large enough that normalization choice behaves as a first-order experimental parameter [6]. Normalization and log-ratio schemes also change the association structure estimated from microbiome count data, which is why shrinkage estimators and variance-stabilizing approaches are evaluated against each other rather than assumed equivalent [7]. If the normalization you ran is not in the log, the result cannot be interpreted or repeated.
Debugging speed. A failed 400-task run usually has one root cause. Logs let you find the first failure in seconds instead of rerunning blind and hoping.
What a Bioinformatics Workflow Manager Writes to Disk
A bioinformatics workflow manager is software that chains individual tools into a pipeline, schedules the work across samples and compute resources, and records what it did. Nextflow, Snakemake, Watchdog, and Kronos are examples. They differ in syntax and schedulers, but they write overlapping sets of records, and learning to read one set transfers well to the others.
Two definitions first. stdout is the normal output stream of a program, the text a tool prints when it succeeds. stderr is the diagnostic stream, where tools print warnings and errors. Workflow managers capture both, and the difference between them is usually the fastest route to a diagnosis.
Nextflow artifacts
Nextflow keeps a central run log at .nextflow.log in the launch directory. It rotates this file on each new run, so older copies appear as .nextflow.log.1, .nextflow.log.2, and so on. The nextflow log command reads run history from .nextflow/cache and prints one row per past run, and it can filter down to individual tasks. Each task also gets a sandbox directory under work/, addressed by a two-level hash such as work/7c/1e4a9b2f3c5d6e7f8a9b0c1d2e3f4a5b/, containing the rendered script (.command.sh), captured stderr (.command.err), captured stdout (.command.out), the full execution wrapper (.command.run), and the exit status (.exitcode). Adding -with-trace -with-timeline -with-report -with-dag to a run writes trace.txt (one row per task with status, exit code, duration, CPU use, and peak memory), timeline.html, report.html, and a diagram of the directed acyclic graph, which is the dependency map of tasks.
Snakemake artifacts
Snakemake writes a timestamped log for each invocation under .snakemake/log/, for example 2026-11-09T140233.874120.snakemake.log. Per-tool stderr is not captured automatically. You capture it by declaring a log: directive in each rule and redirecting inside the shell command. Snakemake also maintains a metadata database under .snakemake/metadata that records which output files were produced by which rule and code, and this database is what lets Snakemake decide what to rerun after a change. The benchmark: directive writes per-task timing and peak memory to a tab-separated file.
| Artifact | Location | What it tells you | How to read it |
|---|---|---|---|
| Nextflow run log | .nextflow.log (rotated to .nextflow.log.1) | Full manager-level event stream, first place errors appear | tail -n 100 .nextflow.log |
| Nextflow task history | .nextflow/cache via nextflow log | One row per task, filterable by status | nextflow log -f status=FAILED |
| Nextflow task sandbox | work/<2 chars>/<hash>/ | Rendered command, stderr, stdout, exit code | cat work/7c/1e4a9b.../.command.err |
| Nextflow structured metrics | trace.txt, timeline.html, report.html | Status counts, durations, CPU, peak RSS per task | cut, awk, or open in a browser |
| Snakemake invocation logs | .snakemake/log/*.snakemake.log | What Snakemake decided and why, plus errors | tail -n 100 on the newest file |
| Snakemake rule logs | Paths you set in log: directives | Tool stderr per sample | grep, less |
| Snakemake benchmarks | Paths you set in benchmark: | Seconds and peak memory per task | column -t |
How to Do Bioinformatics Workflow Log Analysis, Step by Step
Work through the following steps against a real run directory. The running example is a small Nextflow alignment pipeline with two samples, but the same sequence applies to Snakemake and to large nf-core runs. Expected output is shown after each command.
Step 1. Identify the run you are looking at
nextflow logExpected output (columns trimmed for readability):
Last run: cranky_easley
2026-11-09 14:02:33   9m 41s    7c1e4a9b   nextflow run main.nf -profile test -with-trace -with-timeline -with-report
2026-11-09 09:14:10   12m 34s   9a8b7c6d   nextflow run main.nf -profile test
The run name (cranky_easley) and session hash (7c1e4a9b) identify every other artifact for this run. Record the full command line and any parameters file in a manifest, because the manager history is the only place the exact invocation is stored. For Snakemake, the newest timestamped file in .snakemake/log/ is your run:
ls -t .snakemake/log/ | head -32026-11-09T140233.874120.snakemake.log
2026-11-09T091410.221355.snakemake.logSnakemake does not repeat the invocation command inside the log file, so the command belongs in your manifest.
Step 2. Make sure the next run writes structured records
Structured records are cheap before a run and impossible after it. For Nextflow:
nextflow run main.nf -profile test -with-trace -with-timeline -with-report-with-trace writes the per-task table, -with-timeline writes an interactive duration chart, and -with-report writes an HTML summary. For Snakemake, add log: and benchmark: directives to each rule so tool stderr and resource use land in files:
rule map_reads:
    input:
        reads="results/trimmed/{sample}.fq.gz",
        idx="results/index/ref.fa"
    output:
        "results/mapped/{sample}.bam"
    log:
        "logs/map_reads/{sample}.log"
    benchmark:
        "benchmarks/map_reads/{sample}.tsv"
    shell:
        "bwa mem {input.idx} {input.reads} 2> {log} | samtools view -b - > {output}"
The 2> {log} redirect is the part people forget. Without it, the aligner's error messages go to the console and vanish when the terminal closes.
Step 3. Find the first failure
Search the manager log for the earliest error, not the last:
grep -n -i "error" .nextflow.log | head -5412:Nov-09 14:04:01.882 [Task monitor] ERROR nextflow.processor.TaskProcessor - Error executing process > 'align (sampleA)'Line 412 is your entry point. Then list the failed tasks from the run history:
nextflow log -f status=FAILEDLast run: cranky_easley (7c1e4a9b)
hash native_id process tag exit_status
1e4a9b2f 402193 align sampleA 137
3f4a5b6c 402204 align sampleB 137Both failures are in the same process with the same exit code, which already suggests a systematic cause rather than a corrupt input file. For Snakemake, read the tail of the newest invocation log:
tail -n 60 $(ls -t .snakemake/log/*.snakemake.log | head -1)Error in rule map_reads:
jobid: 3
output: results/mapped/sampleA.bam
log: logs/map_reads/sampleA.log (check log file(s) for error message)
Removing output files of failed job map_reads since they might be corrupted:
results/mapped/sampleA.bamTwo lessons sit in that output. Snakemake names the rule log that holds the real error message, and it deletes partial outputs from the failed job so a later rerun cannot mistake a truncated file for a result.
Step 4. Open the task sandbox and read the tool's own stderr
The Nextflow error block printed to the console is a wrapper. The cause is in the sandbox:
ls work/7c/1e4a9b2f3c5d6e7f8a9b0c1d2e3f4a5b/.command.sh .command.err .command.out .command.run .exitcodecat work/7c/1e4a9b2f3c5d6e7f8a9b0c1d2e3f4a5b/.command.sh#!/bin/bash -ue
bwa mem results/index/ref.fa results/trimmed/sampleA.fq.gz > results/mapped/sampleA.samcat work/7c/1e4a9b2f3c5d6e7f8a9b0c1d2e3f4a5b/.command.err.command.sh: line 2: bwa: command not foundcat work/7c/1e4a9b2f3c5d6e7f8a9b0c1d2e3f4a5b/.exitcode127The full Nextflow console block for this failure looks like this, and it is worth learning to read at a glance:
ERROR ~ Error executing process > 'align (sampleA)'

Caused by:
  Process `align (sampleA)` terminated with an error exit status (127)

Command exit status:
  127

Command error:
  .command.sh: line 2: bwa: command not found

Work dir:
  /projects/demo/work/7c/1e4a9b2f3c5d6e7f8a9b0c1d2e3f4a5b
The .command.run file is also worth reading once per pipeline. It contains the environment setup, the container invocation, and the scheduler directives, so it is your proof of which container image actually executed the task.
Step 5. Decode the exit code
Exit codes above 128 encode a signal: 137 is 128 plus 9 (SIGKILL) and 143 is 128 plus 15 (SIGTERM). The codes below cover most workflow failures.
| Exit code | Meaning | Typical cause | First thing to check |
|---|---|---|---|
| 1 | Generic tool failure | Bad input file, invalid argument | .command.err for the tool's own message |
| 127 | Command not found | Tool missing from the container image or PATH | Tool installed in the image, PATH in .command.run |
| 137 | Killed (SIGKILL) | Out of memory, cgroup limit, manual kill | Peak memory in trace.txt vs requested memory |
| 139 | Segmentation fault | Corrupt input, binary or library mismatch | Input file integrity, container version |
| 143 | Terminated (SIGTERM) | Scheduler time limit or manual kill | Requested time vs actual runtime |
In the running example, 127 means bwa was never on the PATH inside the execution environment, which is a container or packaging problem, not a data problem.
Step 6. Fix resources and let the manager retry
For memory failures (exit 137), the standard Nextflow pattern retries with growing resources. Put this in nextflow.config:
process {
  errorStrategy = { task.exit_status in 137..140 ? 'retry' : 'terminate' }
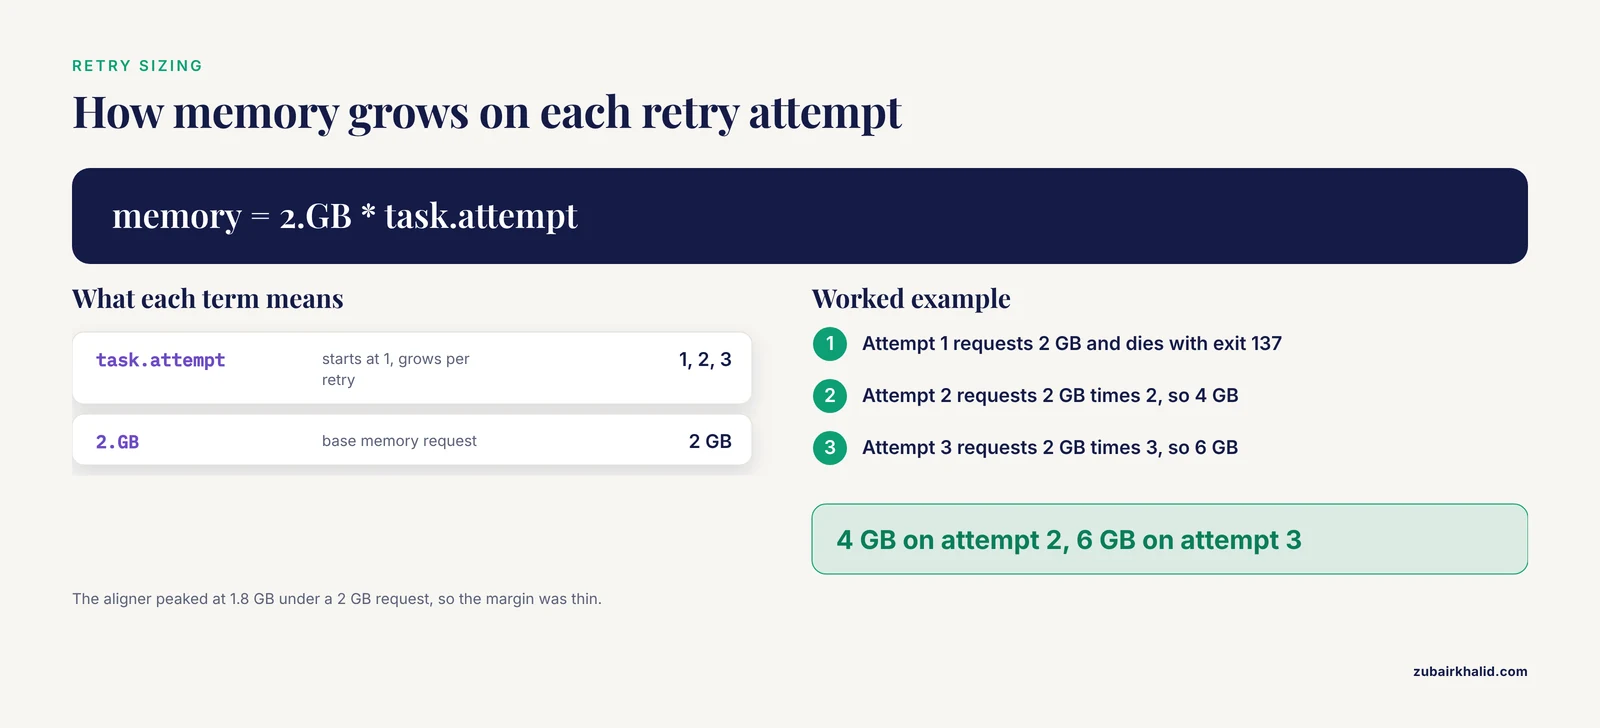
  memory = { 2.GB * task.attempt }
  cpus   = { 2 * task.attempt }
}
task.attempt starts at 1, so the worked calculation is direct. A task that died with exit 137 under a 2 GB request comes back at 4 GB on attempt 2 and 6 GB on attempt 3. The errorStrategy values are terminate (the default, stop the run), retry (resubmit the task), ignore (mark the task failed and continue), and finish (stop submitting new tasks but let running ones end). Set maxRetries explicitly if you want more than one retry. Recent Snakemake versions support a retries directive that reruns a failed job a fixed number of times with the same resources.
Step 7. Resume without repeating finished work
After fixing the container, rerun with the resume flag:
nextflow run main.nf -resume[9a/8b7c6d] process > trim (sampleA) [100%] 2 of 2, cached: 2
[7c/1e4a9b] process > align (sampleA) [100%] 2 of 2Nextflow hashes each task's code, inputs, container, and parameters. Anything whose hash is unchanged is reused from cache, and only the failed tasks execute again. Snakemake behaves the same way through its metadata database: rerun the same target command and Snakemake rebuilds only what is missing or changed. If Snakemake reports that outputs from a killed run are incomplete, rerun with its rerun-incomplete option so those partial files are redone. Watchdog 2.0 implements the same idea explicitly, resuming execution after interruption or modification without rerunning successfully executed tasks that were not affected by the changes [2].
Step 8. Extract runtime and quality metrics
With trace.txt from Step 2, first confirm the column layout, because positions vary slightly between Nextflow versions:
head -n1 trace.txttask_id process tag hash native_id status exit submit duration %cpu peak_rss peak_vmemThen count task outcomes:
cut -f6 trace.txt | tail -n +2 | sort | uniq -c 2 CACHED
10 COMPLETED
2 FAILEDTwo of fourteen tasks failed in the first pass. Peak memory per process, with peak_rss (resident set size, the maximum physical memory the task used) in column 11:
awk -F'\t' 'NR>1 {print $2 "\t" $11}' trace.txt | sort -ualign 1.8 GB
fastqc 312.4 MB
index 96.1 MB
trim 640.2 MBThe aligner peaked at 1.8 GB under a 2 GB request, which is why the retry multiplier in Step 6 matters rather than being paranoia.
Quality metrics come from tool logs, and per-sample summaries are what you want. A dual-transcriptomic analysis of nasal swabs from 76 SARS-CoV-2 patients reported a median of 8.94 percent of reads not mapping to the human genome across 149 samples, of which about half (median 49.68 percent) mapped to microbiome genomes [8]. Those two numbers are exactly the kind of per-sample summary you should be able to regenerate from your logs months later. If your pipeline prints them only to the console, add a redirect or tee so they land in files. MultiQC reads the native logs of common tools such as FastQC, samtools flagstat, and featureCounts and aggregates them into a single HTML report, which is usually the fastest way to turn scattered logs into a per-sample QC table.
Logs prove execution, not correctness. The GenomeStudio guide for SNP array quality control in human pluripotent stem cells is a good model of the discipline: it pairs each analysis step with explicit QC metrics, thresholds, and expected values, and across 32 cell lines it flagged chromosomal aberrations in 9, including the frequently reported gain of 20q11.21 [9]. Define equivalent thresholds for your pipeline, such as a mapping-rate floor or a duplication ceiling, and check the log-derived table against them after every run.
Step 9. Build a manifest, a methods paragraph, and a run comparison
A manifest is a dozen lines that make a run interpretable later:
run_id:        cranky_easley
date:          2026-11-09
pipeline:      rnaseq-nf, revision 4f2a91c
manager:       Nextflow 24.04.2
params_file:   params.yaml (reads=data/fastq/*.fq.gz, paired=true)
containers:    bwa 0.7.17, samtools 1.19 (digests recorded per task in work/)
reports:       trace.txt, timeline.html, report.html
tasks:         14 total, 2 cached, 0 failed (final run)
peak_memory:   1.8 GB (align)
From the manifest, a methods paragraph writes itself:
Reads in
data/fastqwere trimmed and aligned with rnaseq-nf (revision 4f2a91c) executed by Nextflow 24.04.2. Alignment used bwa 0.7.17 from a pinned container image. The final run completed 14 tasks with no failures, a maximum peak memory of 1.8 GB, and a wall time of 9 minutes 41 seconds. Trace, timeline, and report files are archived alongside the results.
Watchdog 2.0 automates this by generating a step-by-step analysis protocol from its log file as a draft methods section [2]. If your manager cannot do that, the hand-written manifest above takes five minutes. The point generalizes to preprocessing parameters too. A machine learning study of serum metabolomics standardized its workflow around random forest-based imputation, log transformation, Pareto scaling, and ComBat batch correction before model benchmarking [10], which illustrates how many parameters a single preprocessing stage can carry. Every one of them belongs in the record.
Finally, compare runs by diffing manifests and trace summaries:
diff manifest_run1.txt manifest_run2.txtWhen you change a workflow variant, the log diff is the only honest statement of what actually changed, and the 16S comparison cited earlier shows why that statement matters for the conclusions you draw.
Nextflow vs Snakemake for Log Analysis
This is the comparison most teams eventually face, and for log analysis the honest answer is that they optimize different things.
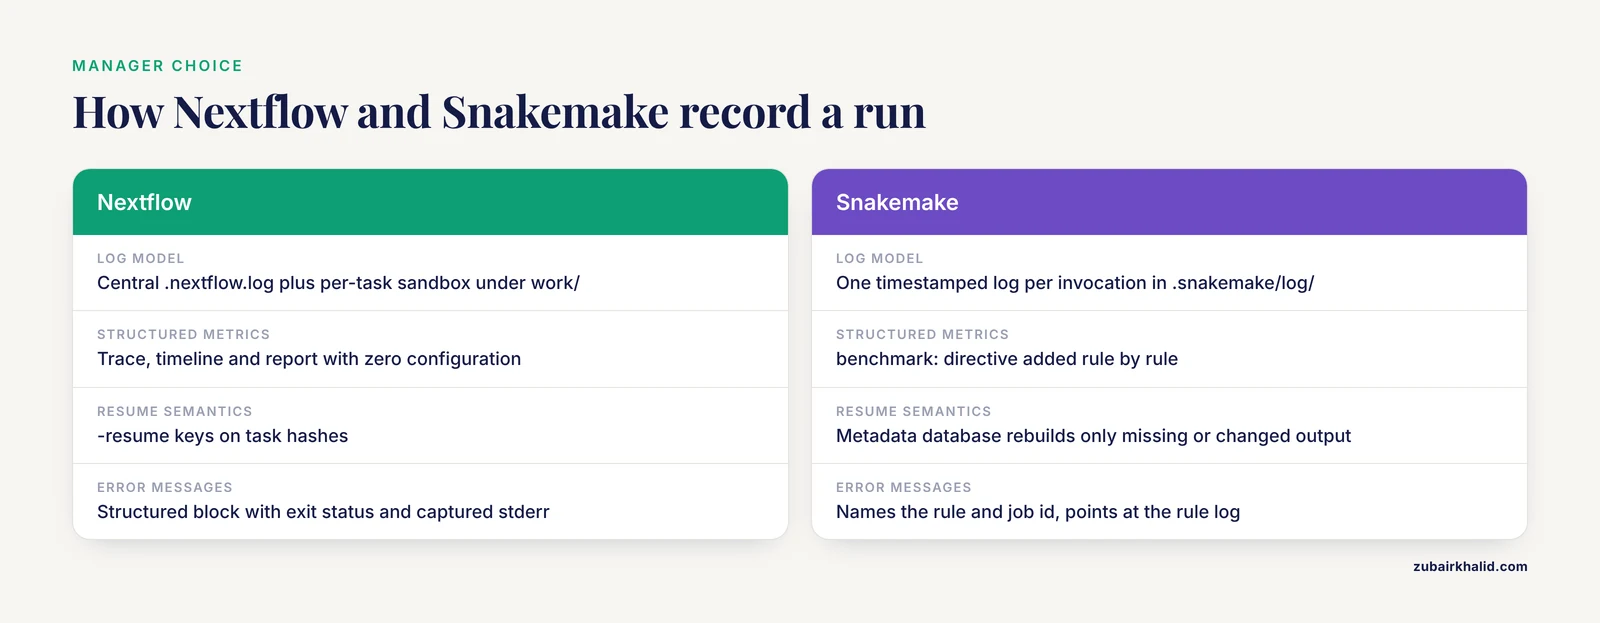
Log model. Nextflow gives you a central event stream (.nextflow.log), a per-task sandbox under work/, and a queryable history through nextflow log. Everything is written whether you asked for it or not. Snakemake writes one timestamped log per invocation and leaves per-tool logging to the log: directives you declare, which is more work up front but produces exactly the log layout you designed.
Structured metrics. Nextflow wins out of the box. -with-trace, -with-timeline, and -with-report produce a per-task table and visual reports with zero configuration. Snakemake's benchmark: directive gives you per-task timing and peak memory, but you add it rule by rule.
Resume semantics. Both avoid repeating finished work. Nextflow's -resume keys on task hashes, Snakemake keys on its metadata database. Both report what was cached, and both cache reports belong in your run archive.
Error messages. Nextflow prints a structured block with the exit status, the executed command, and the captured stderr. Snakemake prints the rule and job id and points you at the rule log. Nextflow's block is friendlier for newcomers, Snakemake's is terser but equally complete once your log: directives exist.
Ecosystem and alternatives. nf-core pipelines standardize structured reports under pipeline_info/, including software versions, which removes most of the manual work regardless of the manager. Beyond the two leaders, Watchdog 2.0 emphasizes logging, module documentation, and log-derived methods sections [2], and Kronos emphasizes auditable, configuration-driven workflows whose run managers log all runtime events [3]. For log analysis specifically, Nextflow gives you more structured data with no setup, Snakemake gives you finer control and a transparent rerun database, and a team that already runs one of them well should stay with it. Migration costs more than any logging difference.
Bioinformatics Workflow Log Analysis Tips
- Turn on trace, timeline, and report before you need them. Structured records cannot be reconstructed after a run. Make the flags part of your default invocation or profile.
- Give every Snakemake rule a
log:directive. Redirect tool stderr into a per-sample file. In Nextflow the sandbox does this for you, so read.command.errinstead of the console. - Record versions in the run, not in your notebook. Pin containers by digest where possible, and prefer pipelines that write software versions to a file, as nf-core pipelines do under
pipeline_info/. - Grep for the first error, then read forward. The last error in a log is usually a cascade. The first
ERRORline is the root cause more often than not. - Treat CACHED rows as data. They tell you exactly what
-resumereused, which is what you need when you suspect a stale cache. - Keep logs with results. Archive
.nextflow.log,trace.txt, and.snakemake/log/next to your output directory. A result directory without its logs is an uninterpretable artifact. - Use timestamps to find the slow step before optimizing anything. The timeline report ranks tasks by duration, and one bar usually dominates the whole run.
- Aggregate per-tool logs with MultiQC. Reading forty FastQC files by eye is how metrics get missed. One HTML table per run is the standard.
- Test small. A test profile with two tiny samples keeps development logs short enough to actually read, and it makes failures obvious.
- Correlate with scheduler logs when tasks die silently. If a task shows exit 143 with almost no runtime, look for the corresponding scheduler job record, because the kill may have come from outside the workflow.
- Write the manifest the same day. Parameter memory decays faster than you expect, and the manifest is what makes next month's comparison possible.
Common Mistakes and Limitations
The most common mistakes in bioinformatics workflow log analysis are procedural, and each has a direct fix.
- Reading only the tail of the manager log. The last error is often downstream collateral. Find the first
ERRORand work forward from it. - Confusing manager errors with tool errors. Nextflow's "terminated with an error exit status" block is the wrapper, and
.command.erris the cause. Snakemake's "Error in rule" is the wrapper, and the file named in thelog:directive is the cause. Always go one level deeper before diagnosing. - Calling exit 137 a software bug. It is almost always memory. Compare the task's peak RSS in the trace against the requested memory before touching any code.
- Assuming a clean exit means a correct result. Exit 0 on a mislabeled or corrupted input still produces confident-looking garbage. Pair log analysis with explicit QC thresholds of the kind the GenomeStudio stem cell guide demonstrates, where every step has a metric and a threshold attached.
- Not recording versions. Without versions, two runs are not comparable, which is why Watchdog's authors built software version logging into the core of the system rather than leaving it to users.
- Overwriting logs. Nextflow rotates
.nextflow.logon every launch from the same directory. Yesterday's log becomes.nextflow.log.1and eventually falls off the rotation. Copy logs into the results archive before relaunching. - Parsing
trace.txtas comma-separated. It is tab-separated. Usecut -forawk -F'\t', and read the header line first because column order varies between Nextflow versions. - Expecting identical results from identical-looking runs. Normalization and preprocessing choices are logged parameters with downstream consequences, as the RNA-seq and 16S comparisons discussed above demonstrate. The log tells you which choices produced which numbers.
- Assuming every pipeline logs like this guide. The commands here reflect core Nextflow and Snakemake behavior, which is stable, but individual pipelines add their own layers of reports and directories. Read the pipeline's documentation and list its output directory before scripting against it.
Two limitations bound what log analysis can do. Computing environments differ, so a laptop run, a SLURM cluster, and a cloud batch system produce different wrapper details and different failure modes around the same core records. And a log records what ran, never why a threshold was chosen or whether it was biologically justified. Log analysis complements scientific judgment, it does not replace it.
Frequently Asked Questions
What is bioinformatics workflow log analysis?
It is the practice of reading the execution records that a workflow manager and its tools write during a pipeline run, then using those records to debug failures, audit what ran, and reproduce the analysis. The records include manager event logs, per-task stderr and stdout, exit codes, and structured runtime tables.
Where does Nextflow store its logs?
Nextflow stores its main run log in .nextflow.log in the launch directory, per-task scripts and stderr in work/<hash>/.command.* files, and run history in .nextflow/cache, which you read with the nextflow log command. The main log rotates on each new run, so older copies gain numeric suffixes.
Where does Snakemake keep its logs?
Snakemake writes one timestamped log per invocation under .snakemake/log/, while per-tool stderr goes to whatever path each rule's log: directive defines. If a rule has no log: directive, the tool's error output appears only in the console and is lost when the terminal closes.
What does exit code 137 mean in a workflow log?
Exit code 137 means the task was killed by SIGKILL, which in practice almost always means it exceeded a memory limit. Compare the task's peak memory in the trace file against the memory you requested, then add a retry strategy that increases memory with each attempt.
How do I rerun only the failed tasks in a workflow?
In Nextflow, rerun the same command with -resume, which reuses cached tasks and re-executes only the failures. In Snakemake, rerun the same target command and the metadata database rebuilds only what is missing or changed.
Nextflow vs Snakemake: which has better logs?
Nextflow provides more structured runtime logging out of the box through its trace, timeline, and report files, while Snakemake gives finer per-rule control through log: and benchmark: directives. Both are fully adequate for log analysis, so the better choice depends on your team's existing experience and infrastructure.
How do I turn workflow logs into a methods section?
Record the pipeline name and revision, workflow manager version, container digests, parameters, and a task summary from the trace file, then write one sentence per parameter group. Watchdog 2.0 generates this kind of step-by-step protocol directly from its log file, and a hand-written manifest takes only a few minutes with any manager.
How do I monitor memory and CPU use from workflow logs?
Run Nextflow with -with-trace and read the peak_rss and %cpu columns, or use Snakemake's benchmark: directive, then compare measured peaks against the resources each task requested. The comparison tells you whether failures were resource limits and what to request on the next run.
Sources
- PipeCraft: Flexible open-source toolkit for bioinformatics analysis of custom high-throughput amplicon sequencing data.
- Watchdog 2.0: New developments for reusability, reproducibility, and workflow execution.
- Kronos: a workflow assembler for genome analytics and informatics.
- EEG-Pype: An accessible MNE-Python pipeline with graphical user interface for preprocessing and analysis of resting-state electroencephalography data.
- The choice of 16S rRNA gene sequence analysis impacted characterization of highly variable surface microbiota in dairy processing environments.
- Expression analysis of RNA sequencing data from human neural and glial cell lines depends on technical replication and normalization methods.
- Shrinkage improves estimation of microbial associations under different normalization methods.
- Dual-transcriptomic analysis of human nasal transcriptome and microbiome reveals host-bacteria associations in symptomatic respiratory infection.
- Chromosomal quality control in hPSCs: A practical guide to SNP array analysis with GenomeStudio.
- Machine Learning Analysis of Serum Metabolomics for Multi-Disease Classification and Proteome-Metabolome Pathway Insights in T2D, IBD, and CRC.