Top Web-Based Bioinformatics Platforms for Sequence Analysis
By Dr. Zubair Khalid, DVM, MS, PhD ·

A web-based bioinformatics platform runs sequence analysis in your browser, while a command-line pipeline requires local installation, scripting, and computing power of your own. The rule of thumb is simple: if your question is a standard one, such as a similarity search, a multiple sequence alignment, a 16S rRNA profile, or a primer design problem, a well-maintained web platform will get you a defensible answer faster than building your own pipeline. If your question requires custom parameters, very large files, or strict reproducibility for publication, use the web platform to prototype the analysis and then reproduce it with the underlying open-source tools on your own hardware or through a workflow framework.
This guide walks through the best web-based bioinformatics platforms for sequence analysis as of late 2026, explains each one on its own terms, compares them on the criteria that actually decide which tool to open, and works through realistic scenarios. It is written for bench biologists, clinicians, students, and core-facility staff who want results without becoming system administrators.
Why Web-Based Platforms Matter in Modern Sequence Analysis
The volume of biological sequence data has grown faster than the number of researchers trained to analyze it. A review of the field describes the core problem directly: the rapid growth of biological sequence data has increased the need for easy, accessible, and scalable tools for sequence comparison, and the EMBL-EBI Job Dispatcher framework answers that need with a single web interface offering widely used programs such as BLAST, Clustal Omega, and EMBOSS [1]. The same accessibility argument drives nearly every platform covered here. One automated ChIP-seq platform was built specifically because existing tools required manual file processing, rigid input formats, and significant bioinformatics expertise, which excluded many experimental researchers [2].
Web-based platforms solve four recurring pain points:
- Installation burden. Tools such as DADA2, PICRUSt2, and SPAdes have complex dependencies. A web platform ships these dependencies preconfigured [3].
- Fragmentation. A single amplicon sequencing project may need quality trimming, ASV inference, taxonomy assignment, tree building, diversity statistics, and differential abundance testing, each historically a separate tool with its own data format. End-to-end web platforms chain these steps automatically [3].
- Reproducibility and traceability. Platforms built on workflow frameworks such as Galaxy record every parameter, which matters when reviewers ask how an analysis was performed [4].
- Hardware. Local analysis of large datasets requires RAM and disk space that many labs do not have. Web platforms shift computation to institutional or cloud servers [5].
The tradeoffs are real. You upload your data to someone else's server, you accept whatever parameter defaults or limits the site imposes, and you depend on the platform staying funded and online. Several sections below address those limitations directly.
Categories of Web-Based Sequence Analysis Platforms
The top web-based bioinformatics platforms for sequence analysis fall into five broad categories. Understanding the categories makes the bioinformatics tools comparison below much easier to use.
General-purpose sequence analysis suites. These offer similarity searching, multiple sequence alignment, translation, motif detection, and similar core tasks through one interface. They are the starting point for most biologists.
Integrated NGS environments. These wrap complex next-generation sequencing workflows, such as RNA-seq, ChIP-seq, or metagenomic pipelines, behind forms and dashboards so that a non-programmer can run a complete analysis [6] [5].
Domain-specific end-to-end platforms. These automate an entire analysis for a defined question, such as typing a Streptococcus pneumoniae genome or profiling a 16S rRNA community, where the platform encodes expert choices about tools and parameters [7] [3].
Specialized databases with built-in analysis. These combine curated data for a taxon, tissue, or molecule class with query and mining tools, so the analysis happens where the data already live [8] [9].
Design and discovery tools. These handle a narrower computational task, such as PCR primer design, repetitive element discovery, or protein-ligand interaction comparison, with high precision [10] [11] [12].
General-Purpose Suites: The Best Starting Point
EMBL-EBI Job Dispatcher
The Job Dispatcher framework at EMBL-EBI is the clearest example of a mature, general-purpose web platform for sequence analysis. A detailed current protocols article documents its main tool categories and provides step-by-step workflows covering six basic protocols: sequence similarity search with FASTA, similarity search with NCBI BLAST+, iterative profile-based searching with PSI-BLAST, multiple sequence alignment with Clustal Omega, alignment visualization with MView, and a combined workflow that carries BLAST results through Clustal Omega and into MView for visualization [1].
The practical strength of Job Dispatcher is that it packages the tools most biologists already know by name. BLAST finds sequences similar to your query in a database. Clustal Omega aligns many sequences at once to reveal conserved residues. MView renders those alignments so patterns are visible. PSI-BLAST iteratively refines a position-specific profile, which finds distant homologs that a plain BLAST search can miss. Because all of these run under one submission framework, you can take the top hits from a similarity search and feed them into an alignment without downloading, reformatting, or reinstalling anything [1].
For a student or researcher new to bioinformatics, this is the platform to learn first. The protocols describe running these analyses directly on the web without installing any bioinformatics software, and the workflows double as teaching material [1].
The Living Room of Web Services: What Seahawk Started
Before integrated suites became standard, researchers chained analyses by copying results between websites, reformatting as they went. The Seahawk project, published in BMC Bioinformatics, attacked that problem using Semantic Web Services, specifically the MOBY-S framework, which lets services discover each other through a shared data ontology. Seahawk allowed biologists to chain web services in a data-centric rather than service-centric way, loading web pages and text files they already worked with while an XML engine built on XSLT style sheets, regular expressions, and XPath statements moved data between tools behind the scenes [13].
Seahawk itself is a historical artifact now, but the design problem it solved still defines what makes a web platform good. When you evaluate any modern platform, ask how easily results from one step become inputs to the next. Job Dispatcher's BLAST-to-Clustal-Omega-to-MView workflow is the modern answer to the same question Seahawk raised nearly two decades ago [13] [1].
Integrated NGS Environments for High-Throughput Data
EDGE
An early and influential attempt at full integration is the EDGE platform, described as a web-based environment with a wide assortment of integrated bioinformatics tools and preconfigured workflows. Its stated goal was to let even novice next-generation sequencing users perform complex analyses with a few mouse clicks, then visualize and interrogate results within the same environment, in applications spanning genome assembly, annotation, transcriptomics, and metagenomics [5]. EDGE articulated the design philosophy that almost every platform in this article now follows: remove the software dependencies, remove the scripting, and expose the science rather than the plumbing [5].
NASQAR
NASQAR (Nucleic Acid SeQuence Analysis Resource) takes a complementary approach. It is a collection of custom and publicly available open-source web applications that make extensive use of R packages for interactive analysis and visualization, developed as a collaboration between the core bioinformatics teams of NYU Abu Dhabi and NYU New York. Its coverage includes transcriptome data preprocessing, RNA-seq analysis including single-cell RNA-seq, metagenomics, and gene expression analysis, and it is available both as a public website and as open-source code on GitHub and a Docker image, which means institutions can host their own instance [6].
The distinguishing feature of NASQAR is interactivity. Rather than submitting a job and receiving a static report, you explore the data, adjusting filters and visualizations in real time. For exploratory analysis of RNA-seq count matrices, that interaction is worth more than raw speed [6].
H3NGST for ChIP-seq
Chromatin immunoprecipitation followed by sequencing (ChIP-seq) maps protein-DNA interactions and histone modifications across the genome. H3NGST (Hybrid, High-throughput, and High-resolution NGS Toolkit) automates the entire ChIP-seq workflow from raw data retrieval by BioProject ID through quality control, adapter trimming, reference genome alignment, peak calling, and genomic annotation, including categorization of peaks by genomic region such as promoters. The developers highlight that the platform eliminates the need for local installations, programming skills, or large file uploads, because it can pull public data itself rather than requiring you to transfer big FASTQ files from your laptop [2].
That detail matters. One of the weakest points of web bioinformatics is upload bandwidth for large files. Platforms that accept an accession number and fetch the data server-side sidestep the problem entirely, and this design also extends to 16S-focused platforms with built-in NCBI SRA integration [3] [2].
Domain-Specific End-to-End Platforms
16S-Pipeline for Amplicon Sequencing
16S rRNA gene amplicon sequencing is the most widely used approach for characterizing microbial communities, yet analyzing such data historically meant navigating a fragmented landscape of tools with distinct installation requirements, parameter settings, and data formats. 16S-Pipeline is an open-source web platform that provides a complete workflow from raw FASTQ files to publication-ready statistical analyses [3].
Its feature set shows what a mature end-to-end amplicon platform looks like in 2026. The system automatically detects sequencing type (paired-end, single-end, or long-read), the variable region targeted, and the sequencing platform (Illumina, PacBio HiFi, or Nanopore). It then performs quality filtering, primer trimming, amplicon sequence variant (ASV) inference via DADA2, taxonomy assignment against SILVA v138.1, and phylogenetic tree construction, with optional functional prediction through PICRUSt2. Downstream analyses include alpha and beta diversity, taxonomic composition visualization, and differential abundance testing using five complementary methods, ALDEx2, DESeq2, ANCOM-BC2, LinDA, and MaAsLin2, reported with consensus. Built-in NCBI SRA integration lets you download public datasets for reanalysis and generates submission metadata spreadsheets for depositing your own data [3].
For anyone comparing web-based bioinformatics platforms for a microbiome project, the five-method differential abundance consensus is a standout. Different differential abundance methods disagree frequently, so running them in parallel and reporting which taxa are robust to method choice is a stronger practice than relying on a single test.
SimpleMicrobiome for Downstream Microbiome Analysis
Where 16S-Pipeline starts at raw reads, SimpleMicrobiome starts downstream. It is a web-based R Shiny platform that integrates established microbiome analysis methods into a single interactive workflow. It accepts standard abundance, taxonomy, and metadata tables, supports interactive preprocessing and sample filtering, and provides modules for taxa profile visualization, alpha and beta diversity, ANCOM-BC2 and MaAsLin2 differential abundance testing, Random Forest modeling with SHAP-based interpretation, microbial association network inference using SparCC and SPIEC-EASI through NetCoMi, correlation heatmaps, and dbRDA and CAP-style association biplots. Because it is modular, preprocessing choices propagate across downstream analyses, which prevents the common error of filtering samples one way for a diversity plot and a different way for a differential abundance test [14].
The practical division of labor is clear. Use 16S-Pipeline when your input is FASTQ files. Use SimpleMicrobiome when your input is feature tables, for example outputs from QIIME 2 or another upstream pipeline, and you need publication-grade downstream statistics and figures without scripting [3] [14].
FastGroupII, the Early Dereplication Standard
FastGroupII, published in BMC Bioinformatics in 2006, is an early web platform for dereplicating large 16S rDNA libraries. It offers four different dereplication methods, performs rarefaction analysis, and automatically calculates the Shannon-Wiener Index and Chao1. Tested on 16S rDNA sequences from coral-associated bacteria, it showed that different grouping algorithms produced similar but not identical results, which led the authors to recommend analyzing such datasets in multiple ways when used for community ecology studies [15].
FastGroupII predates the ASV era, but its core lesson has not expired. Dereplication, the process of collapsing identical or near-identical sequences into representative units, is method-dependent, and your ecological conclusions can shift with the method you choose. Any modern tool comparison should inherit that caution [15].
PneusPage for Pathogen Whole-Genome Sequencing
For clinically important bacteria, specialized platforms automate what would otherwise be a multi-tool odyssey. PneusPage is a web-based tool that integrates species prediction, molecular typing, drug resistance determination, and data visualization for Streptococcus pneumoniae whole-genome sequencing data. In an evaluation of 80 pneumococcal genomes from the Global Pneumococcal Sequencing Project compared against PathogenWatch, PneusPage showed 100 percent concordance for serotypes, 100 percent concordance for multilocus sequence typing, 88.8 percent concordance for penicillin-binding protein typing, and 98.8 percent concordance for Global Pneumococcal Sequencing Clusters. It also integrates detection of virulence factors and mobile genetic elements not provided by the comparison platform [7].
Two lessons follow. First, when two expert-curated platforms agree that closely on routine typing tasks, either is defensible, and the choice can rest on the extras, such as virulence and mobile genetic element detection. Second, the typing categories that disagree most, here penicillin-binding protein profiles, are exactly the ones where you should check which database versions and rules each platform applies before trusting a resistance inference [7].
Clasnip for Fine-Scale Classification
Clasnip addresses a different question in pathogen genomics: distinguishing closely related microorganisms at intraspecies and intraspecies-adjacent levels using fragmented sequences. It consists of a database-building module and a classification module. In database building, labeled nucleotide sequences are mapped to a reference, single nucleotide polymorphism statistics are generated, and a probability model linking SNPs to classification groups is built with Hidden Markov Models and solved by maximum likelihood. Database performance is estimated with three replicates of two-fold cross-validation, computing sensitivity, specificity, precision, and accuracy. In classification, Clasnip accepts genes, short fragments, contigs, and whole genomes, and reports a classification probability plus a multilocus sequence typing table for SNPs [16].
The standout design feature is automatic performance statistics. Most classifiers ship with a published accuracy number from the authors' own test set. Clasnip computes cross-validated metrics for the specific database you build, which is what you need when your organism, your sampling region, or your sequence fragments differ from anything previously benchmarked [16].
eSNaPD for Metagenomic Biosynthetic Discovery
eSNaPD (environmental Surveyor of Natural Product Diversity) is a web-based bioinformatics and data aggregation platform for mining metagenomes for natural product biosynthetic gene clusters. Using PCR-generated sequence tags, its pipeline profiles biosynthetic diversity by comparing sequence tags to a reference dataset of characterized gene clusters. Modules for sample mapping, molecule discovery, library mapping, and new clade visualization support identification of environments rich in untapped biosynthetic diversity and targeted molecule discovery efforts [17].
Because it aggregates data across submissions, eSNaPD also functions as a community atlas. That aggregation model, where each new analysis enriches the shared reference, foreshadowed how many specialized platforms now add value beyond single-job computation [17].
RepRanger for Repetitive Elements
Repetitive extragenic palindromic (REP) sequences, first discovered in intergenic regions of Escherichia coli, are short palindromic elements whose biological roles remain incompletely understood. RepRanger is a web-based platform built to rapidly identify and annotate putative palindromic elements, including REPs, in microbial genomes. Using it, the authors identified more than 4,000 REPs in the E. coli MG1655 genome and found that 81 of its 157 small noncoding RNAs, about 52 percent, contain REPs. Their analysis yielded 10 REP consensus motifs, with REPs positioned for possible translational control, within 15 nucleotides downstream of an open reading frame, predominantly hosting motif 4, while REPs in sRNAs predominantly encoded motif 9. Putative targets of REP-containing sRNAs included genes that rewire metabolic pathways in response to environmental change [11].
RepRanger illustrates why niche web tools persist. Before it existed, the authors noted there was no online tool for REP identification, despite the growing number of microbial genome projects. If your question falls in a niche, check the recent literature for a purpose-built platform before forcing a general tool to do a specialized job [11].
Design Tools: Primers, Proteins, and Structures
The Kalendar Platform for PCR and Primer Design
A 2025 paper in Molecular Therapy Nucleic Acids presents a comprehensive web-based platform integrating molecular biology tools for PCR-based applications. Its scope is unusually broad: custom multiplex tiling PCR panel design for amplicon sequencing, loop-mediated isothermal amplification (LAMP) primer design with support for loop primers targeting eight distinct regions of the DNA template, allele-specific PCR genotyping assay development for single nucleotide polymorphisms, insertions and deletions, multi-nucleotide variants, and haplotypes, Gibson assembly design, oligonucleotide analysis and design, and de novo identification, classification, and visualization of repetitive sequences. The platform supports standard, multiplex, reverse, long-range, quantitative fluorescence (TaqMan and MGB probe) PCR, and bisulfite PCR, and includes in silico PCR to verify primer and probe specificity for applications such as homology-based gene discovery, molecular diagnostics, DNA profiling, and repeat identification. The multiplex tiling PCR module is optimized for both second-generation and third-generation sequencing [10].
For wet-lab molecular biologists, this is the platform category where a wrong tool choice has the most direct cost, because bad primers waste synthesis orders and validation experiments. The in silico PCR module, which simulates amplification against real sequence databases before you order oligos, is the single most valuable check available at the design stage [10].
PSAT for Protein Annotation
The Protein Sequence Annotation Tool (PSAT) is a web-based meta-server for high-throughput sequence annotation. It combines results from several sequence-based annotation and function prediction programs to provide functional annotations and enzyme predictions, specifically enzyme commission predictions, over large input protein FASTA datasets. The authors demonstrated the platform by annotating predicted proteins from Herbaspirillum sp. strain RV1423, importing the results into EC2KEGG, and using the resulting functional comparison to identify a putative catabolic pathway that distinguished RV1423 from a well-annotated relative [18].
PSAT occupies a useful middle ground. When you have thousands of predicted proteins from a draft genome, single-sequence web tools are too slow, and full automated annotation pipelines are more than you need. A meta-server that aggregates multiple annotation methods across a whole proteome, then supports pathway-level interpretation, is a practical compromise [18].
LiBiSCo for Protein-Ligand Interactions
LiBiSCo (Ligand Binding Site Comparison) is a web tool for comparing the amino acid residues interacting with the atoms of a ligand across different protein-ligand complexes in the Protein Data Bank. Input is one or several PDB IDs, and the tool returns identified interactions at the ligand atom level, both bonded and non-bonded, and provides a sequence profile of the interaction for each ligand atom as a WebLogo. Its stated use is understanding ligand binding specificity and structural promiscuity among protein families that are structurally unrelated [12].
This is a narrow, well-defined tool, and that is its virtue. Rather than trying to rank binding sites by overall similarity, it answers a residue-level question: which amino acids contact which ligand atoms, consistently, across a protein family [12].
Data-Driven Platforms and Databases With Built-In Analysis
dictyExpress
dictyExpress 2.0 is a web application for exploratory analysis of gene expression data in Dictyostelium discoideum and related organisms, including ChIP-seq data. Its visualization modules cover time course expression profiles, clustering, gene ontology enrichment, differential expression, and experiment comparison, and all visualizations are interconnected so that selecting genes in one module propagates instantly to the others. It stores data from over 800 Dictyostelium experiments and links reciprocally with dictyBase, the model organism knowledgebase. The accompanying GenBoard application extends the framework for general NGS data management [19].
dictyExpress demonstrates the model-organism platform pattern: curated local data, interactive linked visualizations, and tight integration with an authoritative gene database. Similar patterns recur in crop and pathogen platforms.
TefDB for an Under-Resourced Crop
The Tef Database (TefDB) is a centralized web platform for Eragrostis tef, an indigenous Ethiopian cereal that lacked a unified web resource compared with major crops. It integrates 77,795 tef-specific biological records, including 1,372 literature entries, 6,144 genome-related records, 66,455 gene models, 3,447 protein sequences, and 377 chemical and pathway entries, and provides interactive visualization, search, filtering, download, and analysis tools. It was built with React.js on the frontend, Django and Python on the backend, and PostgreSQL for data management, guided by Design Science Research methodology with iterative input from prospective users [9].
TefDB matters to this comparison because it shows the full modern stack of a web platform, which is useful if your lab needs to build one rather than use one [9].
PPTdb for Pathogenic Protist Transporters
The Pathogenic Protist Transmembranome database (PPTdb) analyzed over one million protein sequences from 139 protists to annotate putative transmembrane proteins using primary sequence alignment, conserved secondary structural elements, and functional domains. It provides hierarchical transporter classification (TC) numbers, protein sequences, functional annotations, conserved domains, batch sequence retrieval, and downloads, plus analytical tools including transmembrane ability evaluation, annotation of unknown proteins, informative visualization charts, and iterative functional mining of host-pathogen transporter proteins [8].
PPTdb fills a genuine gap, since no centralized protist membrane transporter database existed before it, and it doubles as an analysis platform rather than a static lookup [8].
Graph and Pangenome Platforms
PG2 for Pangenome Graph Visualization
As whole-genome assembly has become inexpensive, pangenomes capturing haplotype-resolved variation across collections of related genomes have become practical. PG2 (PanGenoGrapher) is an open-source web-based platform implementing algorithms for effective layout and visual analysis of pangenome graphs. The authors position graph-based representations as aids for exploring sequence relationships, patterns, and variation, supporting tasks such as read mapping, variant calling, and genotyping in pangenomic frameworks [20].
PanGraphRNA for Pangenome-Aware RNA-seq
PanGraphRNA extends the graph pangenome concept to transcriptomics. Built on the Galaxy web-based framework, it provides modules for constructing, evaluating, and applying graph pangenomes at different population scales, enabling accessibility, traceability, and reproducibility. Applied to real and simulated Arabidopsis RNA-seq datasets, it outperformed a single linear reference genome approach, achieving higher read alignment accuracy and more precise gene expression quantification, and it enabled identification of drought stress-induced genes and flowering time-related quantitative trait loci that the linear reference missed. The authors also applied it to rice and maize datasets and provide standardized, containerized workflows [4].
This pairing of papers marks the current frontier of web-based sequence analysis. When your species has substantial structural variation relative to its reference genome, a graph pangenome platform on a web framework can recover biology that a linear-reference pipeline systematically loses [20] [4].
Side-by-Side Comparison of the Leading Platforms
The table below is the core of this bioinformatics tools comparison. Choose the row that matches your data type and question.
| Platform | Primary focus | Typical input | Key outputs | Best for | Skill floor |
|---|---|---|---|---|---|
| , - | , - | , - | , - | , - | , - |
| EMBL-EBI Job Dispatcher [1] | Similarity search and multiple sequence alignment | FASTA sequences | BLAST/FASTA/PSI-BLAST hits, Clustal Omega alignments, MView views | Routine search and alignment, teaching, quick checks | Beginner |
| EDGE [5] | Integrated NGS workflows | Reads, assemblies, metagenomes | Preconfigured workflow outputs with in-place visualization | Novices running complex multi-step analyses | Beginner to intermediate |
| NASQAR [6] | Interactive RNA-seq and multi-omics analysis | Count matrices, processed data | Interactive visualizations, DE results, workflows via R packages | Exploratory transcriptomics, including single-cell | Intermediate |
| H3NGST [2] | Automated ChIP-seq | BioProject ID or raw data | QC, alignments, peaks, genomic annotations | Turnkey ChIP-seq for TF binding and histone marks | Beginner |
| 16S-Pipeline [3] | End-to-end 16S amplicon analysis | Raw FASTQ | ASVs, SILVA taxonomy, diversity, five-method DA testing, PICRUSt2 | Microbiome community profiling from reads | Beginner to intermediate |
| SimpleMicrobiome [14] | Downstream microbiome statistics | Abundance, taxonomy, metadata tables | Diversity, ANCOM-BC2/MaAsLin2, Random Forest with SHAP, networks | Publication figures and models from feature tables | Intermediate |
| FastGroupII [15] | 16S library dereplication | 16S rDNA sequences | Dereplicated groups, rarefaction, Shannon-Wiener, Chao1 | Rapid dereplication and diversity indexing | Beginner |
| PneusPage [7] | S. pneumoniae WGS analysis | Pneumococcal genome data | Serotype, MLST, PBP typing, resistance, virulence, MGEs | Clinical and epidemiological pneumococcal typing | Beginner |
| Clasnip [16] | Intraspecies classification and MLST | Genes, fragments, contigs, genomes | Classification probability, SNP-based MLST table, cross-validated metrics | Screening closely related pathogens with partial sequences | Beginner to intermediate |
| Kalendar platform [10] | PCR and primer design, genotyping assays | Template sequences | Primers, probes, tiling panels, LAMP primer sets, in silico PCR | Assay design for diagnostics and amplicon sequencing | Beginner |
| PSAT [18] | High-throughput protein annotation | Protein FASTA (large sets) | Functional annotations, enzyme predictions, pathway comparison | Draft genome annotation and metabolic potential | Intermediate |
| eSNaPD [17] | Metagenomic biosynthetic mining | PCR sequence tags | Biosynthetic diversity profiles, clade visualization, atlas | Natural product discovery from metagenomes | Intermediate |
| RepRanger [11] | REP and palindromic element discovery | Bacterial and archaeal genomes | REP calls, consensus motifs, annotations | Repeat biology in microbes | Beginner |
| LiBiSCo [12] | Protein-ligand interaction comparison | PDB IDs | Atom-level interaction lists, WebLogo profiles | Binding site residue comparison across complexes | Beginner |
| dictyExpress [19] | Exploratory expression analysis | Model organism expression data | Linked interactive visualizations, clustering, enrichment | Dictyostelid and related expression exploration | Intermediate |
| TefDB [9] | Tef crop data and analysis | Web queries | Gene models, sequences, chemicals, pathways, search and filters | Tef research and breeding support | Beginner |
| PPTdb [8] | Protist membrane transporter analysis | Web queries, protein sequences | TC classification, domains, mining tools | Host-pathogen transporter studies | Beginner |
| PG2 [20] | Pangenome graph layout and visualization | Pangenome graphs | Effective layouts, visual analyses | Exploring haplotype-resolved pangenomes | Intermediate |
| PanGraphRNA [4] | Graph pangenome RNA-seq | RNA-seq plus pangenome graphs | Alignment, quantification, containerized workflows | Reducing reference bias in transcriptomics | Intermediate |
How to Choose: The Criteria That Decide Real Choices
Match the platform to your input data type
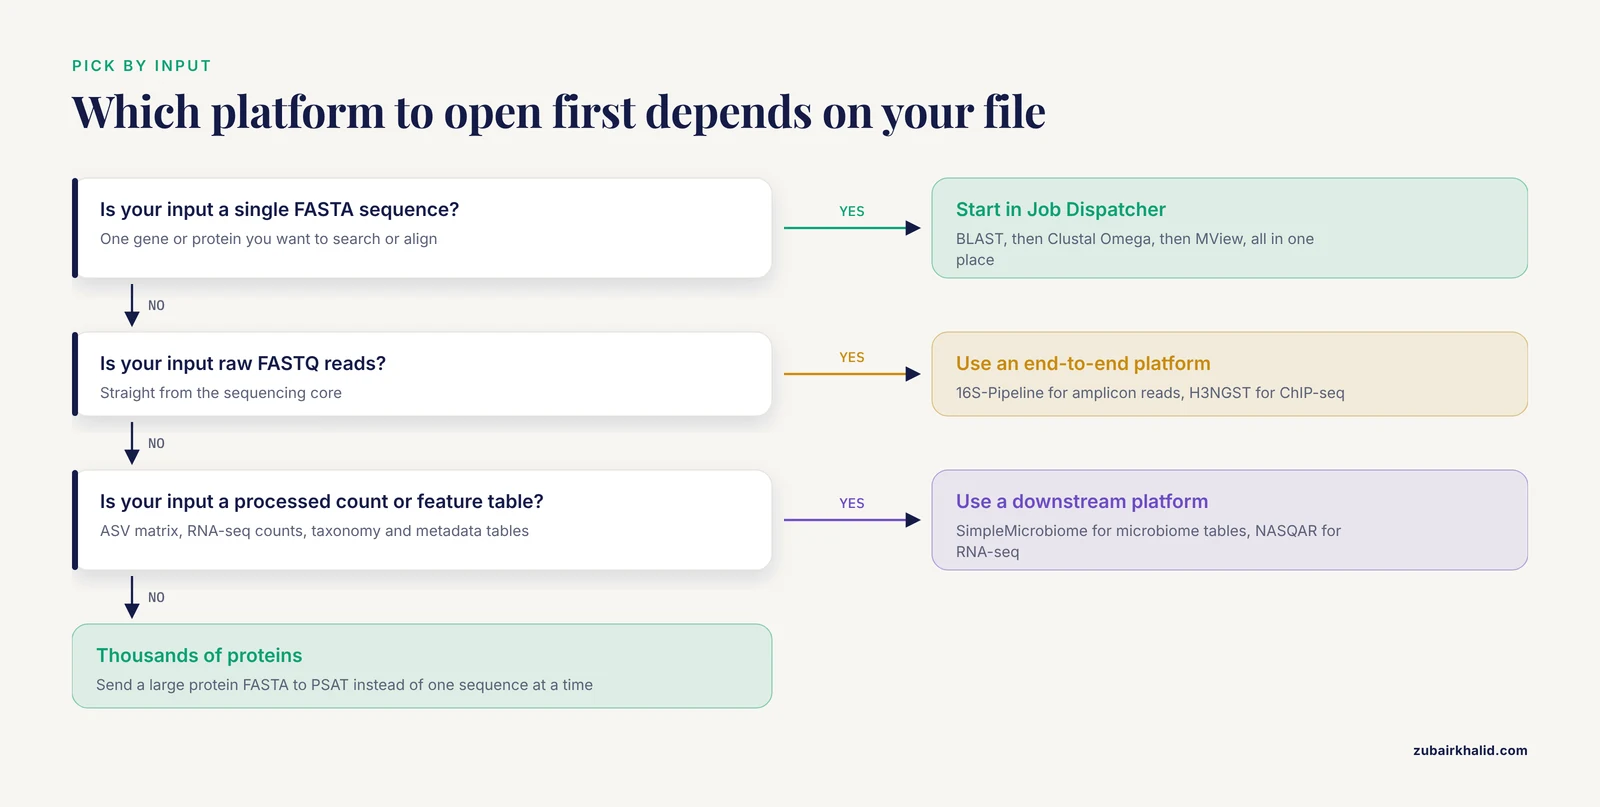
Start from your file, not from the tool. Raw reads in FASTQ format point you at end-to-end platforms such as 16S-Pipeline or H3NGST [3] [2]. Processed tables, such as an ASV count matrix or an RNA-seq count matrix, point you at downstream interactive platforms such as SimpleMicrobiome or NASQAR [6] [14]. A single FASTA sequence points you at Job Dispatcher for search and alignment [1]. A protein FASTA of thousands of predicted genes points you at PSAT rather than running one sequence at a time through individual annotators [18].
Judge chaining, not just features
The single-analysis capability of two platforms is often equivalent. The difference shows up at step two. Job Dispatcher's documented BLAST-to-Clustal Omega-to-MView workflow means your search hits become an alignment without export or reformatting [1]. dictyExpress propagates gene selections between linked visualizations instantly [19]. SimpleMicrobiome propagates preprocessing choices across all downstream modules [14]. Platforms designed around data flow save hours and eliminate a whole class of transcription errors.
Check what the platform automates versus what it hides
Automation is a gain when the automated choices match expert practice. 16S-Pipeline automates detection of sequencing type, variable region, and platform, then applies DADA2 and SILVA v138.1, choices that match community standards [3]. PneusPage automates a typing chain that independent comparison against PathogenWatch validated with high concordance [7]. Clasnip goes further and reports cross-validated performance statistics for the database you build, so automation comes with an audit trail [16]. Where a platform hides its choices entirely and offers no benchmark, treat its output as a hypothesis, not a result.
Consider where the data lives
Large FASTQ files upload slowly. Platforms that accept accession identifiers and fetch data server-side, as H3NGST does with BioProject IDs and 16S-Pipeline does with NCBI SRA integration, remove that bottleneck entirely [3] [2]. If your data are already public, prefer platforms with built-in retrieval. If your data are sensitive, such as clinical isolates, weigh the institutional policy on uploading to third-party servers before committing, and check whether an open-source release with a Docker image exists, as NASQAR provides, so you can host locally [6].
Verify the reference databases and versions
Taxonomy assignment is only as current as its database. SILVA v138.1 in 16S-Pipeline is a specific, named version, which is exactly the information you should expect from any serious platform and record in your methods [3]. Serotyping, MLST, and resistance calling in PneusPage depend on curated schemes, and its concordance statistics with PathogenWatch tell you the two agree, not that either matches some external ground truth [7]. Before publishing, note database versions and dates for every web tool you used.
Worked Scenarios
Scenario 1: Characterizing a newly sequenced gene
You have a 1,800 bp coding sequence from a novel isolate and want to know what it does. Start in Job Dispatcher: run NCBI BLAST+ against the appropriate protein databases to find homologs, then take the top hits forward with Clustal Omega for a multiple sequence alignment, and view the result in MView to spot conserved residues and motifs [1]. If PSI-BLAST reveals a distant family membership that plain BLAST missed, that changes the annotation story [1]. This entire chain is three web submissions, no installations.
Scenario 2: Profiling a microbiome from raw amplicon reads
Your sequencing core returns paired-end 16S FASTQ files. Submit them to 16S-Pipeline, which detects the variable region and platform automatically, trims primers, infers ASVs with DADA2, assigns taxonomy against SILVA v138.1, builds the phylogenetic tree, and runs diversity and differential abundance analyses with a five-method consensus [3]. If you later receive a colleague's processed feature table from a different study and want to combine analyses, move to SimpleMicrobiome, which accepts abundance, taxonomy, and metadata tables and keeps preprocessing consistent across every downstream module [14].
Scenario 3: Typing a clinical pneumococcal isolate
Your lab sequences a Streptococcus pneumoniae isolate and needs serotype, sequence type, and resistance determinants quickly. PneusPage automates species prediction, molecular typing, resistance determination, and virulence and mobile genetic element detection in one submission, with published high concordance against PathogenWatch for serotype and MLST [7]. For fragmented sequences, contigs, or short reads from a mixed sample where full assembly is impractical, Clasnip can classify against a database you build and report cross-validated sensitivity, specificity, and precision alongside the typing result [16].
Scenario 4: Designing a tiling amplicon panel for sequencing
You need to amplify a viral genome across its full length with a multiplex tiling panel compatible with both Illumina and nanopore sequencing. The Kalendar platform designs multiplex tiling PCR panels optimized for second- and third-generation sequencing, checks specificity with in silico PCR, and covers the adjacent needs of the same project, including LAMP primer sets with loop primers targeting eight template regions and TaqMan or MGB probe assays for quantitative work [10]. Designing everything in one platform keeps primer properties, dimer checks, and specificity checks consistent across the panel.
Scenario 5: Quantifying expression in a variable population
You are studying drought response in Arabidopsis accessions with known structural variants relative to the reference genome. A linear-reference pipeline undercounts reads mapped into variant-rich regions. PanGraphRNA, built on the Galaxy framework, lets you construct a graph pangenome from your accessions, then align and quantify RNA-seq against it, with the authors reporting higher alignment accuracy and more precise quantification than a single linear reference, plus recovery of stress-responsive genes and trait-associated loci that the linear approach missed [4]. Because it runs on Galaxy, every step is recorded for reproducibility [4].
Scenario 6: Screening a metagenomic library for biosynthetic novelty
You have PCR-amplified biosynthetic gene tags from a set of soil metagenomes and want to know which environments hold unexplored biosynthetic diversity. eSNaPD maps your tags against its reference dataset of characterized gene clusters and provides sample mapping, library mapping, and clade visualization modules, contributing your data to a broader biosynthetic diversity atlas in the process [17].
Common Mistakes and Limitations
Submitting the wrong molecule to a search tool. Nucleotide queries against protein databases require translation and careful database choice. Newcomers frequently search a nucleotide sequence directly against a protein database without using the appropriate translated search mode, then conclude no homolog exists. The Job Dispatcher protocols exist precisely because these mode choices trip people up [1].
Treating a single differential abundance method as truth. Different statistical methods for differential abundance disagree regularly. The 16S-Pipeline design, which runs five methods and reports consensus, exists because single-method results are fragile. If your platform of choice offers only one method, run the same question through a second tool such as SimpleMicrobiome before believing a taxon-level claim [3] [14].
Ignoring database version drift. A BLAST hit list, a SILVA assignment, or a serotype call is a function of the database snapshot, not just the sequence. Two analyses run six months apart can differ because the database changed. Record the platform, tool version, and database version for anything you publish [7].
Assuming web results transfer perfectly to local reruns. Web platforms fix defaults that a command-line user can change. If a reviewer or collaborator reruns your analysis locally with different parameters, results can shift. Prefer platforms built on traceable frameworks, such as PanGraphRNA on Galaxy, which records parameters and containerized workflows as part of the analysis [4].
Uploading data you are not permitted to upload. Human subject data, clinical isolates, and embargoed sequences may be restricted from third-party servers. Check whether the platform offers an institutional or self-hosted deployment, as NASQAR does through its GitHub codebase and Docker image, before sending restricted data [6].
Over-trusting automated resistance or phenotype calls. PneusPage's own validation showed 88.8 percent concordance for penicillin-binding protein typing, the lowest of the categories tested. Automated inferences of resistance or virulence are decision-support, not diagnoses, and need laboratory confirmation [7].
Using niche tools for general questions, or general tools for niche questions. RepRanger exists because no general tool handled REP identification well online [11]. Conversely, using a purpose-built typing platform for an organism it was not designed for wastes time. Read the platform's stated scope before submitting.
Forgetting that web platforms are living services. Seahawk, a well-regarded platform in 2007, is no longer the way anyone chains web services, yet the field it helped define moved on [13]. Export your intermediate results, save your job identifiers, and note URLs and dates. Plan for the possibility that a favorite tool disappears or changes.
Skipping the exploratory pass. Interactive platforms reward exploration. dictyExpress's linked visualizations and NASQAR's interactive R-based apps exist because the first answer is rarely the final one. Looking at the same data through two visual lenses catches artifacts that a single static output hides [6].
The Broader Case for Web-Based Analysis
The platforms above share a design lineage. FastGroupII in 2006 automated dereplication and diversity indices that researchers previously assembled by hand [15]. Seahawk in 2007 argued that data should flow between web services without manual reformatting [13]. EDGE in 2016 assembled preconfigured NGS workflows behind a friendly interface [5]. Job Dispatcher in 2026 documents complete teaching protocols for the most fundamental analyses in the field [1]. 16S-Pipeline, SimpleMicrobiome, H3NGST, PneusPage, PanGraphRNA, and PG2 in the mid-2020s push end-to-end automation, graph-based references, and interactive statistics into domains that were command-line-only five years earlier [7] [20] [3] [14] [4] [2].
The trajectory is consistent. Each generation moves expert knowledge, formerly embedded in scripts and configuration files, into the platform itself, and exposes more of the audit trail, such as versioned databases and cross-validated performance metrics, back to the user. The best web-based bioinformatics platforms for sequence analysis in 2026 are not simplified toys. They are production tools whose main limitation is scope, not accuracy, and the skill that matters most is knowing which platform's scope matches your question.
Frequently Asked Questions
What are the best web-based bioinformatics platforms for sequence analysis?
There is no single best platform, because the right choice depends on your data and question. For core similarity search and multiple sequence alignment, the EMBL-EBI Job Dispatcher framework is the strongest general starting point [1]. For raw 16S amplicon data, 16S-Pipeline offers the most complete automated workflow [3]. For transcriptomics exploration, NASQAR provides interactive R-based analysis [6]. For pathogen typing and specialized questions, purpose-built platforms such as PneusPage, Clasnip, and the Kalendar PCR design platform outperform general tools at their specific tasks [10] [7] [16].
Do I need to install anything to use these platforms?
No. The defining feature of these platforms is that analyses run on remote servers through your browser. The Job Dispatcher workflows are documented as running directly on the web without installing any bioinformatics software [1], and H3NGST was designed to eliminate the need for local installations, programming skills, or large file uploads entirely [2].
Are web-based tools as accurate as command-line versions?
When the web platform wraps the same underlying programs, accuracy is equivalent, because the math is identical and only the interface differs. The reliability question is actually about automation choices, parameters, and database versions. The best protection is to use platforms that expose or validate those choices, such as Clasnip's cross-validated performance statistics [16] or PneusPage's published concordance benchmarks [7].
Can web platforms handle raw FASTQ files?
Many do. 16S-Pipeline accepts raw FASTQ files from paired-end, single-end, and long-read 16S sequencing and carries them through to publication-ready statistics [3]. H3NGST handles raw ChIP-seq data and can even retrieve public datasets itself from a BioProject ID, avoiding large uploads [2]. For very large mammalian-scale datasets, check each platform's upload limits, and consider platforms with built-in public data retrieval when your data are already deposited.
What is the difference between a general platform and a niche platform?
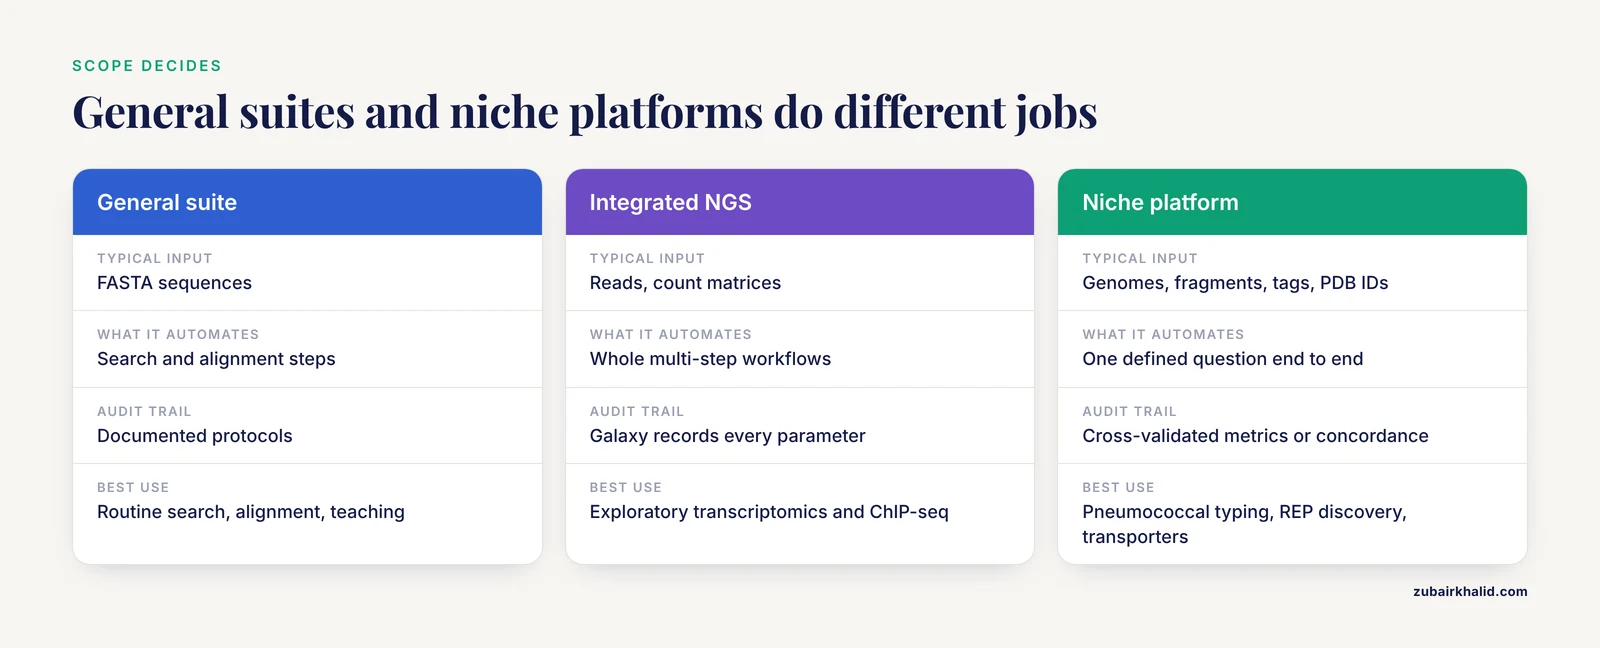
A general platform covers broad, recurring tasks such as searching and aligning sequences, and it is the right tool when your question fits standard workflows [1]. A niche platform encodes deep domain expertise for a defined question, such as pneumococcal typing [7], REP element discovery [11], or transporter classification in protists [8], and it will outperform general tools within its scope. Use general platforms first, then reach for niche platforms when your question names a specific organism, molecule class, or assay type.
How reproducible is an analysis done through a web interface?
Reproducibility depends on the platform's design. Platforms built on workflow frameworks, such as PanGraphRNA on Galaxy, provide accessibility, traceability, and reproducibility with standardized containerized workflows [4]. Platforms with self-contained automation, such as 16S-Pipeline, reduce parameter drift by fixing expert defaults [3]. For any platform, record the tool version, database version, parameters, and job identifiers at the time of analysis, because web services evolve and results can change as their underlying databases are updated.
Sources
- Using the Job Dispatcher Web Interfaces for Sequence Analysis.
- H(3)NGST: a fully automated, web-based platform for end-to-end ChIP-seq analysis.
- 16S-Pipeline: A comprehensive web-based platform for end-to-end 16S rRNA amplicon sequencing analysis.
- PanGraphRNA: An efficient and flexible bioinformatics platform for graph pangenome-based RNA-seq data analysis.
- Enabling the democratization of the genomics revolution with a fully integrated web-based bioinformatics platform
- NASQAR: a web-based platform for high-throughput sequencing data analysis and visualization
- PneusPage: A WEB-BASED TOOL for the analysis of Whole-Genome Sequencing Data of Streptococcus pneumonia.
- Pathogenic Protist Transmembranome database (PPTdb): a web-based platform for searching and analysis of protist transmembrane proteins.
- Developing a web-based platform for Eragrostis tef resource management and analysis.
- Comprehensive web-based platform for advanced PCR design, genotyping, synthetic biology, molecular diagnostics, and sequence analysis.
- Comprehensive analysis of repetitive extragenic palindrome sequences identified in bacteria and archaea using a new web-based tool, RepRanger.
- Ligand Binding Site Comparison - LiBiSCo - a web-based tool for analyzing interactions between proteins and ligands to explore amino acid specificity within active sites
- Seahawk: moving beyond HTML in Web-based bioinformatics analysis
- SimpleMicrobiome: An integrated web-based platform for streamlined microbiome data analysis and visualization.
- FastGroupII: A web-based bioinformatics platform for analyses of large 16S rDNA libraries
- Clasnip: a web-based intraspecies classifier and multi-locus sequence typing for pathogenic microorganisms using fragmented sequences.
- eSNaPD: a versatile, web-based bioinformatics platform for surveying and mining natural product biosynthetic diversity from metagenomes
- Protein Sequence Annotation Tool (PSAT): a centralized web-based meta-server for high-throughput sequence annotations
- dictyExpress: a web-based platform for sequence data management and analytics in Dictyostelium and beyond
- PG2: algorithms and a web-based tool for effective layout and visual analysis of pangenome graphs.