SAS vs R for Clinical Trial Data Analysis
By Dr. Zubair Khalid, DVM, MS, PhD ·

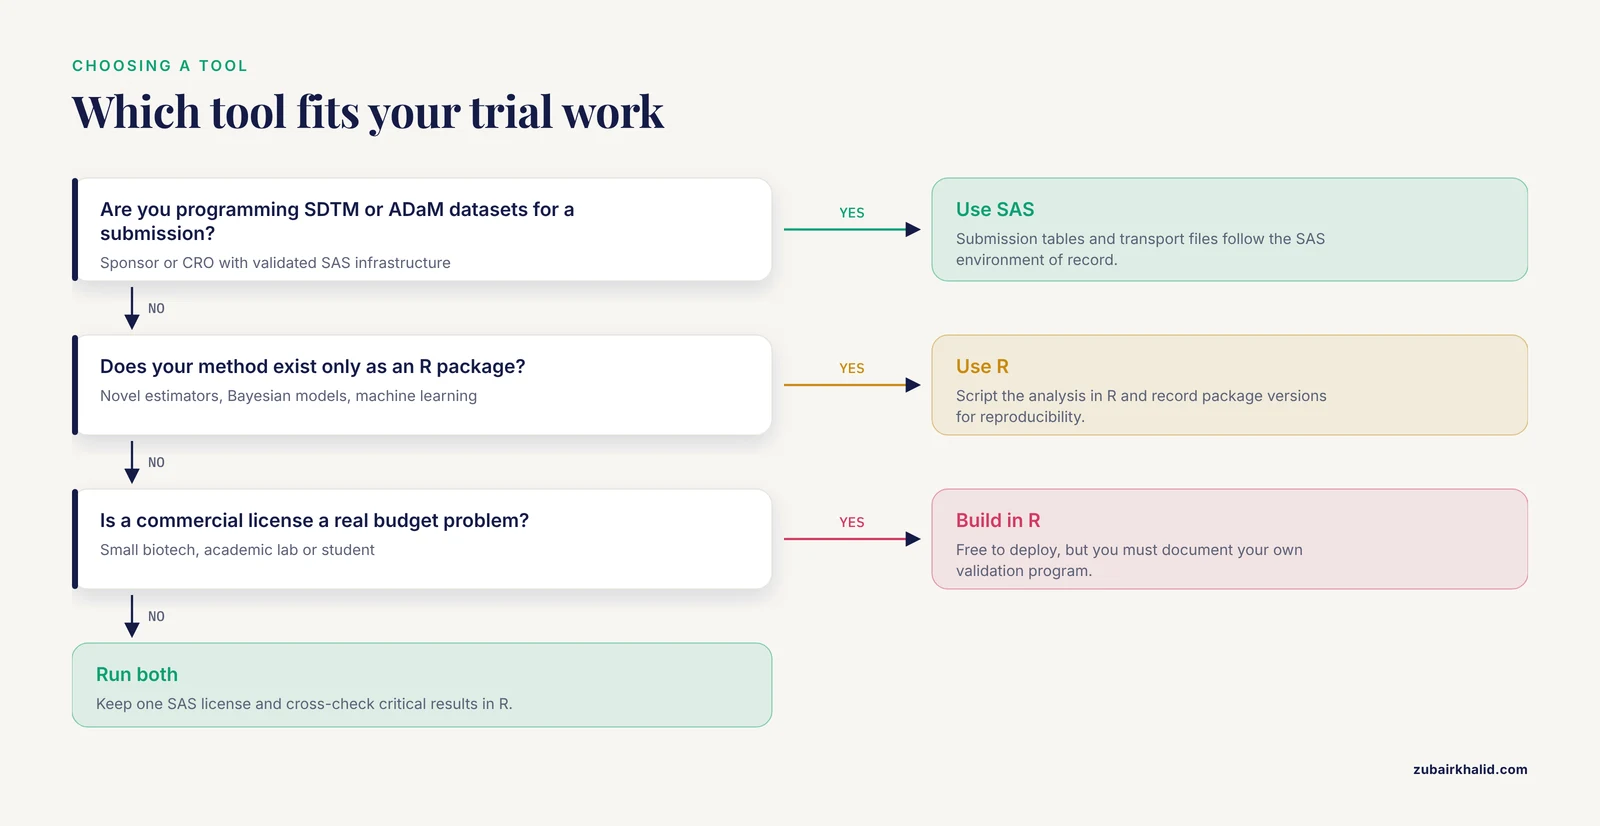
SAS is a commercial statistical platform built for regulated, submission-ready clinical work, while R is a free, open-source language built for flexible, scriptable analysis of any data. The practical rule of thumb is simple: if you are programming tables and datasets for a regulatory submission at a sponsor or contract research organization, you will almost certainly use SAS. If you are exploring data, running novel analyses, or working in an academic or small-biotech setting, R is usually the faster and cheaper choice. Many statisticians eventually learn both, because the difference between SAS and R for clinical trials is less about statistical capability and more about where each one fits in a regulated workflow.
Why the SAS or R Question Matters in Clinical Research
Clinical trial data analysis sits at the intersection of statistics, programming, and regulation. Every result that goes into a marketing application must be traceable, reproducible, and auditable. The software you choose affects how you meet those expectations, how much your organization pays, how quickly you can respond to reviewer questions, and even which jobs you qualify for.
The Food and Drug Administration removed a long-standing source of confusion in 2015 when it issued a clarifying statement on statistical software. The agency does not require any specific software for statistical analyses, and it explicitly names R and S-PLUS as examples of acceptable packages, provided the sponsor verifies that the software produces valid results. That statement matters for anyone weighing SAS or R for clinical trials, because it means the choice is driven by workflow, cost, and workforce considerations rather than a regulatory mandate.
This article walks through each tool on its own terms, compares them side by side on the criteria that decide real-world choices, works through concrete scenarios, and closes with the mistakes people most often make when moving between the two.
What SAS Is
SAS (Statistical Analysis System) is a commercial software suite developed by SAS Institute, first released in the 1970s and now deeply embedded in the pharmaceutical and biotechnology industries. It combines a data management language, a large library of statistical procedures, and a job-control framework for running batch programs on servers.
How SAS Works
SAS programs are built from DATA steps, which read, transform, and merge datasets, and PROC steps, which run analyses. A typical clinical programming task might look like this:
proc sort data=adsl;
  by usubjid;
run;

proc means data=adsl mean std min max;
  var age weight;
  by trt01p;
run;
Analyses such as logistic regression (PROC LOGISTIC), survival analysis (PROC PHREG), mixed models (PROC MIXED and PROC GLIMMIX), and repeated-measures models are all handled through these procedures. SAS returns p-values, confidence intervals, and estimates to a documented precision, and the output format has been stable for decades, which is one reason reviewers and statisticians trust it in regulatory contexts.
Where SAS Shines
- Submission infrastructure. SAS datasets in the version 5 transport format (
.xptfiles) are the de facto standard for deliverables that follow CDISC standards, the data model used in FDA and PMDA submissions. CDISC defines the SDTM (Study Data Tabulation Model) for raw tabulations and ADaM (Analysis Data Model) for analysis-ready datasets. SAS tooling for producing, checking, and documenting these datasets is mature and widely validated. - Batch processing at scale. Large Phase 3 trials can generate millions of records. SAS runs efficiently on server farms as scheduled batch jobs, and sponsors have decades of legacy code, validated macros, and standard programs built around it.
- Traceability and validation. SAS Institute maintains formal documentation of its algorithms, and regulatory auditing of SAS-based pipelines is routine and well understood across the industry.
- A stable workforce. Job postings for statistical programmers at sponsors and contract research organizations overwhelmingly list SAS as a required skill. The SAS Certified Clinical Trials Programmer credential exists specifically for this field.
What R Is
R is a free, open-source programming language and environment for statistical computing and graphics, maintained by the R Foundation and the R Core Team. It was created in the early 1990s as an implementation of the S language and is now extended by more than twenty thousand user-contributed packages on CRAN, the Comprehensive R Archive Network.
How R Works
R is a full programming language. You write scripts that load data, transform it, fit models, and produce output. A simple example:
library(survival)
cox_model <- coxph(Surv(time, event) ~ trt + age, data = adtte)
summary(cox_model)
The tidyverse collection of packages (including dplyr and ggplot2) dominates modern data manipulation and visualization. For clinical work specifically, the admiral package implements CDISC ADaM dataset creation in R, and packages such as haven read and write SAS transport files and .sas7bdat datasets, which makes interoperability between the two systems practical.
Where R Shines
- Cost. R is free under the GNU General Public License. There are no seat licenses, no renewal fees, and no per-user charges for servers or pipelines.
- Cutting-edge methods. New statistical methods almost always appear as R packages first. Bayesian hierarchical models, machine learning approaches, and novel estimands in line with the ICH E9(R1) addendum on estimands often have R implementations years before equivalent SAS procedures exist.
- Reproducible reporting. Tools like R Markdown and Quarto let you write a report in which the code, the results, and the narrative live in one document that regenerates itself when the data change. This is a major advantage for exploratory work, publications, and internal decision-making.
- Data visualization. The
ggplot2package produces publication-quality graphics with a consistent grammar, and its flexibility exceeds what most SAS users expect fromPROC SGPLOT. - Interdisciplinary reach. R is the lingua franca of academic biostatistics, epidemiology, genomics, and data science, so skills transfer across research careers.
Side-by-Side Comparison
| Criterion | SAS | R |
|---|---|---|
| License model | Commercial, per-seat annual licenses with negotiated pricing | Free and open source (GPL) |
| Regulatory standing | Industry default, decades of precedent in submissions | Explicitly acceptable to the FDA per its 2015 clarifying statement |
| CDISC submission support | Mature, industry-standard tooling | Growing, with packages such as admiral for ADaM |
| Learning curve | Gentler entry, structured procedures | Steeper start, requires general programming comfort |
| Syntax character | Declarative procedure calls | Full programming language |
| Graphics | Strong, procedure-based | Excellent, grammar-based (ggplot2) |
| New statistical methods | Appear after formal development cycles | Appear first, as community packages |
| Validation burden | Vendor-supported, established audit precedent | User- or organization-validated |
| Batch and server processing | Long-standing, purpose-built | Achievable, requires more engineering |
| Community and support | Paid technical support from SAS Institute | Free community forums, Stack Overflow, package documentation |
| Industry job demand | Required for most statistical programming roles | Increasingly requested, standard in biostatistics and data science |
| Reproducible documents | Achievable with effort | Native through R Markdown and Quarto |
Regulatory Acceptance and Validation
The most common question in any SAS vs R discussion is whether regulators accept R. The answer, based on official FDA documentation, is yes. The FDA's 2015 clarifying statement on statistical software states that the agency does not require any particular statistical software, and it names R and S-PLUS as examples of packages that have been used successfully in submissions. ICH E9, the international guideline on statistical principles for clinical trials, focuses on the validity of the analysis rather than the brand of software used to produce it.
What regulators do expect is that the software performs as intended. Under good clinical practice principles codified by ICH, computerized systems used in trials must be validated. For SAS, validation is largely handled by the vendor and by decades of collective industry experience. For R, the open-source model means no single vendor signs off on the software, so organizations that use R in a regulated context typically implement their own validation program. Common approaches include pinning specific package versions, running internal test suites against known results, documenting the R session and package versions for every analysis, and comparing key outputs against SAS for critical analyses.
In practice, a large share of submissions still arrives with SAS datasets and SAS-derived tables, because the industry's tooling, templates, and reviewer expectations grew up around SAS. R is increasingly present inside that pipeline, often for exploratory analyses, simulations, and programming-language-supported review work, and increasingly as the primary engine in newer, smaller organizations that have built R-based validated pipelines from scratch.
Comparing the Two on Criteria That Decide Real Choices
Cost and Licensing
SAS pricing is negotiated and varies by module, organization type, and region, but commercial licenses are a significant recurring expense, especially for large teams, and academic discounts have narrowed over the years. R costs nothing to obtain, deploy on unlimited machines, or run in the cloud. For a university lab, a student, or a startup, the difference between free and five-figure annual fees is often the deciding factor. For a large sponsor, the license cost is real but small relative to the cost of clinical trials themselves, which is why incumbency matters more than price in that setting.
Learning Curve and Workforce
SAS is easier to start with if you have never programmed. Its procedures hide the implementation details, its data step reads almost like a checklist, and its error messages are comparatively readable. R requires you to learn a programming language with concepts like vectorization, function scoping, and package management, which frustrates beginners before it empowers them.
The career calculus runs the other way. A statistical programmer role at a contract research organization typically requires SAS. A biostatistician role at a university or a modern biotech typically assumes R. The most employable profile is bilingual, because many organizations now run mixed environments and need people who can translate a SAS standard program into an R equivalent, or explain why two systems produce slightly different rounding in a table footnote.
Reproducibility and Automation
Both languages support reproducible analysis, but they approach it differently. SAS pipelines depend on ordered program execution, version-controlled code repositories, and macros that standardize repeated steps. R pipelines lean on scripts plus literate programming tools, dependency management through packages like renv (which locks package versions for a project), and containerization with Docker to freeze the entire computing environment.
R has a structural advantage here: because it is free, an entire analysis can be re-executed by anyone, anywhere, without a license. That matters for open science, journal peer review, and internal quality checks. SAS counterattacks on stability, since a validated SAS program written ten years ago will often run unchanged today, whereas an R script written ten years ago may need package updates before it runs at all.
Numerical Results and Comparability
Both systems produce statistically valid estimates. Differences arise at the margins. SAS and R sometimes differ in default handling of missing data, parameterization of categorical variables in models, rounding conventions, and floating-point precision, so a hazard ratio computed in PROC PHREG and in the R survival package will agree to the stated precision in nearly all cases but may differ in distant decimal places. The standard practice in mixed environments is to run key analyses in both systems during validation and document any differences, rather than assume they are errors.
Handling Big Data
Modern SAS installations process large datasets efficiently through server-based batch processing, and SAS has added in-memory and on-demand engines for very large data. R historically loaded everything into memory, which limited dataset sizes, but packages such as data.table and arrow, along with database connectors and cloud-native designs, have largely removed that ceiling for realistic clinical data. For the datasets typical of a Phase 3 trial, both systems perform adequately, and performance is rarely the deciding criterion.
Graphics and Reporting
For submission-ready tables, listings, and figures, SAS has highly standardized output that matches sponsor templates exactly, and tools for producing them are mature. R's gtsummary, gt, and flextable packages now generate comparable clinical tables, and ggplot2 produces better exploratory and publication graphics than anything in the SAS ecosystem. The gap in table production has narrowed considerably in recent years.
When to Use SAS
SAS is usually the right choice in these situations:
- You are programming SDTM or ADaM datasets and submission tables for an FDA or PMDA application, and your organization's validated infrastructure is SAS-based.
- You work at a sponsor or contract research organization where standard programs, macros, and legacy code are written in SAS and must be maintained.
- Your team needs vendor-supported software with a long audit trail in regulated environments, and the cost of validation for an alternative exceeds the license savings.
- You are building a career as a clinical statistical programmer, where SAS proficiency is a hiring requirement across the industry.
When to Use R
R is usually the right choice in these situations:
- You are an academic researcher, student, or small lab analyzing trial or cohort data without a commercial license budget, making R the best software for researchers on limited funds.
- Your analysis involves methods that exist only as R packages, such as modern Bayesian models, machine learning pipelines, or specialized survival estimators.
- You need reproducible, self-contained reports that regenerate automatically, for example for a scientific publication or a data monitoring committee meeting.
- Your organization is willing to invest in validating an R pipeline to reduce recurring license costs, a path increasingly taken by small biotechs and newer contract research organizations.
- Your work extends beyond clinical trials into genomics, real-world evidence, or data science, where R is the default tool.
Worked Scenarios
Scenario 1: Statistical Programmer at a Contract Research Organization
A programmer receives a mockup for a Phase 3 efficacy table showing the change from baseline in a primary endpoint by treatment arm, with p-values from an ANCOVA model. The deliverable must follow the sponsor's CDISC ADaM standard and pass quality control. The workflow is SAS from end to end: build the analysis dataset with DATA steps and PROC SQL, run PROC GLM or PROC MIXED for the model, produce the table with a standard macro, and generate an .xpt transport file. R appears only if the quality control process requires an independent check, in which case the same ANCOVA is run in R with lm() or emmeans() and the results are compared. Here the choice of SAS is not a preference, it is the environment of record.
Scenario 2: Academic Biostatistician on an Investigator-Initiated Trial
A university statistician analyzes data from an investigator-initiated trial with a novel adaptive design. No commercial procedure exists for the planned estimator, but a peer-reviewed R package implements it. The entire analysis is scripted in R, the report is generated with R Markdown so that the methods section and the code live together, and the package versions are recorded for reproducibility. SAS would either be incapable of running the method directly or would require custom programming that replicates what the R package already provides and documents.
Scenario 3: Small Biotech Choosing Its First Stack
A twenty-person biotech is preparing its first Phase 2 study and must decide on a statistical environment. SAS licenses for a programming team would be a meaningful line item, and the founders know that the FDA accepts R. They build an R-based pipeline using admiral for ADaM datasets, establish a validation program that verifies their key R outputs against known results, and keep one SAS license for reading legacy datasets and supporting partner deliverables. This mixed approach is increasingly common and reflects the real difference between SAS and R for clinical trials in modern practice.
Scenario 4: Cross-Checking a Critical Result
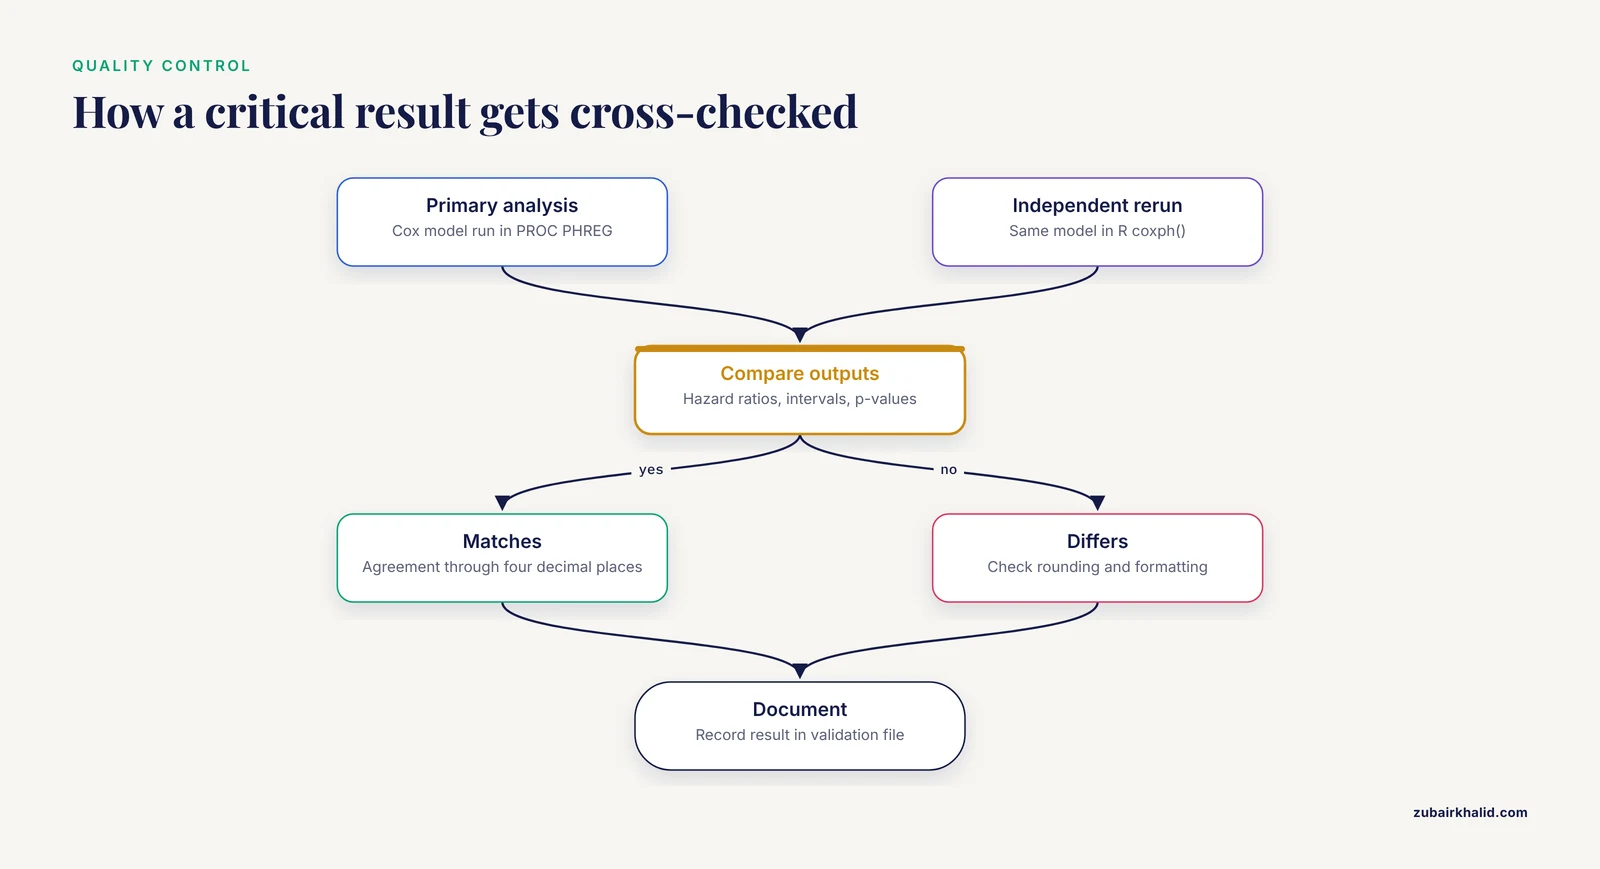
A biostatistician runs the primary Cox proportional hazards analysis in PROC PHREG and independently re-runs it in R's coxph() function as a quality control step. The hazard ratios and confidence intervals match to the reported precision, and the p-values agree through four decimal places. The dual-system agreement is documented in the validation file. This kind of cross-check is one of the healthiest uses of having both tools available.
Common Mistakes and Limitations
Assuming regulators demand SAS. The FDA's published position is that it does not require specific statistical software. Organizations choose SAS for workflow and precedent reasons, not because an agency mandates it.
Comparing a script to a procedure. A common frustration for people learning R after SAS is that a five-line SAS procedure requires a longer R script, and a five-line R data transformation requires convoluted SAS code. This reflects different design philosophies, not a capability gap.
Ignoring validation obligations in R. Downloading R and running an analysis does not satisfy the expectation that software used in regulated analyses is fit for purpose. Organizations need documented version control, test cases, and traceability. Skipping this step is the single biggest risk in R-based clinical pipelines.
Assuming outputs will match character for character. Small differences in rounding, formatting, or floating-point arithmetic between SAS and R are normal. Treat unexplained differences in estimates as findings worth investigating, but do not expect two systems to format a table identically.
Learning only one tool by accident. Many people learn SAS on the job and never touch R, or learn R in graduate school and assume it will carry them through any clinical programming role. Both assumptions limit career options in a field where mixed environments are the norm.
Confusing the language with the ecosystem. The practical difference between the two tools lies less in the statistics they can perform, which overlaps almost completely for standard trial analyses, and more in the surrounding infrastructure of validation, submission formats, hiring expectations, and cost.
One caution on scope. Software choice never substitutes for sound trial design and statistical review. Individual analyses, especially in regulated settings, need oversight from qualified statisticians who own the methods and the interpretation, whichever tool executes them.
Frequently Asked Questions
Do regulators require SAS for clinical trial submissions?
No. The FDA's 2015 clarifying statement says the agency does not require any specific statistical software and explicitly lists R as acceptable, provided sponsors can demonstrate that their software produces valid results. SAS remains the industry default because of infrastructure and precedent, not regulatory mandate.
Which is easier to learn, SAS or R?
SAS is easier for a complete beginner because its procedures hide complexity and its syntax is more structured. R is harder at first because it is a full programming language, but it rewards that investment with flexibility and a larger analytical ecosystem.
Can R fully replace SAS in a regulatory submission pipeline?
Technically yes, since the FDA accepts R and packages now exist for CDISC dataset creation and clinical tables. Practically, replacement requires the organization to build and document its own validation program and to manage reviewer expectations, so most organizations today run R alongside SAS rather than instead of it.
Do SAS and R give the same p-values and estimates?
Yes for standard analyses, up to the precision normally reported. Both implement the same underlying statistical theory. Minor differences can appear in distant decimal places or in formatting and rounding conventions, and mixed organizations routinely cross-validate key results between the two.
Should I learn SAS or R first for a career in clinical trials?
If your target role is statistical programming at a sponsor or contract research organization, learn SAS first because job postings require it. If your target is biostatistics or academic research, learn R first. The strongest long-term position is competence in both, since mixed environments are increasingly common.
Which is the best software for researchers on a tight budget?
R. It is free and open source, runs on any operating system, has no seat limits, and provides statistical and graphical capabilities that cover essentially all standard clinical and experimental analyses. SAS offers a free university edition for learning purposes, but commercial use requires a paid license.