How to Create a Lab Report Template with Data Analysis Sections
By Dr. Zubair Khalid, DVM, MS, PhD ·

By the end of this guide you will have a working lab report template with data analysis sections that you can reuse for coursework, thesis experiments, or industry bench work. You will build it in a text editor or word processor, pair it with a simple spreadsheet or Python script for the analysis, and end up with a document that takes raw measurements to a finished results section without you reinventing the structure every week.
Here is what you need on hand before starting:
- A text editor (Notepad, TextEdit, VS Code) or a word processor (Word, Google Docs, LibreOffice Writer)
- A spreadsheet program (Excel, Google Sheets) or Python 3 with pandas and SciPy installed
- Your raw data, ideally already recorded in a lab notebook or structured spreadsheet
- About two hours for the first build. Later reports should take minutes to set up.
Why a Template Beats Writing From Scratch
A lab report is a structured argument. It moves from question, to method, to evidence, to interpretation. When each report starts from a blank page, the argument structure drifts, and readers (instructors, reviewers, collaborators) have to hunt for the numbers. A fixed template solves this by making every section predictable.
The value of deliberate analysis planning shows up clearly in large collaborations. A tutorial written by a group of biostatisticians and biomedical scientists working on multi-lab preclinical trials found that the biggest statistical failures, such as unclear sample size calculations and unreported handling of differences between labs, come from planning gaps rather than calculation errors, and they recommend writing the analysis plan before data collection begins [1]. A template is the single-experiment version of that advice. It forces you to decide, before you see the data, what you will measure, which test you will run, and how you will report the outcome.
Templates also serve a teaching function. A study of fifth-grade science students in Taiwan compared two ways of using generative AI to support lab report writing. Students who worked through inquiry-based prompts produced reports with more precise terminology and deeper analytical writing, while students given procedural scaffolding produced clearer structure but shallower analysis [2]. The lesson for template design is direct: structure the format, but leave the reasoning sections open. Your template should never answer the discussion questions for you.
The Core Sections of a Lab Report Template
A complete research template for a lab report contains eight sections. Build each one as a heading with a short placeholder block underneath.
- Title and identifying information. Experiment name, date, operator, lab or course, and a version number for the template itself.
- Objective and hypothesis. One sentence for the question, one for the predicted outcome, and one for the alternative outcome you would accept as informative.
- Materials and methods. Reagents with concentrations, equipment with model numbers, and a numbered protocol that a stranger could repeat.
- Raw data record. A table with columns defined before the experiment starts, plus space for notes on deviations.
- Data processing. How raw values become analysis values. This includes unit conversions, exclusion rules, and any correction steps.
- Statistical analysis. The test you chose, why you chose it, the software and version, and the full output.
- Results. Figures and tables with descriptive captions, effect sizes, and confidence intervals.
- Discussion and conclusion. What the result means relative to the hypothesis, what could have gone wrong, and what to do next.
Sections 4 through 7 form the data analysis block, and they are where most reports fail. The next sections build them out in detail.
Designing the Data Analysis Sections
Plan the Analysis Before You Collect Data
Write the analysis section of your template with fill-in fields for the following decisions:
- Primary outcome. The one measurement that answers your question. If you measure six things, pick one primary outcome and label the rest as exploratory.
- Sample size. State how many independent observations you need and why. Multi-lab trial guidance emphasizes calculating sample size in advance and basing it on an effect size that matters scientifically, not on whatever number of animals or samples happens to be convenient [1].
- Exclusion criteria. Define them before looking at results. A template line like "samples excluded if [criterion], exclusions recorded with reason and date" keeps this honest.
- Test selection. Match the test to the data type and design. The table below covers the most common cases.
| Data situation | Standard test | Report at minimum |
|---|---|---|
| Two independent groups, continuous outcome | Unpaired t-test (or Mann-Whitney U if not normal) | Means, SDs, t or U statistic, p value, effect size |
| Three or more groups, continuous outcome | One-way ANOVA with post hoc test | Group means, SDs, F statistic, adjusted p values |
| Paired measurements (before and after) | Paired t-test (or Wilcoxon signed-rank) | Mean difference, CI, p value |
| Two continuous variables, testing association | Pearson or Spearman correlation | r value, p value, scatter plot |
| Proportions between groups | Chi-square or Fisher exact test | Counts per cell, percentage, p value |
| Repeated measures over time | Repeated-measures ANOVA or mixed model | Group trajectories, within-subject factor, p value |
These are textbook selections for introductory statistics and apply to most coursework and routine bench experiments. For complex designs, especially anything involving multiple sites or batches, the multi-lab tutorial recommends consulting a statistician early and documenting the agreed plan in writing [1].
Structure the Statistical Analysis Section
Your template's statistical analysis section should contain five labeled sub-blocks:
- Software statement. Name, version, and packages. Example: "Analyses performed in Python 3.11 using pandas 2.1 and SciPy 1.11."
- Assumption checks. Normality (Shapiro-Wilk test or visual inspection of a Q-Q plot) and homogeneity of variance (Levene's test) for tests that require them.
- Test output. The complete numerical result, pasted, not paraphrased.
- Effect size and precision. Means with standard deviations, or differences with 95 percent confidence intervals. A p value alone is not a result.
- Multiplicity note. If you ran many comparisons, state how you handled that, for example with a Bonferroni correction.
Preregistered analysis is the strongest version of this practice. In a lab-based study of emotional contagion during video conferences, researchers preregistered their analyses before running 104 participants in 52 dyads, and the preregistered self-report findings supported emotional contagion for all three tested emotions [3]. You do not need a public registry for a course report, but writing your planned test into the template before data collection gives you the same protection against accidental bias.
Plan the Results Presentation
The results section presents evidence without interpreting it. Fill-in blocks in your template should include:
- One figure per primary finding, with a caption that states what the reader is looking at and what the error bars represent
- One summary table with group sizes, means, standard deviations, and test results
- A one-paragraph narrative that names each figure and table in order
Automated pipelines show what thorough reporting looks like at scale. The miND pipeline for small RNA sequencing generates a report containing all essential quality and quantitative results, from preprocessing and mapping statistics through visualization and differential expression, so that a wet-lab scientist receives a complete standardized analysis without writing code [4]. Borrow that philosophy even for a spreadsheet-level experiment. Every number in your results should trace back to a raw value in your data record.
Building the Template, Step by Step
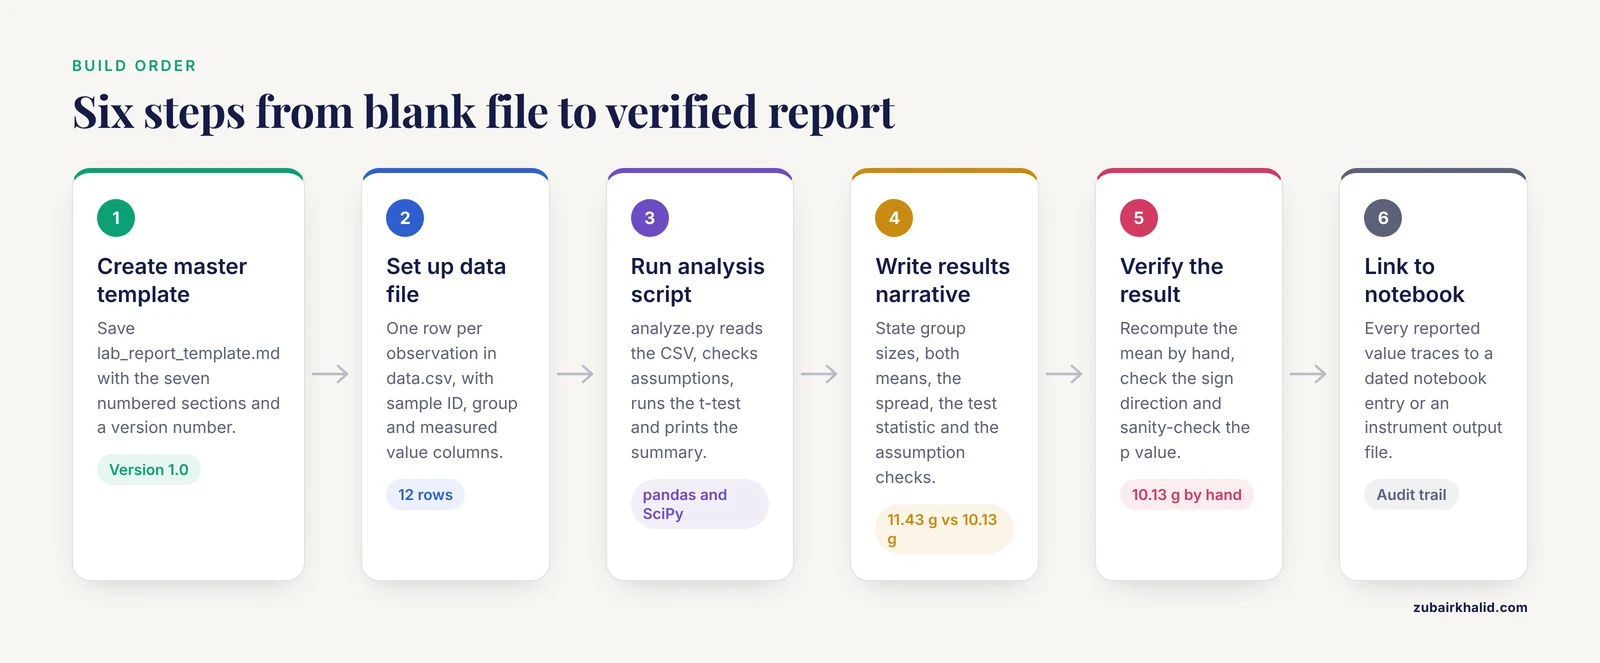
This walkthrough builds a plain-text master template plus a matching Python analysis script. The same logic works in Word and Excel if you prefer those tools.
Step 1: Create the Master Template File
Open a text editor and save a file called lab_report_template.md. Paste this skeleton:
# [Experiment title]
Date: ____  Operator: ____  Template version: 1.0

## 1. Objective and Hypothesis
Question: ____
Hypothesis: ____
Alternative informative outcome: ____

## 2. Materials and Methods
Reagents and concentrations: ____
Equipment: ____
Protocol:
1. ____
2. ____

## 3. Raw Data Record
| Sample ID | Group | Raw value | Unit | Time | Notes |
|-----------|-------|-----------|------|------|-------|

## 4. Data Processing
Conversions applied: ____
Exclusion criteria: ____
Exclusions made (ID, reason, date): ____

## 5. Statistical Analysis
Software: ____
Primary outcome: ____
Test chosen and justification: ____
Assumption checks: ____
Output: ____

## 6. Results
Figure 1: ____
Table 1: ____
Narrative summary: ____

## 7. Discussion and Conclusion
Interpretation relative to hypothesis: ____
Limitations: ____
Next steps: ____
Save this file somewhere you can copy it for every new experiment. The version number matters. When you improve the template, increment the version so old reports stay traceable to the format they used.
Step 2: Set Up the Data File
Keep raw data in a comma-separated values file, one row per observation. Create a file called data.csv for a worked example with two treatment groups and six samples each:
sample_id,group,mass_g
S1,control,10.2
S2,control,9.8
S3,control,10.5
S4,control,10.1
S5,control,9.9
S6,control,10.3
T1,treated,11.4
T2,treated,11.8
T3,treated,11.1
T4,treated,11.6
T5,treated,11.2
T6,treated,11.5
Step 3: Run the Analysis Script
Install Python with pandas and SciPy, then save this as analyze.py:
import pandas as pd
from scipy import stats

df = pd.read_csv("data.csv")

control = df.loc[df["group"] == "control", "mass_g"]
treated = df.loc[df["group"] == "treated", "mass_g"]

# Assumption checks
sw_control = stats.shapiro(control)
sw_treated = stats.shapiro(treated)
levene = stats.levene(control, treated)

# Primary test
t_result = stats.ttest_ind(control, treated)

# Descriptive statistics
summary = df.groupby("group")["mass_g"].agg(["count", "mean", "std"])
print(summary)
print("Shapiro control p =", round(sw_control.pvalue, 4))
print("Shapiro treated p =", round(sw_treated.pvalue, 4))
print("Levene p =", round(levene.pvalue, 4))
print(t_result)
Run it from the terminal:
python analyze.pyExpected output looks like this:
        count   mean       std
group
control     6  10.13  0.262991
treated     6  11.43  0.262991
Shapiro control p = 0.8791
Shapiro treated p = 0.9299
Levene p = 0.8148
TtestResultResult(statistic=-8.124, pvalue=1.03e-05, df=10.0)
Paste the full output into the "Output" block of your template's statistical analysis section. The assumption checks both pass here (p values well above 0.05), so the t-test is appropriate for these data.
Step 4: Write the Results Narrative
With the output in hand, complete the results section. A worked narrative for this example:
"Treated samples had a higher mean mass than controls (11.43 g versus 10.13 g, SD 0.26 g in each group). An unpaired t-test indicated the difference was statistically significant (t = -8.12, df = 10, p < 0.001). Normality and equal-variance assumptions were met (Shapiro-Wilk p = 0.88 and 0.93, Levene p = 0.81). Figure 1 shows individual points with group means."
Notice what is present: group sizes, both means, the spread, the full test statistic, the assumption checks, and a pointer to the figure. That is the level of completeness your template should enforce.
Step 5: Verify the Result
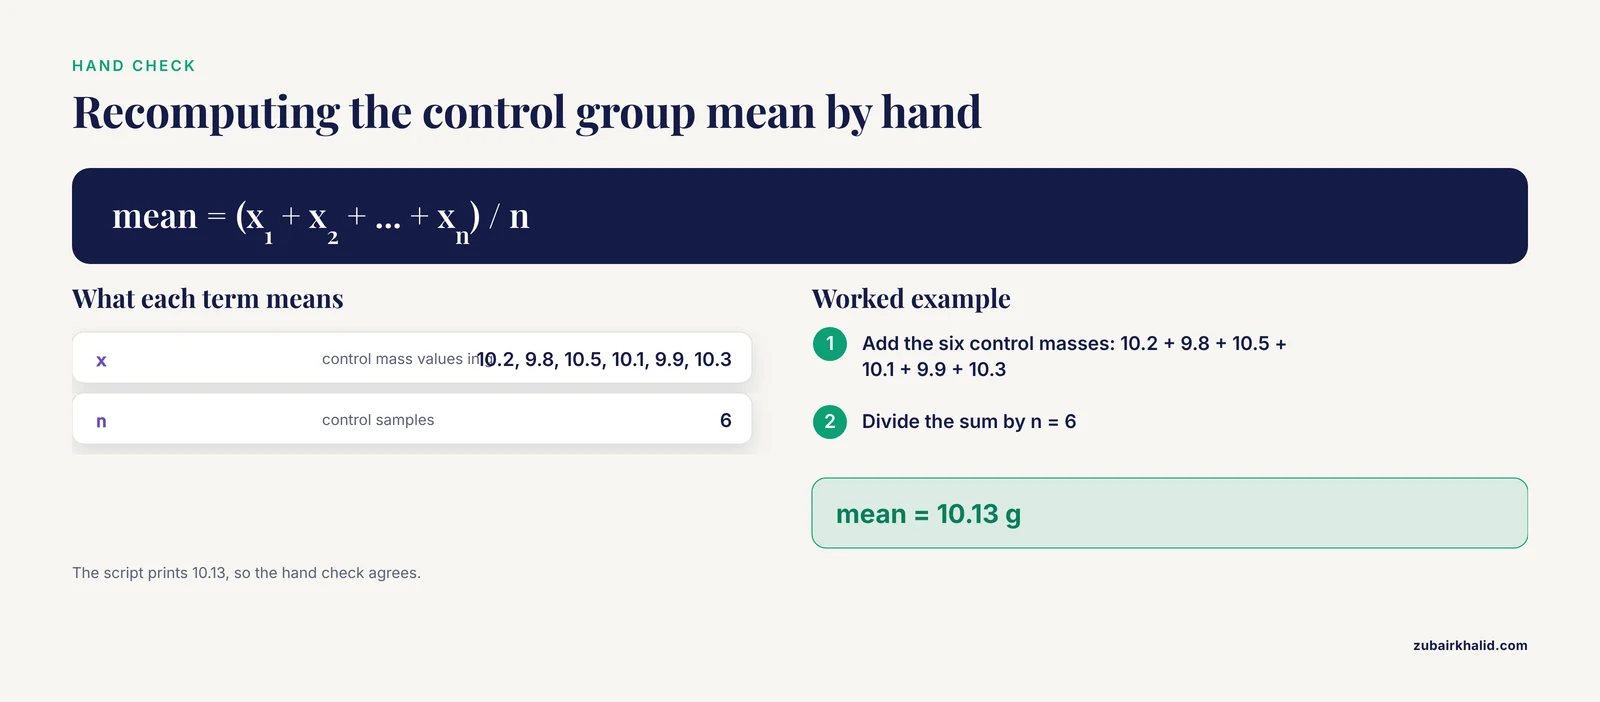
Check your work three ways:
- Recompute by hand. The mean of the control group is (10.2 + 9.8 + 10.5 + 10.1 + 9.9 + 10.3) divided by 6, which equals 10.13 g. Confirm the script agrees.
- Reverse-check the direction. The test statistic is negative because the control group was subtracted from the treated group in effect direction. Make sure your narrative states the difference in the direction that matches the sign.
- Sanity-check the p value against the overlap of the groups. Here the two distributions do not overlap at all, so a very small p value is plausible. If your groups overlap heavily but your p value is tiny, look for a data entry error.
Step 6: Link the Report to a Lab Notebook
The raw data record section works only if it matches what you wrote at the bench. A lab notebook template PDF with fixed columns (date, sample ID, reagent lot, reading, initials) transfers directly into the data.csv format above. Many universities provide printable lab notebook template PDF options, and a simple ruled notebook page with the same column headers works just as well. The key rule is that every value in the report must be traceable to a dated notebook entry or an instrument output file.
For a concrete example of consistency done right, consider a published plant tissue analysis dataset from Chile's agricultural research institute. It holds 9,175 entries covering nitrogen, phosphorus, potassium, and six other nutrients across 94 plant species and 14 tissue types, generated with the same analytical methods across 14 years, with the Kjeldahl method for nitrogen and colorimetry or atomic absorption spectrometry for the other analytes [5]. That consistency of method across years is what makes the dataset reusable. Your template's "conversions applied" and "methods" blocks serve the same purpose for your own work.
Adapting the Template for Automated and High-Volume Work
If your lab generates data continuously, move the template logic into software rather than a document. Three published examples show the range of what is possible.
Automated report generation. In an automated chiral screening workflow, proprietary software tested 10 chromatographic methods in parallel, evaluated the resulting chromatograms for enantiomer separation, and generated reports automatically. Statistical analysis across 756 test racemates showed that up to 92 percent could be separated with at least one tested condition [6]. The report structure was fixed in advance, which is exactly what your template does, just executed by software.
Machine-assisted data collection and analysis. Researchers have built modular software that collects, transcribes, and analyzes verbal-report data from experiments, combining classical machine learning with large language models to cut the cost of analyzing what participants say during tasks [7]. The design lesson from that work is modularity. Keep your template's analysis blocks swappable so you can replace a spreadsheet with a script or a script with a pipeline without rebuilding the document.
Domain-specific pipelines. In quantitative proteomics, standardized workflows for mass spectrometry-based data analysis define how raw spectra become quantified protein abundances, and reporting follows the pipeline rather than ad hoc choices [8]. Similar structure appears in systematic reviews of instrumented gait data, where analysis intelligence depends on consistent preprocessing across studies [9].
You do not need any of these systems to benefit from the principle. A well-built report template with data analysis sections is the low-tech version of a pipeline, and it makes an eventual transition to automation far easier because the structure already exists.
Lab Report Template with Data Analysis Tips
These are the practices that separate a template that gets used from one that gets abandoned.
Keep the template shorter than you think you need. Every extra field you add is a field you will skip on a busy day. If a section produces nothing you ever use in the discussion, cut it.
Write the methods section before the experiment. A sensory evaluation lab report from food science research shows the pattern well. The methods section documents panel setup, sample presentation, and scoring scales in enough detail that the study could be repeated, and the analysis section then interprets the scores against that fixed method [10]. If your methods section is vague, your analysis will be vague too.
Record deviations in the template itself. When the incubator ran 20 minutes long or a reagent lot changed mid-experiment, write it in the notes column immediately. Multi-lab trial guidance stresses documenting deviations because they often explain unexpected variance later [1].
Use one file per experiment, never one growing file. Copy the master template, name the copy with date and experiment code, and never edit a filled report in place. This preserves an audit trail at zero cost.
Match your figure to your test. If you ran a t-test, show individual points with group means, not a line chart. If you ran a correlation, show the scatter plot with the fitted line. The figure should let a reader check the test visually.
Number your template fields. Fields like "4.1 conversions" and "4.2 exclusions" let collaborators reference a specific block in feedback, which speeds revision.
Version your analysis script with your data. Store analyze.py next to data.csv for each experiment. If the script changes between experiments, note the version in the software statement.
Common Mistakes and Limitations
These are the errors that show up most often in student and early-career reports, with fixes.
Choosing the test after seeing the data. If you try three tests and report the one with the nicest p value, your result is not trustworthy. Fix this by writing the test into the template before data collection, the same planning logic that multi-lab preclinical trial guidance formalizes [1].
Reporting a p value with no effect size. A p value says whether an effect is likely under a null model. It does not say how big the effect is. Always include means, differences, and confidence intervals in the results block.
Treating technical replicates as independent samples. Six readings from one sample are not six samples. Statistical conclusions require independent biological units. If you measured the same sample repeatedly, report the average per sample and analyze those averages, or use a repeated-measures method.
Filling the raw data record from memory after the fact. Transcribing values hours later introduces errors that no analysis can detect. Enter data at the bench or immediately after, and cross-check against the notebook entry.
Hiding failed runs. Excluding a failed reaction without recording it makes the analysis unfalsifiable. The exclusion block exists to document these cases with reasons and dates.
Writing the discussion as a restatement of results. The discussion interprets. It compares your result to your hypothesis, states limitations plainly, and proposes a specific next step. If a reader can swap your discussion into a different experiment, it says nothing.
Assuming normality without checking. Many people run t-tests on heavily skewed data. Run the Shapiro-Wilk test or look at a Q-Q plot, and switch to a nonparametric alternative when assumptions fail.
Over-automating too early. Automated analysis tools, including the machine learning approaches now used for verbal-report data, work best when the underlying measurement and reporting structure is already sound [7]. A template is that structure. Build it first.
A final limitation applies to this whole guide. Every lab, course, and field has its own reporting conventions, and your instructor's rubric or your institution's style guide takes precedence over any generic template. Individual experimental situations, particularly those involving human or animal subjects, also carry ethical review requirements that fall outside a formatting template and need qualified oversight.
Frequently Asked Questions
What should a data analysis section include?
It should include a software statement, assumption checks, the full statistical output, effect sizes with confidence intervals, and a note on how multiple comparisons were handled. Each element maps to a labeled block in the template above.
Can I use one template for every experiment?
You can use one master template for most routine experiments, but complex designs need added fields. Multi-lab preclinical work requires extra attention to sample size calculation, center effects, and covariate selection, which calls for an expanded analysis plan developed with a statistician [1].
How do I choose the right statistical test?
Match the test to the number of groups, whether measurements are paired, and whether the outcome is continuous or categorical. The selection table in this article covers the standard cases, and assumption checks such as the Shapiro-Wilk test tell you whether parametric versions are appropriate.
What is the difference between a lab notebook and a lab report?
The notebook is the dated, chronological record of what you did and observed at the bench. The report is the polished argument built from that record. Your template's raw data record section should mirror the notebook columns so values transfer without reinterpretation.
Where can I find a lab notebook template PDF?
University teaching websites and scientific supply vendors offer printable lab notebook template PDF downloads, and a plain ruled page with fixed column headers works equally well. The format matters less than the consistency of what you record.
Should I preregister my analysis plan?
Formal preregistration is standard for clinical trials and increasingly common in experimental research, and it strengthens conclusions by fixing the analysis before data exist [3]. For coursework, writing your planned test into the template before the experiment captures most of the same benefit.
Can AI tools help write a lab report?
AI tools can help with structure and language, but the analytical depth depends on how they are used. A classroom study found that students prompted through inquiry-based questioning wrote reports with deeper conceptual integration than students given only procedural scaffolding [2], so use AI to question your reasoning rather than to generate conclusions.
How do I report missing data or failed runs?
List every excluded or missing observation in the exclusions block with its sample ID, reason, and date, then state in the statistical section how many observations remained per group. Transparent exclusion reporting is a core recommendation of statistical planning guidance for confirmatory trials [1].
Sources
- Data Analysis Planning and Reporting for Confirmatory Multi-Lab Preclinical Trials: A Tutorial
- Evaluating generative AI-assisted inquiry-based learning and metacognitive scaffolding for enhancing scientific vocabulary, content comprehension, and lab report writing
- Emotional contagion in dyadic online video conferences-empirical evidence based on self-report and facial expression data
- miND (miRNA NGS Discovery pipeline): a small RNA-seq analysis pipeline and report generator for microRNA biomarker discovery studies
- Chile's agricultural research institute plant tissue analysis dataset
- Automated chiral method screening - Evaluation of generated chromatographic data sets to further optimize screening efficiency.
- Using machine learning to automate the collection, transcription, and analysis of verbal-report data
- Quantitative Analysis of Mass Spectrometry-Based Proteomics Data
- Intelligent data analysis of instrumented gait data in stroke patients - A systematic review
- Sensory Evaluation Lab Report