How to Choose Data Visualization Software for Your Research
By Dr. Zubair Khalid, DVM, MS, PhD ·

The single difference that matters when you choose data visualization software for research is this: general-purpose scripting libraries give you full control and reproducibility but demand coding skill, while domain-specific graphical and web tools get you a usable figure in minutes but lock you into their assumptions. The rule of thumb is simple. Match the tool to your data type first, to your audience second, and to your coding comfort third. A researcher visualizing cardiac optical mapping signals has fundamentally different needs from one mapping viral quasispecies or benchmarking proteomics workflows, and no single package serves them all.
This guide explains the main families of visualization software available to researchers today, compares them side by side, walks through the criteria that decide real choices, and works through concrete scenarios so you can pick with confidence rather than habit.
The Two Families of Research Visualization Software
Nearly every tool you will encounter falls into one of two families.
General-purpose scripting libraries are code-first environments such as Python's matplotlib and seaborn, the pandas plotting interface, or R's ggplot2 and plotly. These libraries treat a figure as code. Every color, axis, and annotation is written as an instruction that can be saved, rerun, and applied to tomorrow's dataset. The cost is a learning curve. Producing a biomedical staple like a volcano plot or a survival curve with matplotlib's low-level interface can require verbose, brittle code that demands considerable programming experience [1].
Domain-specific applications and packages are built for one research niche. CADENCE handles cardiac optical mapping data end to end [2]. FLASHApp visualizes top-down proteomics results [3]. DeepEpiX supports magnetoencephalography analysis for epilepsy workups [4]. These tools hide the plumbing behind a graphical interface or a guided workflow. The trade-off is flexibility. If your question falls outside what the developers anticipated, you may need to export your data and move to another package, a pattern the CADENCE authors describe as features being siloed across platforms [2].
A small third category sits between them: interactive web dashboards and community platforms that wrap established statistical libraries in a code-free interface, such as the R Shiny-based GBD Analysis Suite for burden-of-disease research [5].
Side-by-Side Comparison Table
The table below is a research software comparison across the main options, organized by family.
| Option | Type | What it does well | Coding needed | Best fit | Main trade-off |
|---|---|---|---|---|---|
| matplotlib, seaborn, pandas plotting [11][15] | Python libraries | Fine-grained control, integration with analysis pipelines, single-line plots through DataFrame extensions | Yes, substantial for complex figures | Programmers who need custom or automated figures | Verbose, brittle code without helper packages |
| plot-misc [1] | Python package | Archetype-based plots for forest plots, survival plots, volcano plots, heatmaps, incidence matrices | Yes, moderate | Python users wanting publication-quality biomedical archetypes | Prioritizes customizable figures over integrated statistics |
| R packages such as longreadvqs (QoALa) [6] and TransProR [7] | R packages | Workflow-integrated analysis and visualization, standardized metrics | Yes | Reproducible pipelines in genomics and transcriptomics | Fragmented ecosystem if you pick the wrong package |
| R Shiny dashboards (GBD Analysis Suite) [5] | Web dashboard | 11 analytical modules in one code-free interface, uses ggplot2 and plotly under the hood | No | Investigators in resource-limited settings, team-based analysis | Limited to the modules the developers built |
| MATLAB GUIs (CADENCE [2], HRV-GUI [8]) | Desktop GUI applications | End-to-end signal processing and visualization, human and animal modes | No (compiled apps) | Electrophysiology and signal-processing labs with MATLAB access | Dependent on a commercial platform license |
| Web apps (FLASHApp [3], NuXLApp [9], ProteoArk [10], PopMLvis [11]) | Browser applications | Interactive, platform-independent, shareable URLs for collaboration, one-click manuscript-ready figures | No | Proteomics, population genetics, and cross-platform teams | Less adaptable to unusual data or questions |
| sensortoolkit [12] | Python library | Standardized performance metrics such as R², slope, intercept, RMSE, and reporting templates | Yes | Air sensor evaluation and other instrument benchmarking | Focused scope |
| DeepEpiX [4] | GUI application | Preprocessing plus deep learning event detection with modular architecture for new models | No | Clinical MEG analysis | Model performance varies across acquisition systems |
| CiteSpace, VOSviewer, Biblioshiny [16] | Bibliometric tools | Science mapping of publication trends, keyword bursts, collaboration networks | No | Literature reviews and field mapping | Not for plotting experimental data |
| GraphPad Prism [13] | Commercial desktop software | Trend graphs and proportion plots with minimal setup | No | Bench scientists wanting quick, polished charts | License cost, less pipeline integration |
The Options Explained on Their Own Terms
Python libraries and ecosystem extensions
Python is the default scripting environment in many life science labs. The base libraries, matplotlib and seaborn, are established tools for generating illustrations, but they omit visualization archetypes commonly used in biomedical research, which is why extension packages exist. plot-misc was designed specifically for publication-quality biomedical research visualization. It offers ready-made archetypes including forest plots, survival plots, volcano plots, heatmaps, and incidence matrices, and because it follows a matplotlib-first design, most Python users can integrate it into existing routines without changing their pipeline [1].
For mass spectrometry work specifically, pyOpenMS-viz extends pandas DataFrame plotting so that a figure emerges from a single line of code. Because many Python-based proteomics tools already store data in pandas DataFrames, the extension integrates directly across those tools rather than forcing an export step [14]. This is a good illustration of a principle worth internalizing when you evaluate any tool: the best option is often the one that plugs into data structures you already have, not the one with the longest feature list.
The strengths of the Python family are reproducibility, automation, and zero license cost. The weaknesses are the learning curve and the risk of producing inconsistent figures across a lab if each person writes their own plotting code from scratch.
R packages and dashboards
R occupies a similar space for statistics-heavy fields. The QoALa workflow, implemented in the longreadvqs R package, combines error minimization of read alignments with sample size standardization and comparative visualization of viral quasispecies, and it benchmarked consistently ahead of existing error-correction methods on simulated SARS-CoV-2 and HIV-1 datasets [6]. TransPro takes the same integration approach in transcriptomics: its Python component (TransProPy) handles interaction-aware gene selection while its R component (TransProR) provides standardized differential analysis, pathway enrichment, and seven visualization workflows including circular dendrograms, chord diagrams, and interaction networks, all validated across 12 independent datasets spanning multiple cancer types and normal tissues [7].
The lesson from both packages is that modern domain tools increasingly bundle visualization with the statistical steps upstream of it. Choosing a tool that spans the whole workflow removes the manual switching between programs that fragments reproducibility.
For teams that cannot or will not code, R Shiny dashboards deserve special attention. The GBD Analysis Suite consolidates 11 commonly used analytical modules for burden-of-disease research into a single, code-free web interface supporting user-uploaded data, built on R 4.5.3 and integrating established packages such as ggplot2 and plotly underneath. Its developers identified a substantial technical barrier, particularly for investigators in resource-limited settings, and the code-free interface is their answer to it [5]. If your lab needs statistical rigor but not programming skill, this category of tool is often the best software for researchers in that position.
MATLAB-based GUI applications
Signal-processing fields have converged on MATLAB graphical interfaces that bundle acquisition, preprocessing, feature extraction, and plotting into one window. CADENCE is a representative example: it combines feature breadth, such as singular value decomposition denoising, conduction velocity mapping, and alternans analysis across both voltage and calcium modalities, with an end-to-end pipeline running from data conversion to signal analysis. Its authors validated the software against three blinded expert observers across 15 hearts and found agreement comparable to inter-observer variability, with dominant frequency recovered at a median error of 0.03% across 84 of 88 paced recordings with 1:1 capture. The code is publicly available and ships as a compiled standalone application that users install and run without a MATLAB license [2].
HRV-GUI follows the same pattern for heart rate variability analysis. It integrates data loading, human and rat analysis modes, automated R-peak detection with manual correction, multi-domain computations, diagnostic visualization, and session saving in one interface, addressing the fragmented workflows that plague translational labs working across species [8].
The pros are depth and validation. These tools have been tested against expert observers or synthetic datasets, which general plotting libraries never are. The cons are platform dependence and niche scope. A compiled CADENCE build helps a cardiac electrophysiology lab and nobody else.
Interactive web applications
Web-based apps have become the friendliest entry point for researchers with basic informatics skills. Four examples show the range.
FLASHApp offers interactive, publication-ready visualizations for top-down proteomics with automated processing through FLASHDeconv and direct team collaboration via shareable URLs. Its developers point to a recurring pain point: existing tools that lack interactivity force researchers into additional manual processing, which impacts reproducibility and consistency of scientific outcomes [3]. NuXLApp extends the same OpenMS web platform to protein-nucleic acid crosslinking mass spectrometry, integrating a search engine, machine-learning property prediction, and interactive result visualization within a reproducible workflow [9].
ProteoArk, built on the Django framework, handles label-free and labeled proteomics samples and generates manuscript-ready figures with a single click, including principal component analysis plots, K-means and hierarchical heatmaps, MA plots, volcano plots, and circular bar plots. Users with basic bioinformatics skills can postprocess results from Proteome Discoverer, MaxQuant, and MSFragger without writing scripts, and a Docker option allows a standalone local installation [10].
PopMLvis brings the same philosophy to population genetics, offering an interactive environment to visualize genetic similarity data with several algorithms, including principal component analysis, clustering, and maximum likelihood techniques, in one place. Its authors identified a specific gap: plenty of tools implement the algorithms, but few interactive visual platforms run a variety of them together and produce figures that slot straight into scientific articles [11].
The pros of web apps are zero installation, platform independence, shareable results, and gentle learning curves. The cons are adaptability. As the FLASHApp authors note, the problem they set out to fix was that existing tools "lack adaptability and interactivity" [3], and any fixed web app inherits some of that rigidity the moment your experiment design changes.
Bibliometric and literature-mapping tools
A specialized corner of visualization software maps research fields rather than experimental data. In a bibliometric analysis of 853 silica-based nanobiomaterials articles published between 2006 and 2025, the authors used CiteSpace, VOSviewer, and Biblioshiny to generate data-driven visualizations of publication trends, country and institution contributions, keyword dynamics, and reference networks [15]. A comparable breast cancer radiomics study combined CiteSpace for science mapping with GraphPad Prism for trend and proportion graphs [13].
These tools matter for a different reason than the others: if your deliverable is a systematic review or a field landscape paper, they are the standard instruments, and choosing a general plotting library for science mapping would be the wrong starting point entirely.
The Criteria That Decide Real Choices
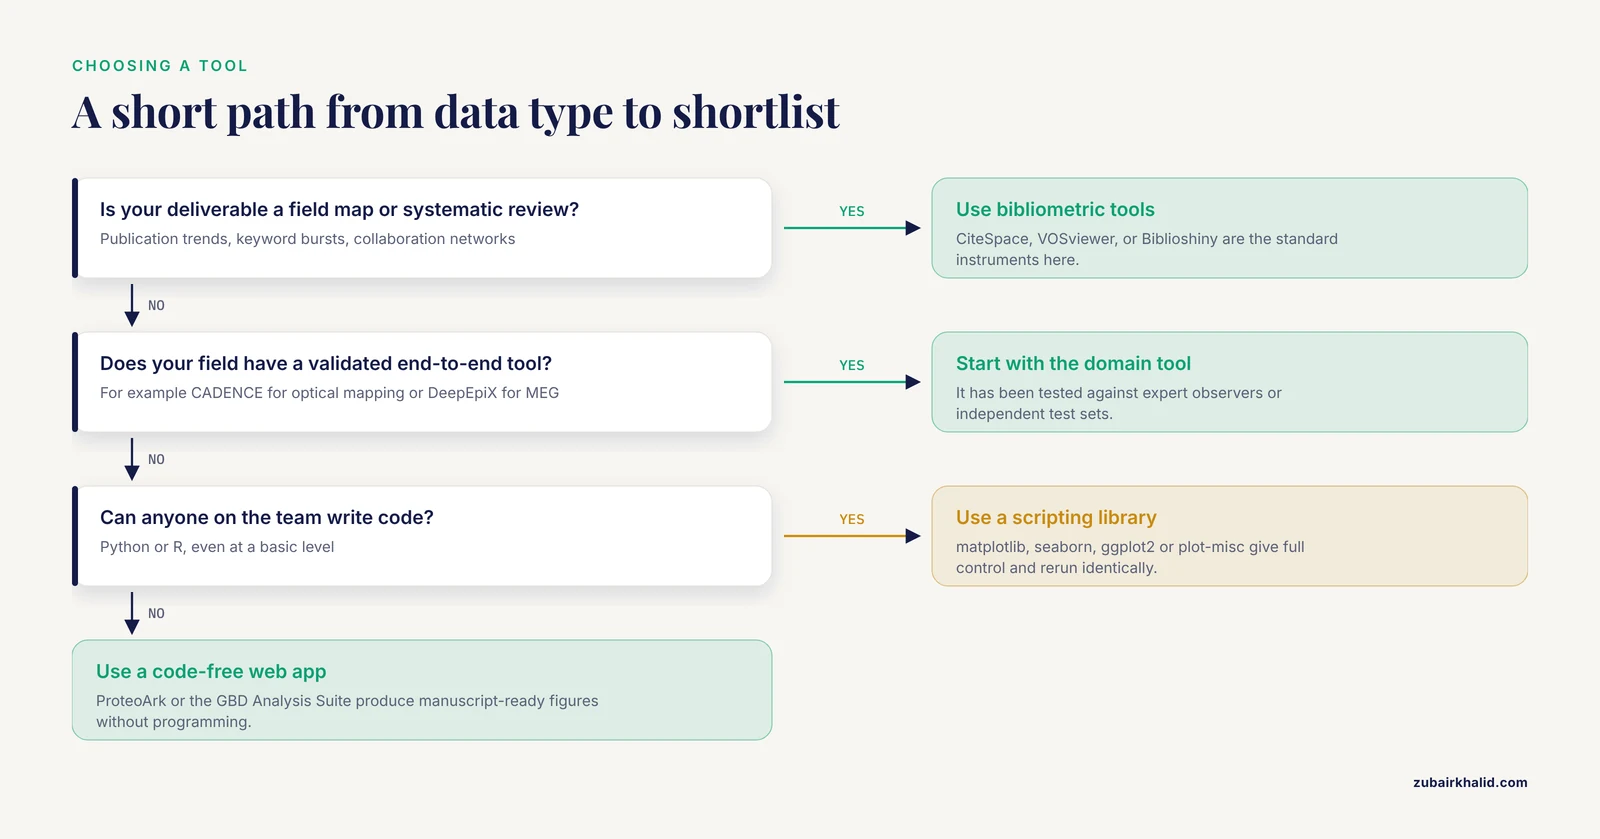
A published framework gives you a defensible basis for a research software comparison. The M.E.D.V.I.S. study, which introduced a quantification system for scoring biomedical figures based on complexity, color usage, whitespace, and the number of distinct visualizations, also conducted a comparative analysis of 26 widely used visualization tools, evaluating each on ease of use, customizability, financial cost, and required background knowledge [16]. Those four criteria, plus reproducibility, are the ones that actually decide which tool a lab adopts.
Ease of use versus required background knowledge. A code-free interface removes weeks of onboarding. The GBD Analysis Suite explicitly targets users who would otherwise face a technical barrier [5], and ProteoArk serves users with basic bioinformatics skills rather than programmers [10]. But ease of use has a ceiling. If you need a plot type the tool does not offer, a code-free interface cannot grow with you, while a Python or R user can always drop to a lower abstraction level.
Customizability. Ask whether you can change every element a reviewer might question. Archetype-based libraries like plot-misc aim for the sweet spot, combining fine-grained control with predefined biomedical plot types [1]. Full frameworks like matplotlib give the most control at the highest effort.
Financial cost. Open-source underpins most of the tools described here, including pyOpenMS-viz under a BSD 3-Clause license [14], sensortoolkit as a free Python library [12], and the OpenMS web apps [12]. MATLAB-based tools occupy a hybrid position, where the source may be public but the underlying platform is commercial [1]. Your lab's existing licenses and budget shape this criterion more than any chart does.
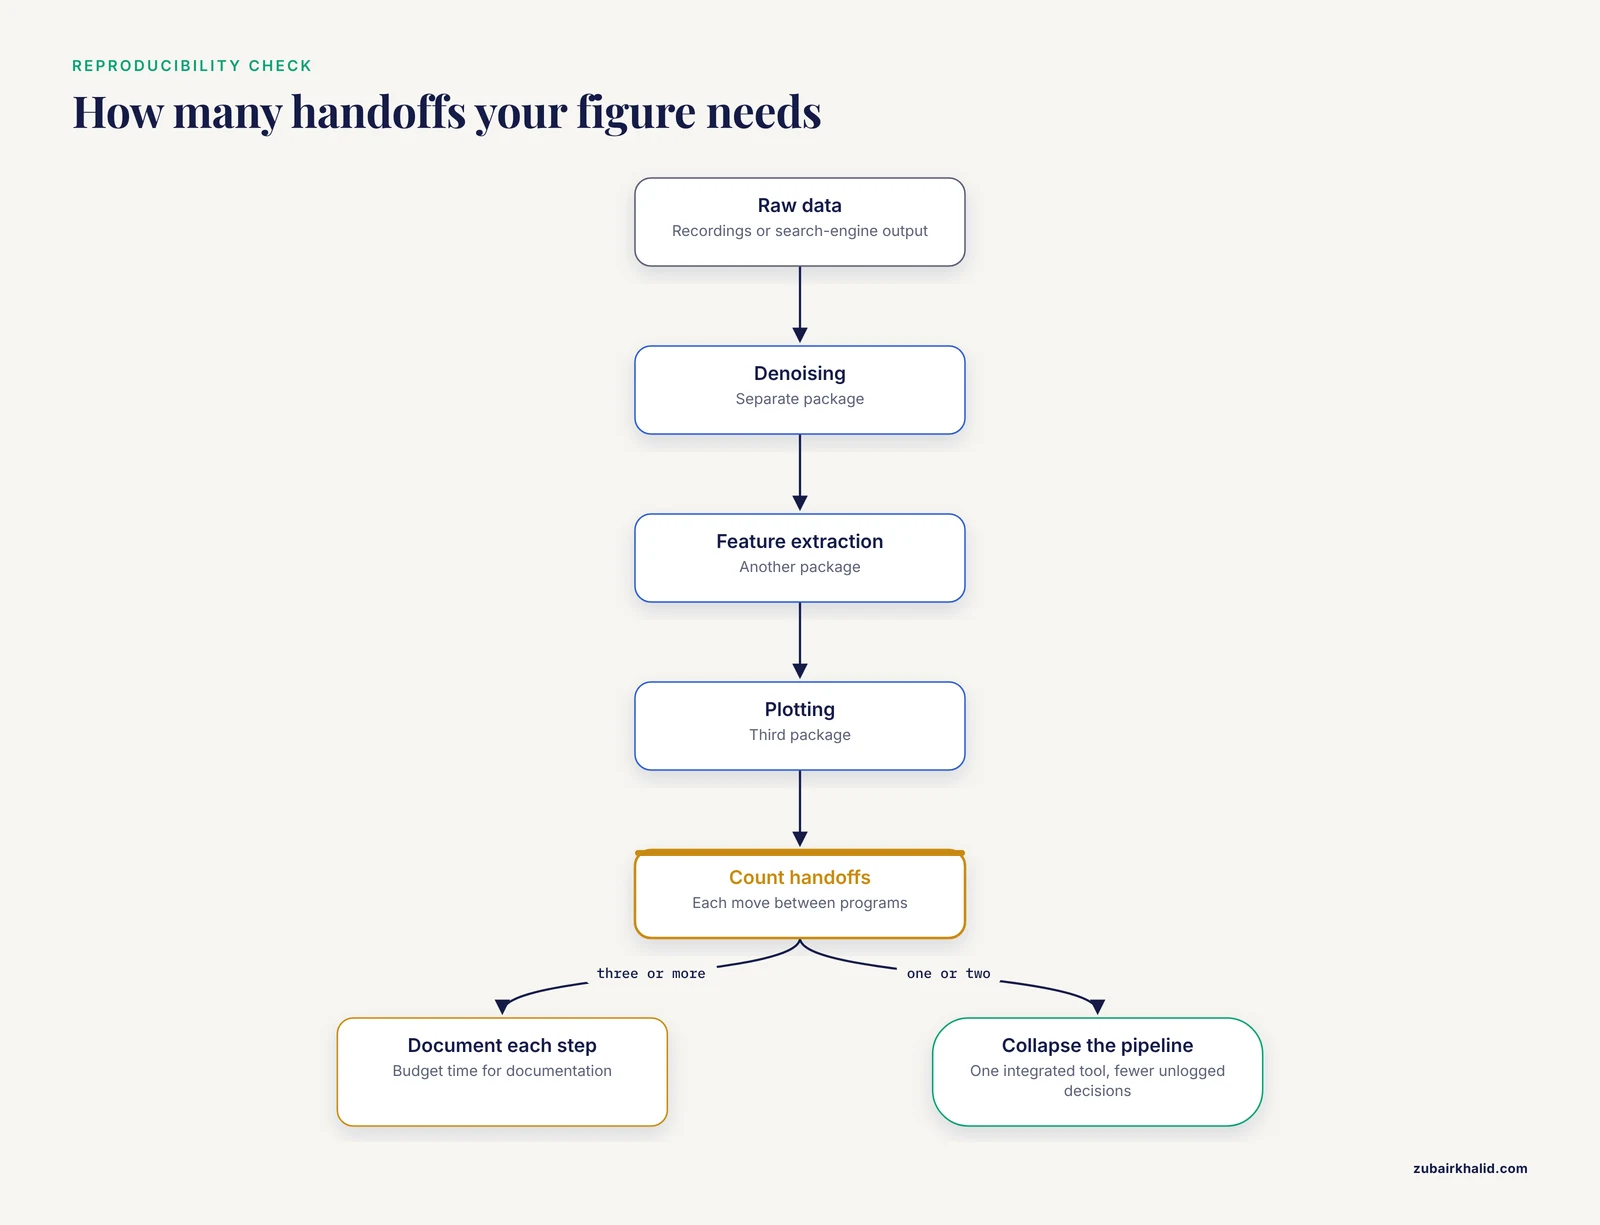
Reproducibility and workflow integration. The most consistent complaint across recent tool papers is fragmentation. TransPro was built because heterogeneous tools, inconsistent metrics, and fragmented workflows compromise the reproducibility and interpretability of downstream analyses [7]. HRV-GUI was built because practical analysis depended on fragmented workflows and software optimized for either human or preclinical recordings but not both [8]. CADENCE was built because users had to combine several packages for in-depth analysis [2]. When you compare options, ask how many handoffs your figure requires from raw data to final image. Every handoff is an opportunity for an unlogged decision.
Figure quality itself. Rarely discussed but measurable. The M.E.D.V.I.S. algorithm classifies figures and generates tailored feedback for improvement, and its authors argue for standardized evaluation methods to improve figure design in biomedical research, education, and industry [16]. Separately, work on meta-analytic rain cloud plots shows that design principles grounded in the visualization and cognitive science literature measurably change how well audiences understand results, with a randomized survey experiment comparing the revised MARC plot against forest plots for meta-analyses of 10 to 100 studies [17]. A tool that makes it easy to follow good design principles is worth more than one that makes bad figures easy to produce.
Worked Scenarios
Scenario 1: A signal-processing lab replacing fragmented software. Your cardiac imaging lab currently chains three packages for denoising, feature extraction, and plotting. A single end-to-end application such as CADENCE, validated against blinded expert observers with agreement comparable to inter-observer variability [2], collapses the pipeline and reduces handoff errors. If your work spans species and preparation types, check that the tool covers your configurations before committing.
Scenario 2: A clinician with no coding background needs epidemiological trends. Code-free web interfaces built for exactly this audience exist. The GBD Analysis Suite wraps 11 analytical modules in a browser-based dashboard where you upload data and select modules [5]. The honest limitation is module boundaries. If you need an analysis the dashboard lacks, you will eventually need a collaborator who codes.
Scenario 3: A proteomics core producing figures for many manuscripts per year. Throughput argues for one-click manuscript-ready output. ProteoArk produces PCA plots, heatmaps, volcano plots, and MA plots from standard search-engine outputs in a single click [10]. For interactive validation and collaboration across sites, FLASHApp and NuXLApp add shareable URLs and reproducible workflows. A hybrid strategy works well here: web apps for standard figures, a Python extension like pyOpenMS-viz for anything custom [14].
Scenario 4: A genomics team standardizing a multi-year project. Reproducibility dominates. Choose packages that bundle analysis and visualization with fixed workflows and cross-dataset validation, the approach TransPro validated across 12 independent datasets [7] and QoALa demonstrated through systematic benchmarking against competing error-correction methods [6]. Document package versions in your methods section.
Scenario 5: A methodologist presenting evidence to non-specialists. If your audience includes policy-makers or practitioners, default figures may not serve them. The MARC plot work showed that forest plots rely on statistical conventions unfamiliar to broad audiences and that redesign grounded in cognitive science improves communication, with the extended design handling meta-analyses of 10 to 100 studies [17]. Choose a tool flexible enough to implement such alternatives.
How to Run Your Own Evaluation in an Afternoon
- Write down your data type, your monthly figure volume, and your audience. These three answers eliminate most of the table above immediately.
- Test the top two or three candidates on your own data, not the tutorial dataset. Tools that look flawless on bundled examples often strain on real file formats and missing values.
- Score each candidate on the four MEDVIS criteria, ease of use, customizability, cost, and required background knowledge, plus reproducibility, using a simple one-to-five scale. The published comparative analysis of 26 tools used essentially this framing [16], and there is no reason your lab cannot apply it locally.
- Check the figure output against quality criteria such as color use, whitespace, and complexity [16]. A tool that produces cluttered defaults will cost you revision cycles.
- Ask whether the tool can share results with collaborators. Shareable URLs and standardized reporting templates, as FLASHApp offers [3] and sensortoolkit provides through its reporting module [12], decide adoption in distributed teams as much as plotting power does.
- Confirm the license, the installation path, and whether the code is publicly available. Publicly available code, as CADENCE distributes [2], protects your analysis against the tool disappearing.
Common Mistakes and Limitations
Choosing on familiarity rather than fit. The most common error in labs is defaulting to whatever the senior student used. CiteSpace and VOSviewer are excellent for literature mapping and useless for plotting your western blots. Match the tool to the task, not to the last project.
Ignoring the handoff problem. Each time data moves between packages, formatting decisions go unrecorded. The developers of CADENCE, TransPro, and HRV-GUI all cite fragmented workflows as the core problem they solved. If your chosen tool forces three handoffs, budget time for documentation or reconsider.
Assuming interactive equals better. Interactive platforms win on exploration [5] but static, code-generated figures win on reproducibility and journal compliance. Many mature workflows use both, interactives for analysis and scripted figures for publication.
Overlooking validation evidence. A general plotting library has nothing to validate because it makes no analytic claims. A domain tool does. When a tool reports its agreement with expert observers [2] or its detection performance on independent test sets [4], read those numbers. DeepEpiX, for example, reached an F1-score of 47% on test data from the same acquisition system as its training data but 23% on data from a different system, with ensemble models improving scores by more than 5% across both sets [4]. That gap tells you exactly what happens when you apply a tool outside its validated context, and it is your responsibility to check.
Underestimating audience needs. A figure that satisfies a methodologist may baffle a practitioner or a patient advocate. Design-principle research shows that audience-appropriate visualization measurably improves evidence communication [17], so consider who will actually read your figures before you pick a default style.
Forgetting the evaluation step. Many labs never score their own figures. Frameworks now exist that classify figure quality on complexity, color usage, whitespace, and the number of distinct visualizations and return targeted feedback [16]. Running your own recent figures through such an evaluation, even informally, often reveals systematic problems that trace back to a single software choice.
One further limitation applies to every choice described here: software evolves quickly, and validation results reported in a tool's launch paper may not describe the version you download today. Check the current documentation before you rely on any performance claim.
Frequently Asked Questions
What is the best data visualization software for research?
There is no single best option. Python and R libraries lead on customizability and reproducibility, GUI applications lead on validated domain workflows, and web apps lead on accessibility and collaboration. A published comparison of 26 tools evaluated ease of use, customizability, cost, and required background knowledge [16], and those four criteria plus reproducibility will identify the right choice for your specific data faster than any universal ranking.
Do I need to learn to code to make publication-quality figures?
No. Code-free web dashboards such as the GBD Analysis Suite [5] and one-click figure generators such as ProteoArk [10] produce manuscript-ready output without programming. The limitation is adaptability, since a code-free interface cannot produce a plot type its developers did not include.
Should I use a general plotting library or a domain-specific tool?
Use a domain-specific tool when your field has validated end-to-end software for your data type, such as CADENCE for optical mapping [2] or DeepEpiX for MEG [4]. Use a general library when you need custom designs, automation, or integration with your own analysis pipeline [1]. Many researchers use both, domain tools for routine processing and libraries for final figures.
How does my choice of visualization software affect reproducibility?
Directly. Fragmented workflows across multiple packages compromise reproducibility and interpretability [7], while integrated tools that bundle analysis and visualization in one reproducible workflow reduce manual steps and unlogged decisions [4][12]. Scripted figures also rerun identically on new data, which manual point-and-click figures cannot.
Can open-source tools produce figures good enough for journals?
Yes. Open-source packages were built specifically for publication-quality biomedical output, including plot-misc with its forest, survival, and volcano plot archetypes [1], pyOpenMS-viz for mass spectrometry figures [14], and single-click manuscript-ready plotting in ProteoArk [10]. Journal acceptance depends on figure design and clarity, not on the license of the software that drew them.
How do I evaluate figure quality objectively?
Apply published quality criteria. The M.E.D.V.I.S. framework scores biomedical figures on complexity, color usage, whitespace, and the number of distinct visualizations, using dimensionality reduction, clustering, and thresholding to classify figures and generate tailored feedback [16]. Pair that scoring with design principles grounded in the cognitive science literature, which randomized experiments have shown improve audience comprehension of statistical results [17].
Sources
- Effective visualization of biomedical data using plot-misc.
- CADENCE: Open-source software for signal conditioning, feature extraction, visualization and analysis of cardiac optical mapping data.
- FLASHApp: Interactive Data Analysis and Visualization for Top-Down Proteomics.
- DeepEpiX: A software for visualization, annotation and automatic epileptical spike detection in MEG recordings.
- Open-Source R Shiny Dashboard (Global Burden of Disease Analysis Suite) for Multimethod Burden of Disease Research: Development and Evaluation Study.
- QoALa: A comprehensive workflow for viral quasispecies diversity comparison using long-read sequencing data.
- Comparative evaluation of gene selection approaches in transcriptomics: bias correction and visualization with TransPro.
- HRV-GUI: A MATLAB Graphical User Interface for Heart Rate Variability Analysis and Validation Using Human, Rodent, and Clinical Diabetic Gastroparesis Data.
- NuXLApp: Interactive data analysis and visualization for protein-nucleic acid crosslinking mass spectrometry.
- ProteoArk: A One-Pot Proteomics Data Analysis and Visualization Tool for Biologists.
- PopMLvis: a tool for analysis and visualization of population structure using genotype data from genome-wide association studies.
- Sensortoolkit-A Python Library for Standardizing the Ingestion, Analysis, and Reporting of Air Sensor Data for Performance Evaluation.
- Research on the application of radiomics in breast cancer: A bibliometrics and visualization analysis.
- pyOpenMS-viz: Streamlining Mass Spectrometry Data Visualization with pandas.
- Data-driven visualization of silica-based nanobiomaterial dynamics for tissue regeneration.
- What is a "Good" figure: Scoring of biomedical data visualization.
- Meta-analytic rain cloud plots: Improving evidence communication through data visualization design principles.