What Is Causation? Definition and Examples
By Dr. Zubair Khalid, DVM, MS, PhD ·
Causation means one event or variable actually produces a change in another. A causation definition always involves a cause, an effect, and a mechanism linking them. Correlation alone cannot establish that link, no matter how strong the correlation is.
Quick Answer
- Causation is a relationship where changing the cause changes the effect.
- The counterfactual test asks: had the cause not occurred, would the effect still have occurred? [1]
- Correlation measures whether two variables move together. It says nothing about which one drives the other.
- A high Pearson $r$ can come from a shared cause, reverse causation, or coincidence.
- Only controlled experiments or strong causal designs (natural experiments, instrumental variables, randomized trials) support causal claims.
What Causation Means
In everyday language, the meaning of causation is simple: A causes B when A makes B happen. Push a glass off a table and it falls. The push is the cause, the fall is the effect.
The precise statistical definition is narrower. In causal inference, we say $X$ causes $Y$ if intervening on $X$ would change the distribution of $Y$, holding everything else fixed. This is often written with potential outcomes. Let $Y(1)$ be the outcome when $X = 1$ and $Y(0)$ be the outcome when $X = 0$. The individual causal effect is:
$$Y(1) - Y(0)$$
The problem is that you can only observe one of these for any single unit. This is the fundamental problem of causal inference. You never see the same person both treated and untreated at the same moment.
Counterfactual theories formalize this. David Lewis defined causal dependence so that "Had C not occurred, E would not have occurred" captures the core idea [1]. This approach traces back to David Hume, who described the causal relation as one "where, if the first object had not been, the second never had existed" [1].
How It Works
Causal reasoning rests on three conditions that must all hold:
- Temporal order. The cause must precede the effect.
- Association. The cause and effect must be statistically related.
- No confounding. No third variable explains the relationship.
The third condition is where most analyses fail. A confounder is a variable that affects both the supposed cause and the supposed effect.
Formally, if $Z$ is a confounder, then:
$$P(Y \mid do(X)) \neq P(Y \mid X)$$
Here $P(Y \mid X)$ is what you observe in data, and $P(Y \mid do(X))$ is what would happen if you actively set $X$. The $do(\cdot)$ operator marks an intervention. When a confounder exists, these two quantities differ, and the observed association overstates or understates the true causal effect.
The Pearson correlation coefficient, which measures linear association, is:
$$r = \frac{\text{cov}(x, y)}{s_x \, s_y}$$
where $\text{cov}(x, y)$ is the sample covariance, and $s_x$ and $s_y$ are the sample standard deviations. A large $|r|$ means the variables move together. It does not mean one moves the other.
Worked Example
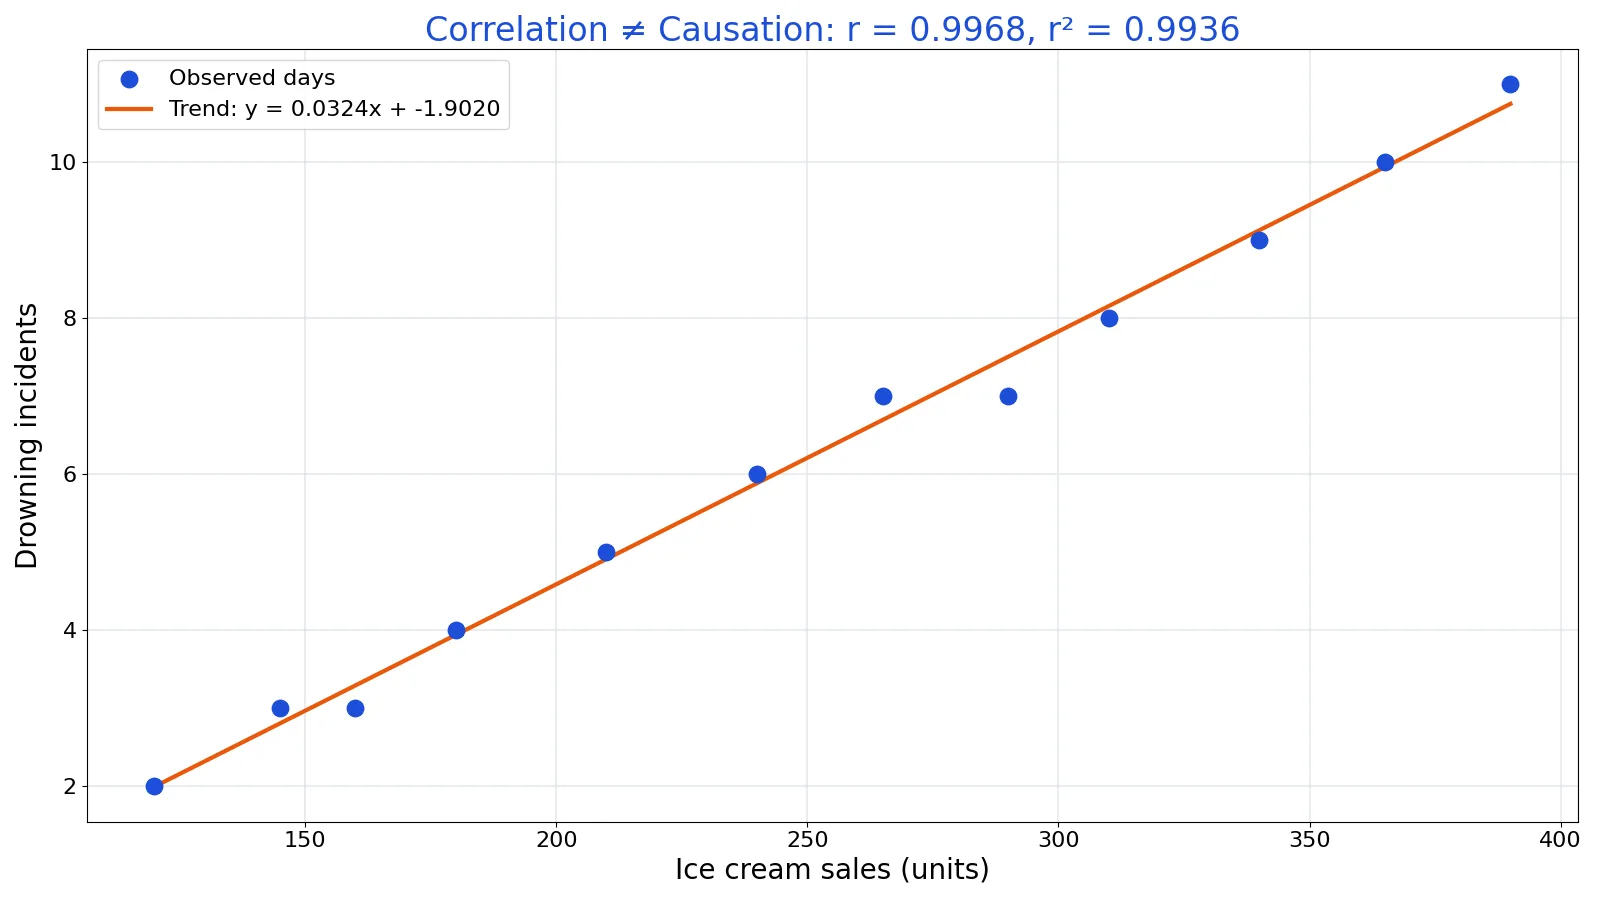
Consider 12 days of ice cream sales and drowning incidents. Both rise together across the summer, but eating ice cream does not cause drowning. Heat drives both.
| day | ice_cream_sales | drownings |
|---|---|---|
| 1 | 120 | 2 |
| 2 | 145 | 3 |
| 3 | 160 | 3 |
| 4 | 180 | 4 |
| 5 | 210 | 5 |
| 6 | 240 | 6 |
| 7 | 265 | 7 |
| 8 | 290 | 7 |
| 9 | 310 | 8 |
| 10 | 340 | 9 |
| 11 | 365 | 10 |
| 12 | 390 | 11 |
Step by step:
- Sample size: $n = 12$
- Mean ice cream sales: $\bar{x} = 251.2500$
- Mean drownings: $\bar{y} = 6.2500$
- Sample SD of $x$: $s_x = 89.9274$
- Sample SD of $y$: $s_y = 2.9271$
- Covariance: $\text{cov} = 262.3864$
- Pearson $r$: $262.3864 / (89.9274 \times 2.9271) = 0.9968$
- Coefficient of determination: $r^2 = 0.9968^2 = 0.9936$
- Regression slope: $262.3864 / 8086.9318 = 0.0324$
- Regression intercept: $6.2500 - 0.0324 \times 251.2500 = -1.9020$
- $t$-statistic for $r$: $0.9968 \times \sqrt{10 / 0.0064} = 39.3910$
import numpy as np
x = np.array([120,145,160,180,210,240,265,290,310,340,365,390])
y = np.array([2,3,3,4,5,6,7,7,8,9,10,11])
r = np.corrcoef(x, y)[0, 1]
slope, intercept = np.polyfit(x, y, 1)
Output:
r = 0.9968
r² = 0.9936
slope = 0.0324
intercept = -1.9020
t = 39.3910
The correlation is 0.9968, and $r^2 = 0.9936$ means 99.36% of the variation in drownings is explained by ice cream sales in this linear model. The $t$-statistic of 39.3910 is enormous. Every number points to a tight relationship. None of it establishes causation. The confounder is temperature, which raises both ice cream purchases and swimming activity.
How to Interpret It
Read a correlation as a description of co-movement, not a causal claim. A value near 1 or -1 means the points fall close to a straight line. It does not tell you why.
To move from association toward causation, ask three questions:
- Does the cause come before the effect in time?
- Is there a plausible mechanism?
- Have you ruled out confounders, reverse causation, and selection effects?
If the answer to the third question is no, treat the result as a hypothesis. The ice cream example fails the confounder test immediately. Temperature sits behind both variables.
The $t$-statistic tests whether the correlation differs from zero. A large value like 39.3910 gives a tiny $p$-value. That only says the association is unlikely to be a fluke of sampling. It says nothing about whether the association is causal.
When to Use It (and when not to)
Use causal language when your design supports it:
- Randomized controlled trials, where treatment is assigned by chance
- Natural experiments, where some external event creates quasi-random variation
- Instrumental variable designs, where a variable shifts the cause but not the effect directly
- Difference-in-differences, where a treated group is compared to a control group before and after an intervention
Avoid causal language when you only have observational data with no design for confounding. This covers most survey data, most business dashboards, and most correlational studies. You can still report the association. Just describe it as an association.
Causation vs Correlation
Correlation describes co-movement. Causation describes production of an effect. The table below separates them.
| Feature | Correlation | Causation |
|---|---|---|
| What it measures | Joint movement of two variables | One variable producing change in another |
| Direction | Symmetric, $r(x,y) = r(y,x)$ | Directional, cause precedes effect |
| Confounders | Can inflate or deflate it | Must be ruled out |
| Typical evidence | Scatter plots, $r$, $r^2$ | Experiments, causal designs |
| Ice cream example | $r = 0.9968$ | No causal link, heat is the confounder |
The phrase "correlation does not imply causation" is a warning, not a law. Correlation is not sufficient for causation, and it is not strictly necessary either, because a causal effect can be nonlinear or masked by an opposing confounder and show little linear correlation. You need a design that isolates the cause.
Common Mistakes
- Treating a high $r$ as proof of cause. The ice cream data show $r = 0.9968$ with no causal link. Fix: check for confounders before making causal claims.
- Ignoring reverse causation. Assuming $X$ causes $Y$ when $Y$ actually causes $X$. Fix: confirm the temporal order from the study design.
- Controlling for a mediator. Adjusting for a variable that sits on the causal path can erase a real effect. Fix: draw the causal diagram first and decide which variables are confounders.
- Confusing statistical significance with practical importance. A large $t$-statistic like 39.3910 shows the association is real, not that it matters. Fix: report effect sizes alongside $p$-values.
- Extrapolating beyond the data range. The fitted line here only applies to sales between 120 and 390 units. Fix: state the range your model covers.
- Assuming no confounder because you measured many variables. Unmeasured confounding can persist even with rich data. Fix: use a design that handles it, such as randomization.
Limitations
Correlation and regression cannot establish causation on their own. They describe patterns in the data you have. They cannot tell you what would happen under an intervention you never ran. The counterfactual is unobserved by construction, so any causal claim rests on assumptions you cannot test directly from the same dataset [1].
Even strong causal designs have limits. Randomized trials can suffer from noncompliance, attrition, and limited external validity. Observational causal methods depend on assumptions like no unmeasured confounding, which is often untestable. The ice cream example is easy because the confounder is obvious. In real datasets, confounders are frequently hidden, and the association may look just as convincing as a true causal effect [2].
Frequently Asked Questions
What is the simple definition of causation?
Causation is a relationship where one event or variable produces a change in another. The cause makes the effect happen. In statistics, we say $X$ causes $Y$ if intervening on $X$ would change $Y$. This is stronger than simply observing that the two move together.
How do you prove causation?
You prove causation with a design that rules out alternative explanations, most often a randomized controlled trial. Random assignment balances confounders across groups, so any difference in outcomes can be attributed to the treatment. When randomization is impossible, natural experiments and instrumental variables can support causal claims under stated assumptions.
Can correlation ever prove causation?
No. Correlation shows that two variables move together. It cannot rule out confounders, reverse causation, or coincidence. The ice cream and drowning example has $r = 0.9968$, yet neither causes the other. Both are driven by summer heat.
What is a confounder in simple terms?
A confounder is a third variable that affects both the supposed cause and the supposed effect. It creates a spurious association. In the ice cream example, temperature is the confounder because it raises both ice cream sales and drowning incidents. Controlling for it would shrink the correlation toward zero.
Why does the counterfactual definition matter?
The counterfactual definition frames causation as "had the cause not occurred, the effect would not have occurred" [1]. It matters because it makes the causal question precise and testable in principle. It also explains why causal inference is hard: you can never observe both the treated and untreated outcome for the same unit at the same time.
References
- Causality - Wikipedia
- Altman N, Krzywinski M (2015). Association, correlation and causation. Nature Methods
Further Reading
- Wilson G, Bryan J, Cranston K et al. (2017). Good enough practices in scientific computing. PLOS Computational Biology
- Wilkinson MD, Dumontier M, Aalbersberg IJ et al. (2016). The FAIR Guiding Principles for scientific data management and stewardship. Scientific Data
- NIST/SEMATECH e-Handbook of Statistical Methods
- Broman KW, Woo KH (2018). Data Organization in Spreadsheets. The American Statistician