Observation Definition in Statistics: What Counts as Data
By Dr. Zubair Khalid, DVM, MS, PhD ·
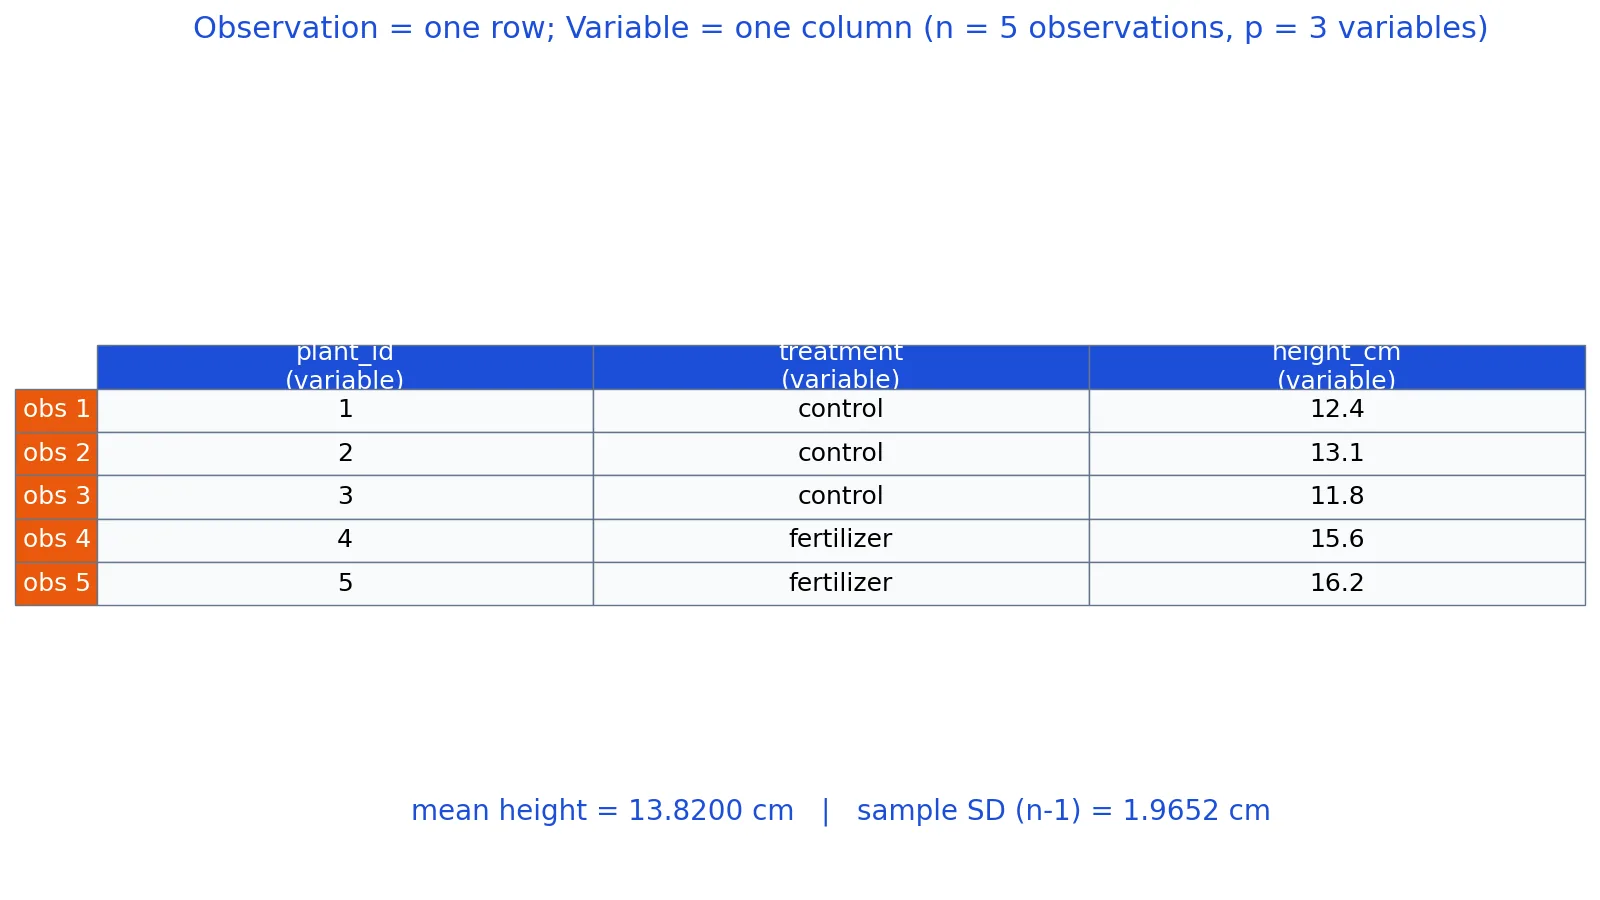
An observation is one complete unit of recorded information in a dataset. In a table, one observation is normally one row, and it holds the value of every variable measured on a single case, such as one person, one plant or one transaction. The observation definition matters because almost every count, average and test you run depends on knowing exactly what one observation is.
Quick Answer
- An observation is a single case measured on one or more variables.
- In a tidy dataset, each row is one observation and each column is one variable.
- The number of observations is usually written $n$, and the number of variables is written $p$.
- An observation can hold several values at once, one per variable, so a row with three columns is still one observation.
- Counting observations correctly controls the sample size used in every statistic you compute.
What an Observation Means
In plain language, an observation is one thing you recorded. If you weigh five plants and write down each weight, you have five observations. If you also record the treatment each plant received, each plant still counts as one observation, because the treatment and the height belong to the same case.
The precise statistical definition is narrower. An observation is the set of values of all variables measured on one sampling unit. That unit is the entity your study is about, and it can be a person, an animal, a plot of land, a machine, a day or a transaction. The values collected on that unit form a single vector, and the collection of all such vectors forms the sample.
This is why statisticians talk about observations coming from a population. Goodness-of-fit tests check whether it is reasonable to assume that a random sample comes from a specific distribution, and those tests operate on the individual observations [1]. The distribution describes the population, and each observation is one draw from it.
The term also appears in a looser sense. People say "the observations suggest" to mean the data as a whole. In a technical context, keep the strict meaning: one observation equals one sampling unit with all its measured values. That keeps your sample size honest and your analysis reproducible. For background on the wider idea, see what data means in science and analysis.
How It Works
The mechanism is simple bookkeeping. A dataset is a matrix with $n$ rows and $p$ columns.
$$X = \begin{bmatrix} x_{11} & x_{12} & \cdots & x_{1p} \\ x_{21} & x_{22} & \cdots & x_{2p} \\ \vdots & \vdots & \ddots & \vdots \\ x_{n1} & x_{n2} & \cdots & x_{np} \end{bmatrix}$$
Each symbol carries a specific meaning:
- $n$ is the number of observations, which is the number of rows.
- $p$ is the number of variables, which is the number of columns.
- $x_{ij}$ is the value of variable $j$ for observation $i$.
- Row $i$, written $(x_{i1}, x_{i2}, \ldots, x_{ip})$, is the full record for one case.
When you compute a statistic such as the mean, you usually work down one column. The mean of variable $j$ is:
$$\bar{x}_j = \frac{1}{n}\sum_{i=1}^{n} x_{ij}$$
The sum runs over observations, and $n$ is the number of observations, not the number of cells. A dataset with 5 rows and 3 columns has $n = 5$ observations and $p = 3$ variables, giving 15 cells. Confusing cells with observations inflates your sample size and makes standard errors too small.
The sample variance uses the same $n$:
$$s^2 = \frac{1}{n-1}\sum_{i=1}^{n}(x_i - \bar{x})^2$$
The $n-1$ in the denominator is the degrees of freedom correction for a sample. It is why the sample standard deviation is slightly larger than the population standard deviation computed on the same values.
Worked Example
Consider a small experiment with five plant height measurements and a treatment label. Each row is one observation.
| plant_id | treatment | height_cm |
|---|---|---|
| 1 | control | 12.4 |
| 2 | control | 13.1 |
| 3 | control | 11.8 |
| 4 | fertilizer | 15.6 |
| 5 | fertilizer | 16.2 |
The table has 5 rows and 3 columns, so the counts are:
- Number of observations (rows): $n = 5$
- Number of variables (columns): $p = 3$
Now compute the mean and standard deviation of the height variable.
- Sum of heights: $12.4 + 13.1 + 11.8 + 15.6 + 16.2 = 69.1000$
- Mean height: $69.1000 / 5 = 13.8200$
- Sample variance: $3.8620$
- Sample standard deviation: $\sqrt{3.8620} = 1.9652$
The same numbers come out of a spreadsheet. With the heights in cells B2 through B6, AVERAGE(B2:B6) returns 13.8200 and STDEV.S(B2:B6) returns 1.9652.
The same calculation in Python:
import statistics
heights = [12.4, 13.1, 11.8, 15.6, 16.2]
mean = statistics.mean(heights)
sd = statistics.stdev(heights)
print(mean, sd)
Output:
13.82 1.9651971911235773Notice that plant_id and treatment are variables too, but they are not part of the height average. The observation count stays at 5 for every column. The mean height is 13.8200 cm and the sample standard deviation is 1.9652 cm.
How to Interpret It
The observation count tells you how much independent information you have. Five plants give you five observations, so the mean height rests on five values. If two rows described the same plant measured twice, you would have repeated measures, and treating them as five independent observations would overstate your evidence.
Interpret the row as the unit of analysis. Ask what one row represents before you run anything. If one row is one customer, then $n$ is the number of customers. If one row is one purchase, then $n$ is the number of purchases, and a customer who bought three times contributes three observations. Both are valid, but they answer different questions.
The variable count tells you the dimensionality of each observation. A row with three columns is a point in three-dimensional space. Descriptive summaries such as the mean and standard deviation describe one column at a time, while methods like correlation and regression describe relationships between columns. For a refresher on those summaries, see descriptive statistics.
When to Use It
Use the observation concept whenever you need to state a sample size, run a hypothesis test, fit a model or report a confidence interval. Every formula that contains $n$ is asking for the number of observations, so getting the row definition right is the first step in any analysis.
Use it when you clean data too. Deciding whether a row is a duplicate, a repeated measure or a genuinely new case depends on what one observation means in your study. That decision changes whether you drop rows or keep them.
Do not treat the observation count as the number of measurements. A single observation can contain many measured values across its variables. Do not treat the number of cells as the sample size either. And do not assume that more rows always mean more information, because rows that describe the same unit are not independent. If your study design is observational, the interpretation of those rows differs from an experiment, as explained in observational vs experimental studies.
Observation vs Variable
The two terms are easy to swap, so keep them apart. An observation is a case, and a variable is a characteristic measured on that case.
| Aspect | Observation | Variable |
|---|---|---|
| What it is | One sampling unit | One measured characteristic |
| Position in a table | A row | A column |
| Count symbol | $n$ | $p$ |
| Example | Plant 4 | height_cm |
| Value | A vector of values | A single value per observation |
| Role in analysis | Defines sample size | Defines what you measure |
A dataset with 5 observations and 3 variables has 5 rows and 3 columns. Each observation holds 3 values, one for each variable. The distinction matters because statistics are computed along columns but counted along rows.
Common Mistakes
- Counting cells as observations. A 5 by 3 table has 5 observations, not 15. Fix: count rows, not entries.
- Counting variables as observations. Three columns do not mean three observations. Fix: identify the sampling unit first.
- Treating repeated measures as independent. Two rows for the same person are not two independent observations. Fix: use methods for repeated measures or aggregate to one row per unit.
- Forgetting that an observation can be multivariate. A row with ten columns is still one observation. Fix: read the row as a single case.
- Mixing units of analysis. One row per customer and one row per purchase give different $n$. Fix: state the unit of analysis before computing anything.
- Assuming every row is complete. Missing values mean an observation may hold fewer usable values. Fix: check missingness before you count.
Limitations
The row-equals-observation rule assumes a tidy dataset, where each row is one case and each column is one variable. Real datasets often break this. Long formats spread one case across many rows, and hierarchical data nests observations inside groups, so a flat row count can mislead you about the true sample size.
The concept also says nothing about data quality. A row can be a valid observation and still contain a typo, an outlier or a value recorded in the wrong unit. Counting observations correctly does not make them correct. And when observations are not independent, the effective sample size can be much smaller than the row count, which affects every standard error and p-value you compute.
Frequently Asked Questions
What is an observation in statistics?
An observation is one sampling unit with the values of all variables measured on it. In a table, it is one row. It is the basic unit that your sample size counts, and it is the thing a distribution is assumed to describe [1].
Is an observation the same as a row?
In a tidy dataset, yes. One row equals one observation, and one column equals one variable. If your data is stored in a long or nested format, one case may span several rows, so the row count and the observation count can differ.
How do I count observations in a dataset?
Count the rows, not the cells or the columns. A table with 5 rows and 3 columns has 5 observations and 3 variables. In a spreadsheet, the count of data rows below the header is your $n$.
Can one observation have multiple values?
Yes. An observation holds one value per variable, so a row with three columns carries three values. Those values belong together because they describe the same case, and they are analyzed as a single record.
Why does the number of observations matter?
It sets the sample size in every formula that uses $n$, including the mean, variance and standard error. Understating or overstating $n$ changes your estimates and the conclusions you draw from them. The distributional assumptions behind many tests are also stated in terms of the observations [1].
References
Further Reading
- 6.5.1. What do we mean by "Normal" data?
- Wilson G, Bryan J, Cranston K et al. (2017). Good enough practices in scientific computing. PLOS Computational Biology
- Wilkinson MD, Dumontier M, Aalbersberg IJ et al. (2016). The FAIR Guiding Principles for scientific data management and stewardship. Scientific Data
- NIST/SEMATECH e-Handbook of Statistical Methods
- Broman KW, Woo KH (2018). Data Organization in Spreadsheets. The American Statistician
Related Articles
- What Is Data? Definition, Meaning and Examples in Science
- What Is a Population in Statistics? Definition and Examples
- What Is Descriptive Statistics? Definition and Examples
- What Is Data Aggregation? Definition and Examples
- What Is an Ordinal Scale? Definition and Examples
- What Does Statistical Mean? A Clear Explanation
- Observational vs. Experimental Studies: How to Tell Them Apart