What Is AIC? Akaike Information Criterion Explained
By Dr. Zubair Khalid, DVM, MS, PhD ·
What is AIC? The Akaike Information Criterion is a single number that scores how well a model explains your data while charging a penalty for every parameter it uses. Lower AIC means a better trade-off between fit and complexity. You use it to rank competing models, not to judge one model in isolation.
Quick Answer
- AIC = $2k - 2\ln(L)$, where $k$ is the number of estimated parameters and $L$ is the model's maximized likelihood.
- Lower values are better. AIC is a relative score, so only differences between models fitted to the same data mean anything.
- The penalty term $2k$ discourages overfitting. Adding a parameter must improve the log-likelihood by more than 1 to lower AIC.
- AIC estimates out-of-sample predictive performance. It is derived as an asymptotically unbiased estimator of a function used for ranking candidate models, a variant of the Kullback-Leibler divergence between the true model and each candidate [1].
- AIC is widely used for variable selection in multivariable modeling and for choosing the optimal representation of explanatory variables [2].
What AIC Means
In plain terms, AIC answers one question: if this model had to predict new data from the same process, how much information would it lose? A model that fits the current data well loses less. A model stuffed with unnecessary parameters tends to lose more, because those parameters fit noise that will not repeat.
The precise definition comes from information theory. AIC is an asymptotically unbiased estimator of a function used for ranking candidate models, and that function is a variant of the Kullback-Leibler divergence between the true model and the approximating candidate model [1]. The Kullback-Leibler divergence measures how much one probability distribution differs from another. You never know the true model, so you cannot compute that divergence directly. AIC estimates it from the data you have.
The "Akaike" in AIC is Hirotugu Akaike, the statistician who proposed the criterion. People search for it as "aic akaike," "aic criterion," "aic information," and "aic information criterion." All of these refer to the same quantity.
How It Works
The formula is short:
$$\text{AIC} = 2k - 2\ln(L)$$
Each symbol:
- $k$ is the number of estimated parameters in the model, including the intercept. Some software also counts the error variance in a regression and some does not, so use one convention for every model you compare.
- $L$ is the maximum likelihood value achieved by the model, meaning the likelihood evaluated at the best-fitting parameter estimates.
- $\ln(L)$ is the natural log of that likelihood. It is usually negative, so $-2\ln(L)$ is usually positive.
- $2k$ is the complexity penalty. Every extra parameter adds 2 to AIC.
The two terms pull in opposite directions. More parameters raise the fit and make $\ln(L)$ less negative, which lowers the second term. But each parameter also adds 2 to the first term. A parameter earns its place only if it improves $-2\ln(L)$ by more than 2, which means improving $\ln(L)$ by more than 1.
AIC is on a relative scale. The absolute value depends on the sample size, the units of the outcome, and the likelihood function. Only differences between models fitted to the same data with the same outcome variable are interpretable.
Worked Example
The dataset is 20 sales observations with advertising spend and sales revenue.
| ad_spend | sales | ad_spend | sales |
|---|---|---|---|
| 10 | 22 | 30 | 45 |
| 12 | 25 | 32 | 48 |
| 14 | 27 | 34 | 50 |
| 16 | 30 | 36 | 52 |
| 18 | 31 | 38 | 55 |
| 20 | 34 | 40 | 57 |
| 22 | 36 | 42 | 60 |
| 24 | 38 | 44 | 62 |
| 26 | 41 | 46 | 65 |
| 28 | 43 | 48 | 68 |
Two models are compared. Model A uses ad spend alone. Model B adds a second predictor.
Step by step:
- Sample size: $n = 20$.
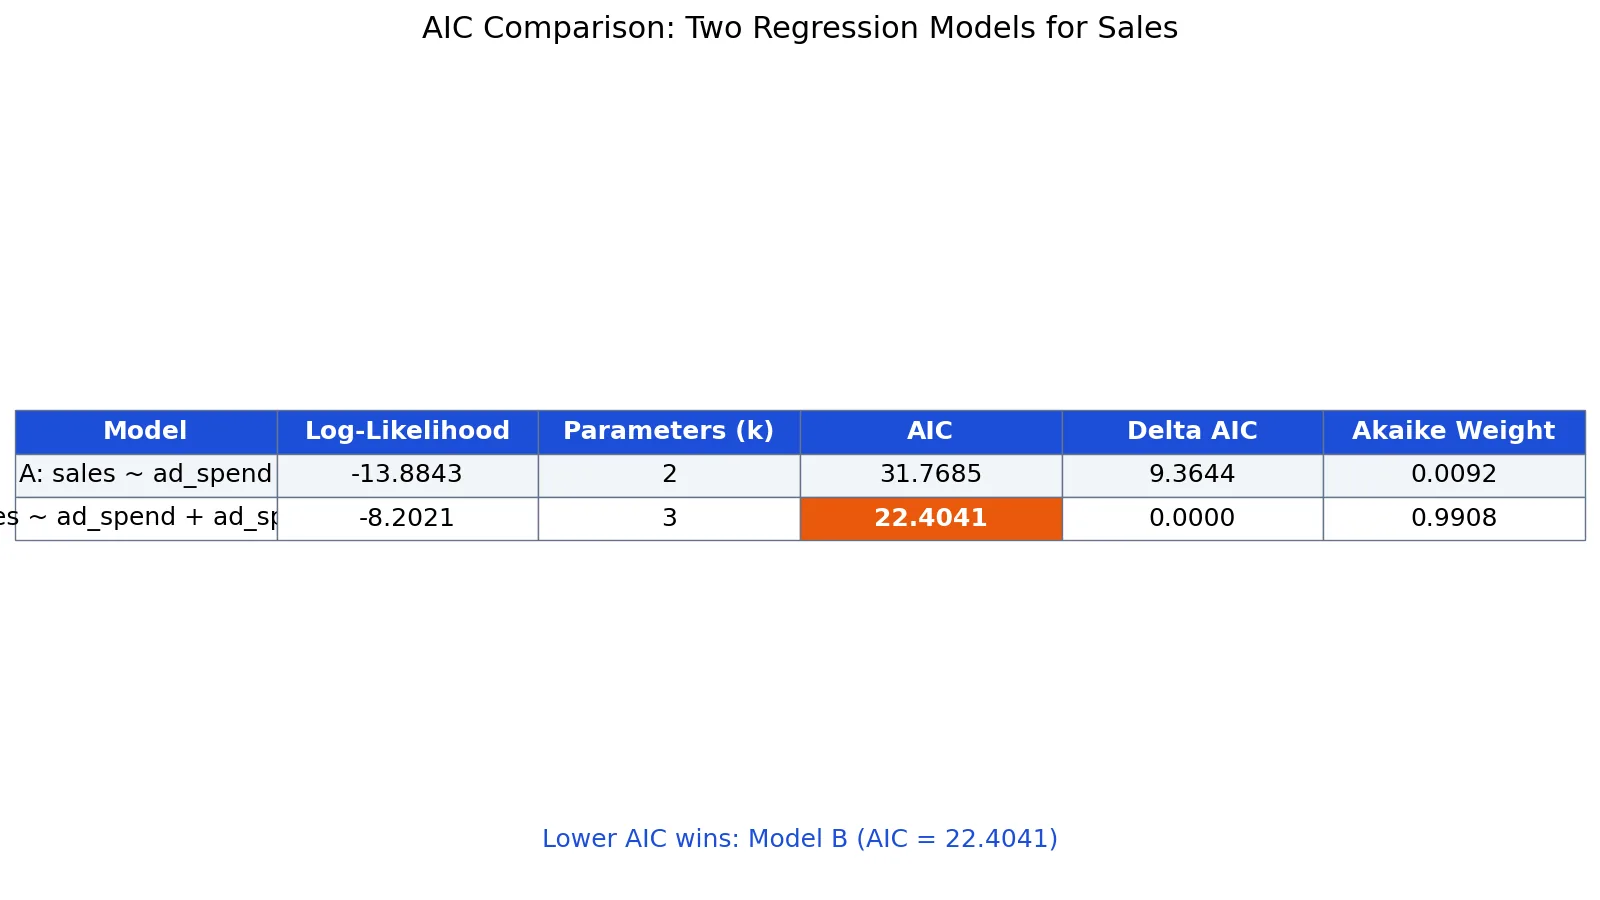
- Model A log-likelihood: $\ln(L_A) = -13.8843$ with $k_A = 2$ parameters.
- Model A AIC: $2 \times 2 - 2 \times (-13.8843) = 31.7685$.
- Model B log-likelihood: $\ln(L_B) = -8.2021$ with $k_B = 3$ parameters.
- Model B AIC: $2 \times 3 - 2 \times (-8.2021) = 22.4041$.
- Delta AIC for A: $31.7685 - 22.4041 = 9.3644$.
- Delta AIC for B: $22.4041 - 22.4041 = 0.0000$.
- Akaike weight for A: $0.0092$.
- Akaike weight for B: $0.9908$.
Model B wins. It spends one extra parameter and gains far more than 2 units of log-likelihood, so the penalty is worth paying.
The code that produces the Model A value:
import statsmodels.api as sm
X = sm.add_constant(df['ad_spend'])
m = sm.OLS(df['sales'], X).fit()
aic = 2*2 - 2*m.llf  # -> 31.7685 (Model B adds ad_spend squared and gives 22.4041)
Output:
AIC_A = 31.7685, AIC_B = 22.4041, best = B| Model | k | Log-likelihood | AIC | Delta AIC | Akaike weight |
|---|---|---|---|---|---|
| A | 2 | -13.8843 | 31.7685 | 9.3644 | 0.0092 |
| B | 3 | -8.2021 | 22.4041 | 0.0000 | 0.9908 |
How to Interpret It
Start with delta AIC, the difference between each model's AIC and the lowest AIC in the set. The best model has a delta of 0.
A common reading guide:
- Delta 0 to 2: the models are close. The data do not clearly separate them.
- Delta 4 to 7: considerably less support for the higher-AIC model.
- Delta greater than 10: essentially no support for the higher-AIC model.
Akaike weights turn deltas into proportions. The weight for model $i$ is:
$$w_i = \frac{\exp(-0.5 \Delta_i)}{\sum_j \exp(-0.5 \Delta_j)}$$
Weights across the candidate set sum to 1. In the example, Model B carries 0.9908 of the weight and Model A carries 0.0092. That is a strong preference for B, not proof that B is the true model.
When to Use It (and when not to)
Use AIC when you are comparing two or more candidate models fitted to the same data, the same outcome, and the same sample, and your goal is prediction or selecting a reasonable representation of your predictors. It works well for choosing among variable sets, functional forms, and distributional assumptions. AIC has been used to determine the optimal representation of dietary variables in a longitudinal dental study, where multiple approaches to summarizing intake over time were compared [2].
Do not use AIC when:
- The models use different transformations of the outcome. Comparing a model of raw sales to a model of log sales is invalid.
- The sample is very small. AIC's derivation is asymptotic, and the penalty is too light in small samples. Use AICc instead.
- You need a hypothesis test with a p-value. AIC ranks models, it does not test a null hypothesis.
- You want to know whether a model is "true." AIC never identifies truth, only relative expected predictive loss.
AIC vs BIC
BIC, the Bayesian Information Criterion, has the same first term and a heavier penalty.
$$\text{BIC} = k\ln(n) - 2\ln(L)$$
| Feature | AIC | BIC |
|---|---|---|
| Penalty per parameter | $2k$ | $k\ln(n)$ |
| Penalty at n = 20 | 2 per parameter | about 3.0 per parameter |
| Goal | Predictive accuracy | Identifying a true model among candidates |
| Behavior as n grows | Penalty stays fixed | Penalty grows with sample size |
| Tends to choose | Larger models | Smaller models |
When $n$ is 8 or more, $\ln(n)$ exceeds 2, so BIC penalizes complexity harder than AIC. If your goal is prediction, AIC is usually the better fit. If you believe one of your candidates is the true data-generating process and you want to find it, BIC is the more aggressive tool.
Common Mistakes
- Comparing AIC across different datasets or different outcome variables. The fix: only compare models fitted to identical rows and the same response variable.
- Treating a small AIC difference as decisive. The fix: report delta AIC and Akaike weights, and treat deltas under 2 as a tie.
- Forgetting that the error variance counts as a parameter. The fix: in ordinary least squares, counting the intercept, the slope and the residual variance gives $k = 3$ for a simple regression. Some software, such as statsmodels in the example, counts only the intercept and slope ($k = 2$), so keep one convention across all models you compare.
- Using AIC to compare models with different fixed effects structures in mixed models fitted by different methods. The fix: keep the estimation method and the random effects structure consistent, or use a criterion designed for that comparison.
- Reporting AIC as an absolute quality score. The fix: describe it as a relative ranking tool and always show the comparison set.
- Ignoring small-sample bias. The fix: when $n$ is small relative to $k$, use AICc, which adds a correction term.
Limitations
AIC cannot tell you whether your candidate set contains a good model. If every model you fit is poor, AIC will still rank them and hand you a winner. It also says nothing about the absolute fit of the best model, so a low AIC does not mean the model is adequate. Always check residual diagnostics alongside the criterion.
The criterion is derived asymptotically, so its penalty is too weak when the sample is small relative to the number of parameters. It also assumes the models are fitted by maximum likelihood. If you fit by a different method, the log-likelihood you plug in may not be comparable across models. Finally, AIC targets predictive performance, so it can favor a model that is more complex than the one that generated the data.
Frequently Asked Questions
What is a good AIC value?
There is no good or bad AIC in absolute terms. AIC depends on the sample size, the scale of the outcome, and the likelihood function, so a value of 31.7685 is not inherently better than 100. What matters is the difference between models fitted to the same data. Lower is better within a comparison set.
Can AIC be negative?
Yes. When the log-likelihood is positive, which happens when the likelihood exceeds 1, the term $-2\ln(L)$ is negative and can outweigh $2k$. This occurs with continuous distributions where the density can exceed 1. A negative AIC is not a problem and does not change the interpretation.
What is the difference between AIC and AICc?
AICc adds a small-sample correction to AIC:
$$\text{AICc} = \text{AIC} + \frac{2k(k+1)}{n-k-1}$$
The correction shrinks toward zero as $n$ grows. Use AICc when the ratio of sample size to parameters is small, roughly when $n/k$ is below 40. For large samples the two criteria give nearly identical rankings.
Does a lower AIC mean a better model?
It means the model has a better expected trade-off between fit and complexity for prediction. It does not mean the model is correct, well specified, or useful for your research question. A lower AIC is evidence, not proof, and it should be combined with diagnostic checks and subject-matter reasoning.
Can I use AIC to compare a linear model and a logistic model?
No. The two models have different likelihood functions and different outcome types, so their AIC values are not on the same scale. AIC comparisons require the same data, the same response variable, and the same likelihood family.
References
- Seghouane AK, Amari S. (2007). The AIC criterion and symmetrizing the Kullback-Leibler divergence. IEEE transactions on neural networks
- VanBuren J, Cavanaugh J, Marshall T, Warren J, Levy SM. (2017). AIC identifies optimal representation of longitudinal dietary variables. Journal of public health dentistry
Further Reading
- NIST/SEMATECH e-Handbook of Statistical Methods
- Altman N, Krzywinski M (2015). Simple linear regression. Nature Methods
- OpenStax. Introductory Statistics 2e
- Krzywinski M, Altman N (2013). Importance of being uncertain. Nature Methods