Extrapolation in Regression: Definition and Dangers
By Dr. Zubair Khalid, DVM, MS, PhD ·
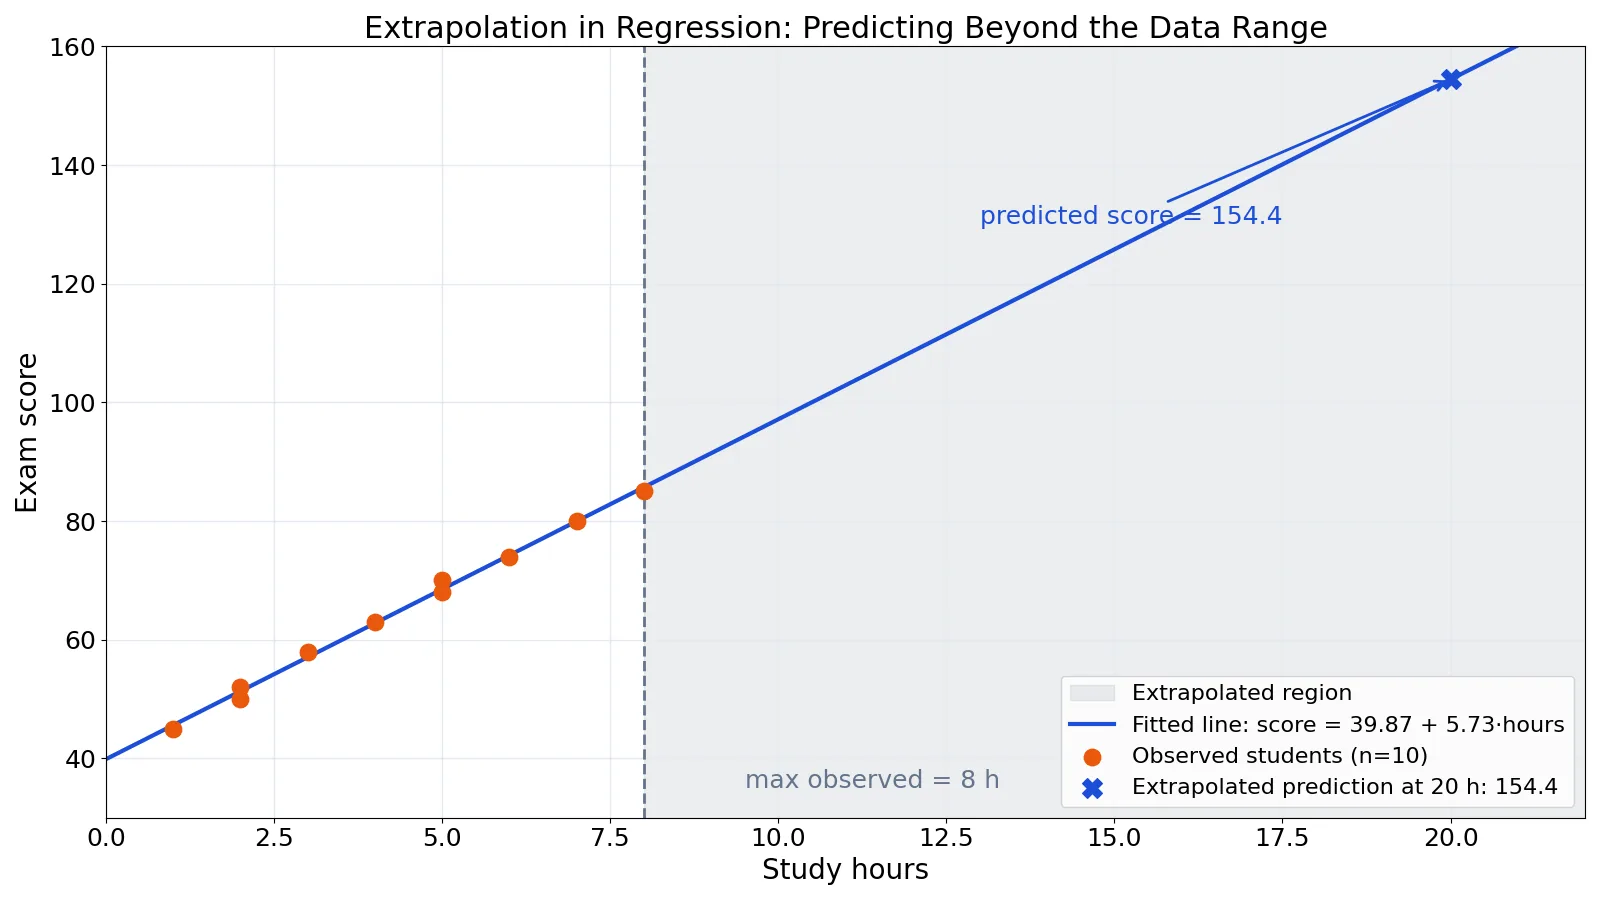
Extrapolation in regression means using a fitted model to predict values outside the range of the data you actually observed. If your study hours data runs from 1 to 8 hours, then predicting a score at 20 hours is an extrapolation. The math still returns a number, but that number rests on an assumption you cannot check: that the same straight-line relationship keeps holding far beyond anything you measured [1].
Quick Answer
- Extrapolation is prediction outside the range of the observed explanatory variable. Interpolation stays inside that range.
- The regression equation does not know where your data ends. It will happily return a prediction at any input you type.
- The danger is model misspecification. A straight line may fit well from 1 to 8 hours and fail badly at 20.
- Extrapolated predictions carry uncertainty that standard formulas understate, because they only reflect sampling error, not the wrong-shape risk [2].
- The further outside the observed range you go, the less you can trust the result, and the harder it is to detect the problem [3].
What Extrapolation Means
In plain language, extrapolation is guessing beyond your evidence. You measured a relationship over some range, and you use it to make a claim about a region you never observed.
The precise statistical definition is narrower. In regression, extrapolation occurs when you evaluate the fitted model at a combination of explanatory variable values that lies outside the region covered by the observed data [3]. For a single explanatory variable, that region is just the interval from the smallest to the largest observed x value. For two or more explanatory variables, the region is a multidimensional cloud, and a point can sit inside the range of each variable separately while still lying outside the cloud they jointly occupy [3]. That makes extrapolation harder to spot in multiple regression than in simple regression.
The related searches for "extrapolations meaning" usually point to the same idea: extending a trend past the data that defined it.
How It Works
A simple linear regression fits the line
$$\hat{y} = b_0 + b_1 x$$
where $\hat{y}$ is the predicted value of the response, $b_0$ is the intercept (the predicted response when $x = 0$), $b_1$ is the slope (the predicted change in the response for a one-unit increase in $x$), and $x$ is the value of the explanatory variable you are predicting at.
The slope is computed as
$$b_1 = \frac{S_{xy}}{S_{xx}}$$
where $S_{xy} = \sum (x_i - \bar{x})(y_i - \bar{y})$ is the sum of cross-products and $S_{xx} = \sum (x_i - \bar{x})^2$ is the sum of squared deviations of x. The intercept follows from $b_0 = \bar{y} - b_1 \bar{x}$.
Nothing in these formulas restricts $x$. Plug in 8 and you get an interpolation at the edge of the data. Plug in 20 and you get an extrapolation. The arithmetic is identical. The interpretation is not.
The standard error of a prediction grows as you move away from the mean of x, and it keeps growing the further you go outside the observed range. That widening is real, but it only accounts for sampling variability. It does not account for the possibility that the true relationship curves, plateaus, or reverses outside the range you studied [2].
Worked Example
The dataset is study hours versus exam score for 10 students, with hours observed from 1 to 8.
| hours | score |
|---|---|
| 1 | 45 |
| 2 | 52 |
| 3 | 58 |
| 4 | 63 |
| 5 | 70 |
| 6 | 74 |
| 7 | 80 |
| 8 | 85 |
| 2 | 50 |
| 5 | 68 |
Step by step:
- Sample size $n = 10$
- Mean hours $\bar{x} = 4.3000$
- Mean score $\bar{y} = 64.5000$
- $S_{xx} = 48.1000$
- $S_{xy} = 275.5000$
- Slope $b_1 = 275.5000 / 48.1000 = 5.7277$
- Intercept $b_0 = 64.5000 - 5.7277 \times 4.3000 = 39.8711$
- Fitted line: $\text{score} = 39.8711 + 5.7277 \times \text{hours}$
- Prediction at 8 hours (edge of data): $39.8711 + 5.7277 \times 8 = 85.6923$
- Extrapolation at 20 hours: $39.8711 + 5.7277 \times 20 = 154.4241$
- Residual standard error: $\sqrt{6.5322 / 8} = 0.9036$
The same result comes out of a spreadsheet. SLOPE(y_range, x_range) returns 5.7277, INTERCEPT(y_range, x_range) returns 39.8711, and FORECAST.LINEAR(20, y_range, x_range) returns 154.4241.
Here is the same fit in Python:
import numpy as np
hours = np.array([1,2,3,4,5,6,7,8,2,5], dtype=float)
scores = np.array([45,52,58,63,70,74,80,85,50,68], dtype=float)
b1, b0 = np.polyfit(hours, scores, 1)
print(f"Fitted line: score = {b0:.4f} + {b1:.4f}*hours")
print(f"Prediction at 8 h (edge of data): {b0 + b1*8:.4f}")
print(f"Extrapolation at 20 h: {b0 + b1*20:.4f}")
resid = scores - (b0 + b1*hours)
print(f"Residual standard error: {np.sqrt((resid**2).sum() / 8):.4f}")
Output:
Fitted line: score = 39.8711 + 5.7277*hours
Prediction at 8 h (edge of data): 85.6923
Extrapolation at 20 h: 154.4241
Residual standard error: 0.9036
The prediction of 154.4 is impossible on its face. Exam scores in this dataset top out at 85, and a typical scoring scale caps well below 154. The model produced it anyway, because a straight line has no ceiling. That is the core danger in one line of arithmetic.
How to Interpret It
Read an extrapolated prediction as a conditional statement, not a fact. It says: if the straight-line relationship that held from 1 to 8 hours continues unchanged at 20 hours, then the predicted score is 154.4. The "if" is doing all the work, and you have no data to support it.
Inside the observed range, you can lean on the fitted line and its diagnostics. Check the assumptions of linear regression, look at residual plots, and confirm the errors behave roughly as the model expects [4]. Outside the range, those checks are unavailable by construction. You cannot plot residuals where you have no observations.
A practical habit is to report the observed range alongside any prediction. State that the model was fit on hours from 1 to 8 and that the prediction at 20 is an extrapolation. That single sentence prevents most misuse.
When to Use It (and when not to)
Use interpolation freely. Predicting a score at 6.5 hours, a value inside the observed range, is well supported by the data.
Use extrapolation only when you have a defensible reason to believe the relationship is stable beyond the observed range. Physical laws sometimes justify this. A calibration curve built from known standards can be extended a short distance when the underlying chemistry is linear over a wider band than you measured. Even then, keep the extension small and state the assumption.
Do not extrapolate when the mechanism could change. Scores cannot exceed the maximum possible score. Growth curves flatten. Dose-response relationships can reverse at high doses. Economic relationships shift with policy. In each case the straight line is a local approximation, and the further out you push it, the more likely it is to be wrong [1].
A useful middle path is to treat the extrapolated value as a hypothesis to test, not an answer to report. Collect data in the new region and refit.
Extrapolation vs Interpolation
Both use the same fitted model. The difference is where you evaluate it.
| Feature | Interpolation | Extrapolation |
|---|---|---|
| Location of prediction | Inside the observed range of x | Outside the observed range of x |
| Data support | Direct, nearby observations exist | No observations in that region |
| Residual checks | Possible | Not possible |
| Main risk | Ordinary sampling error | Wrong model shape |
| Typical trust level | Reasonable if assumptions hold | Low unless justified by theory |
The distinction matters most in multiple regression, where a point can be inside the range of every individual variable yet still outside the joint region the data covers [3]. Checking each variable separately is not enough.
Common Mistakes
- Reporting an extrapolated value as a finding. Fix: label it as an extrapolation and state the observed range next to it.
- Assuming the software will warn you. Fix: check the input against the minimum and maximum of your data yourself before trusting any prediction.
- Trusting the prediction interval as a full uncertainty statement. Fix: remember that the interval reflects sampling error, not the risk that the model shape is wrong outside the range [2].
- Extrapolating a response that has a natural ceiling or floor. Fix: ask whether the predicted value is even possible before interpreting it.
- Checking only per-variable ranges in multiple regression. Fix: examine the joint region of the explanatory variables, since a point can be inside each range and still outside the data cloud [3].
- Extending a fitted line to x = 0 to interpret the intercept. Fix: treat the intercept as a mathematical anchor unless zero is inside the observed range.
Limitations
Extrapolation cannot be validated with the data you already have. Every diagnostic you would normally use, residual plots, leverage checks, influence measures, requires observations in the region you are predicting into [4]. Without them, you are relying on an assumption about model form that no amount of fitting can confirm.
The uncertainty you can compute is also incomplete. Standard prediction intervals widen as you move away from the center of the data, which is honest about sampling variability, but they assume the model is correctly specified [2]. If the true relationship bends outside the observed range, the interval is wrong in a way it cannot reveal. This is why extrapolated predictions can look precise and still be badly off.
Frequently Asked Questions
What is the simple definition of extrapolation?
Extrapolation is the act of estimating a value outside the range of data you observed. In regression, it means plugging an x value into the fitted equation when that x lies beyond the smallest or largest x in your dataset. It contrasts with interpolation, which stays inside the observed range.
Why is extrapolation dangerous in regression?
Because the fitted model is only supported where you have data. A straight line may describe the observed range perfectly and still be the wrong shape further out. The equation returns a confident-looking number regardless, and the usual diagnostics cannot detect the problem because there are no observations to check against [1].
Does a wider prediction interval make extrapolation safe?
No. The interval widens as you move away from the data, which reflects sampling uncertainty, but it assumes the model form is correct [2]. If the relationship curves or plateaus outside the observed range, the interval is misleading no matter how wide it looks.
How do I know if I am extrapolating?
Compare your prediction input against the observed range of the explanatory variables. If it falls outside, you are extrapolating. In multiple regression, also check whether the combination of values sits inside the joint region the data covers, since a point can be inside each variable's range and still be outside the data cloud [3].
Can extrapolation ever be acceptable?
Yes, when you have a strong external reason to believe the relationship holds beyond the observed range, such as a known physical or chemical law, and when the extension is short. Even then, report it as an assumption-based estimate and consider collecting data in the new region to confirm it [1].
References
- Altman DG, Bland JM (1998). Generalisation and extrapolation. BMJ
- Altman DG, Bland JM (2014). Uncertainty beyond sampling error. BMJ
- Bartley ML, Hanks EM, Schliep EM, Soranno PA, Wagner T. (2019). Identifying and characterizing extrapolation in multivariate response data. PloS one
- Altman N, Krzywinski M (2016). Regression diagnostics. Nature Methods
Further Reading
- NIST/SEMATECH e-Handbook of Statistical Methods
- Altman N, Krzywinski M (2015). Simple linear regression. Nature Methods