What Is a Lurking Variable? Definition and Examples
By Dr. Zubair Khalid, DVM, MS, PhD ·
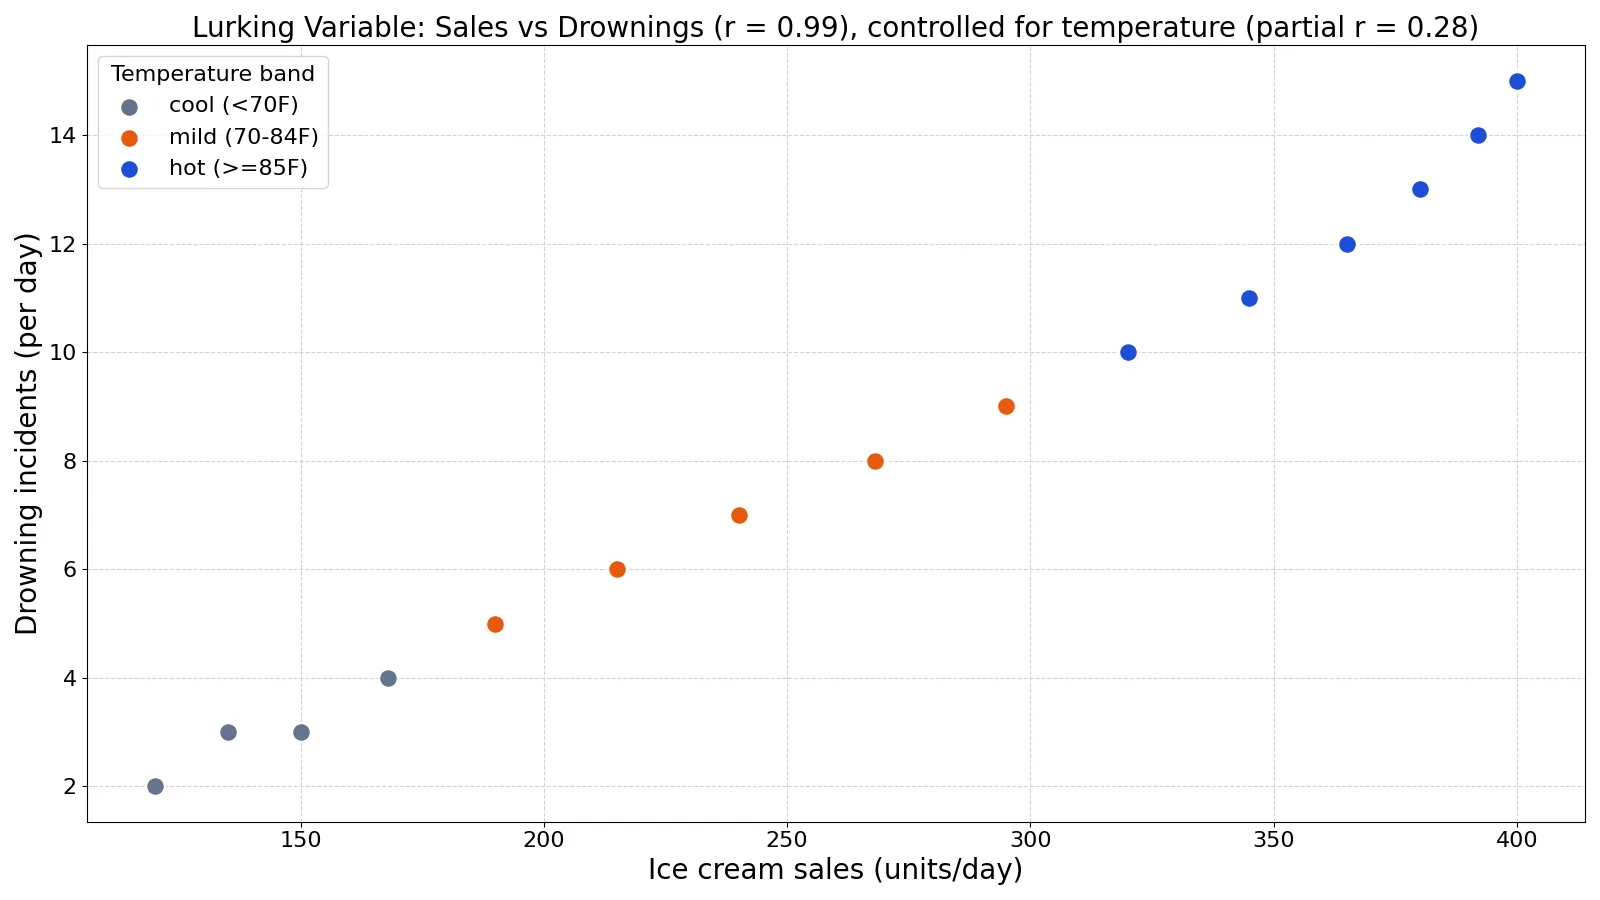
A lurking variable is a variable that was not measured in a study but still shapes the relationship between the variables you did measure. It is a third variable, neither the explanatory variable nor the response variable, and it can make two unrelated quantities look strongly connected [1]. Because you never recorded it, no amount of arithmetic on your existing columns will reveal it on its own.
Quick Answer
- A lurking variable is unmeasured and unaccounted for, yet it affects how you read the relationship between your explanatory and response variables [1].
- It is a special case of a confounding variable: every lurking variable is a potential confounder, but a confounder you measured and included in the analysis is no longer lurking [2].
- The classic symptom is a strong correlation with no plausible causal mechanism, such as ice cream sales and drowning incidents.
- The fix is to measure the suspected variable and control for it, usually with a partial correlation or a regression model.
- Correlation alone never proves causation, and a lurking variable is one of the main reasons why [3].
What a Lurking Variable Means
In plain terms, a lurking variable is the thing you forgot to write down. You collected two columns of data, found a pattern, and started telling a story about cause and effect. The lurking variable is the hidden third factor that is actually driving both columns.
The precise statistical definition is narrower. A lurking variable is a variable that is not measured in the study, is neither the explanatory nor the response variable, and affects your interpretation of the relationship between those two variables [1]. The word "lurking" describes its status in your dataset, not its nature. The same physical quantity can be a confounder in one study and a lurking variable in another, depending on whether anyone recorded it [2].
This matters because a lurking variable can do two opposite things. It can manufacture a correlation where none exists, or it can mask a real one. Both failures come from the same source: an omitted variable that influences the two variables you are comparing.
How It Works
The mechanism is easiest to see with the correlation formula. For two variables $x$ and $y$, the Pearson correlation is
$$r_{xy} = \frac{\sum_{i=1}^{n}(x_i - \bar{x})(y_i - \bar{y})}{\sqrt{\sum_{i=1}^{n}(x_i - \bar{x})^2}\sqrt{\sum_{i=1}^{n}(y_i - \bar{y})^2}}$$
Each symbol means the following.
- $x_i$ and $y_i$ are the two measurements for case $i$.
- $\bar{x}$ and $\bar{y}$ are the sample means of each variable.
- $n$ is the number of cases.
- The numerator measures how the two variables move together. The denominator rescales that number so $r$ falls between $-1$ and $1$.
Now suppose a lurking variable $z$ drives both $x$ and $y$. When $z$ rises, $x$ and $y$ both rise, so the paired deviations in the numerator tend to share a sign and the correlation inflates. The formula has no way to know that $z$ exists, because $z$ is not in it.
The standard remedy is the partial correlation, which removes the linear effect of the suspected variable $z$ from both $x$ and $y$ before correlating what is left:
$$r_{xy \cdot z} = \frac{r_{xy} - r_{xz}\,r_{yz}}{\sqrt{\left(1 - r_{xz}^{2}\right)\left(1 - r_{yz}^{2}\right)}}$$
Here $r_{xy}$ is the raw correlation between your two variables, $r_{xz}$ is the correlation between $x$ and the suspected lurking variable, and $r_{yz}$ is the correlation between $y$ and that same variable. If $z$ is the real driver, the partial correlation collapses toward zero. If a genuine link survives, the partial correlation stays meaningfully large.
Worked Example
The dataset below covers 15 ice cream shops. For each shop it records the daily temperature in Fahrenheit, the ice cream sales in units, and the number of drowning incidents reported in the same area that day.
| Shop | Temp (F) | Ice cream sales | Drownings |
|---|---|---|---|
| S01 | 58 | 120 | 2 |
| S02 | 61 | 135 | 3 |
| S03 | 64 | 150 | 3 |
| S04 | 67 | 168 | 4 |
| S05 | 70 | 190 | 5 |
| S06 | 73 | 215 | 6 |
| S07 | 76 | 240 | 7 |
| S08 | 79 | 268 | 8 |
| S09 | 82 | 295 | 9 |
| S10 | 85 | 320 | 10 |
| S11 | 88 | 345 | 11 |
| S12 | 91 | 365 | 12 |
| S13 | 94 | 380 | 13 |
| S14 | 97 | 392 | 14 |
| S15 | 100 | 400 | 15 |
The raw correlations come out as follows.
- Sales and drownings: numerator 5893.9333, denominator 5923.7782, so $r = 0.9950$.
- Temperature and drownings: numerator 801.0000, denominator 802.7752, so $r = 0.9978$.
- Sales and temperature: numerator 18510.0000, denominator 18595.3943, so $r = 0.9954$.
Taken at face value, sales and drownings move together almost perfectly. Nobody seriously believes that buying a cone causes drowning. Temperature is the lurking variable: hot days push ice cream sales up and also push more people into the water.
Controlling for temperature with the partial correlation formula gives
$$r_{\text{sales} \cdot \text{drownings} \mid \text{temp}} = \frac{0.9950 - (0.9954)(0.9978)}{\sqrt{\left(1 - 0.9954^{2}\right)\left(1 - 0.9978^{2}\right)}} = 0.2759$$
The correlation drops from 0.9950 to 0.2759 once temperature is held constant. The 0.2759 comes from the unrounded correlations, because plugging the four-decimal values into the formula gives about 0.28. That is the signature of a lurking variable doing the work.
Here is the same analysis in Python.
import pandas as pd, numpy as np
df = pd.DataFrame({
    'temp_F': [58, 61, 64, 67, 70, 73, 76, 79, 82, 85, 88, 91, 94, 97, 100],
    'ice_cream_sales': [120, 135, 150, 168, 190, 215, 240, 268, 295, 320, 345, 365, 380, 392, 400],
    'drownings': [2, 3, 3, 4, 5, 6, 7, 8, 9, 10, 11, 12, 13, 14, 15]
})
r_sd = df['ice_cream_sales'].corr(df['drownings'])
r_td = df['temp_F'].corr(df['drownings'])
r_st = df['ice_cream_sales'].corr(df['temp_F'])
partial = (r_sd - r_st * r_td) / np.sqrt((1 - r_st**2) * (1 - r_td**2))
print(f"r(sales, drownings) = {r_sd:.4f}")
print(f"r(temp, drownings) = {r_td:.4f}")
print(f"r(sales, temp) = {r_st:.4f}")
print(f"partial r(sales, drownings | temp) = {partial:.4f}")
Output:
r(sales, drownings) = 0.9950
r(temp, drownings) = 0.9978
r(sales, temp) = 0.9954
partial r(sales, drownings | temp) = 0.2759
How to Interpret It
Read the raw correlation as a description of what you observed, not as an explanation of why. A value of 0.9950 tells you the two columns move together in this sample. It says nothing about which one moves the other, or whether a third factor moves both [3].
Read the partial correlation as the association that survives after you account for the suspected variable. A drop from 0.9950 to 0.2759 means temperature explains nearly all of the observed link. The residual 0.2759 is small and, with only 15 cases, could easily be noise.
Two cautions apply to every partial correlation. First, it only removes the linear effect of the variable you name. If the true lurking variable is something else, the partial correlation will not help. Second, a partial correlation near zero does not prove that no causal link exists. It proves that this particular control removed the association.
When to Use It (and when not to)
Use the concept of a lurking variable whenever you analyze observational data. You cannot randomly assign people to smoke or to live near a highway, so questions like whether pollution causes warming or whether cell phone use causes tumors stay open to alternative explanations [1]. In those settings, the lurking variable is the first thing a skeptical reader will ask about.
Reach for a partial correlation or a regression control when you can name a plausible third variable and you have measured it. If you can measure it, it stops being lurking and becomes an ordinary covariate.
Do not reach for it when you ran a randomized experiment. Random assignment balances unmeasured variables across groups on average, which is exactly why experiments support causal claims and observational studies usually do not [3]. Also skip the partial correlation when your sample is tiny. With few cases, partial correlations are unstable and easy to over-read.
Lurking Variable vs Confounding Variable
The two terms overlap heavily, and many textbooks use them almost interchangeably. The distinction is about measurement and role, not about the underlying statistics.
| Feature | Lurking variable | Confounding variable |
|---|---|---|
| Measured in the study? | No [1] | Yes, or at least identified |
| Related to the explanatory variable? | Usually, but unknown | Yes [2] |
| Affects the response variable? | Yes | Yes [2] |
| Can you control for it directly? | No, you must collect it first | Yes, in the model |
| Relationship to the other term | A potential confounder that was never measured [2] | The broader category |
The practical rule: a confounder you measured is a nuisance you can adjust for. A confounder you did not measure is a lurking variable, and it can quietly invalidate your conclusion [2]. If you are still sorting out which variable plays which role in a design, the breakdown of dependent variable examples is a useful companion read.
Common Mistakes
- Treating a high $r$ as proof of causation. A correlation near 1 or -1 means the variables vary together predictably, not that one causes the other [3]. Fix: state the association, then list the plausible third variables before making any causal claim.
- Assuming a lurking variable only inflates correlations. It can also hide a real relationship. Fix: check for suppression by comparing raw and partial correlations, not just the raw one.
- Controlling for a variable that sits on the causal path. If temperature causes sales and sales cause something downstream, adjusting for the middle variable distorts the estimate. Fix: draw the causal diagram before you choose controls.
- Relying on the correlation number without a scatterplot. Correlation measures linear relationships and is sensitive to outliers, so it should supplement a scatterplot, not replace it [1]. Fix: plot the data first, every time.
- Forgetting that partial correlation only removes linear effects. A nonlinear confounder can survive the adjustment. Fix: inspect residuals or bin the data by the suspected variable.
- Believing a large sample fixes an unmeasured variable. More rows shrink your standard errors but do nothing about a variable that is not in the file. Fix: measure the variable or soften the claim.
Limitations
A lurking variable is defined by absence, which makes it impossible to detect from the data alone. No test will flag a column you never collected. You can only reason about it from domain knowledge, prior studies, and the plausibility of the causal story. That means the analysis depends on judgment as much as on arithmetic.
Partial correlation and regression controls have their own limits. They remove only the linear influence of the variables you name, they assume the control variable is measured without error, and they can introduce bias if you control for the wrong thing. A partial correlation near zero is evidence that the named variable explains the association. It is not proof that no causal relationship exists.
Frequently Asked Questions
What is a lurking variable in simple terms?
It is a hidden third factor that was not recorded in a study but still influences the two variables you are comparing. It can create a correlation that looks real or hide one that is. The ice cream and drowning example is the standard illustration.
Is a lurking variable the same as a confounding variable?
Not exactly. A confounding variable affects the response and is related to the explanatory variable, and its effect cannot be separated from the explanatory variable's effect [2]. A lurking variable is a potential confounder that was never measured, so you cannot adjust for it directly [2].
How do I find a lurking variable?
You usually cannot find it in the data, because it is not there. You find it by asking what else could plausibly drive both variables, then going back and measuring it. Once measured, it becomes a covariate you can control for with a partial correlation or a regression model.
Can a lurking variable make a correlation weaker?
Yes. This is called suppression. If the lurking variable pushes one of your variables up and the other down, it can cancel out a genuine relationship and make the raw correlation look near zero. Comparing raw and partial correlations is how you catch it.
Does a partial correlation prove causation?
No. A partial correlation only tells you whether an association survives after removing the linear effect of the variables you named. Other unmeasured variables, measurement error, and reverse causation can all remain. Only a well-designed experiment gives strong grounds for a causal claim [3].
References
- Causation and Lurking Variables (2 of 2) - Concepts in Statistics
- 6.3: Relationships between variables by groups - Statistics LibreTexts/06%3A_Correlation_and_Simple_Linear_Regression/6.03%3A_Relationships_between_variables_by_groups)
- Causation and Lurking Variables (1 of 2) - Concepts in Statistics
Further Reading
- 3.25: Causation and Lurking Variables (1 of 2) - Statistics LibreTexts)
- NIST/SEMATECH e-Handbook of Statistical Methods
- OpenStax. Introductory Statistics 2e