How to Verify a Peptide Calculator's Accuracy: A Guide
By Dr. Zubair Khalid, DVM, MS, PhD ·

By the end of this guide you will be able to verify peptide calculator accuracy for the numbers that drive bench decisions: molecular weight, charge states, m/z values, net charge, isoelectric point, and ultraviolet extinction coefficient. You will also be able to judge a machine learning based bioinformatics calculator, the kind that predicts bioactivity rather than a physical constant, using the same validation logic published predictors are held to.
Have four things on hand before you start: the calculator you want to test with its documentation open, a spreadsheet application or a Python 3 interpreter, the residue mass and pKa tables printed in this guide, and one well-characterized test peptide. The walkthrough uses angiotensin II (sequence DRVYIHPF), an eight-residue peptide widely used as a reference in mass spectrometry, because it exercises acidic, basic, and aromatic residues as well as both termini.
What a Peptide Calculator Does, and What Accuracy Means
A peptide calculator is a specialized biology calculator. You give it a sequence, it returns numbers you act on: how much powder to weigh, what m/z to look for, what pH to dissolve at, how concentrated a stock is. Two families dominate.
Deterministic calculators apply fixed formulas. Molecular weight, net charge, isoelectric point (pI, the pH at which net charge equals zero), molar extinction coefficient at 280 nm (ε280, a measure of how strongly a peptide absorbs ultraviolet light), and hydropathy averages all belong here. The same input must always produce the same output, and you can reproduce that output by hand.
Machine learning based calculators, better described as bioinformatics calculators, classify or score sequences. Antioxidant potential, cell penetration, immunomodulatory activity, and cleavage sites are typical targets. Their output is a probability or score, not a physical constant, and no hand calculation reproduces it.
This distinction decides your verification strategy. Deterministic tools are verified by reproduction. Predictive tools are verified by auditing their validation evidence and by blind testing.
Accuracy Claims, Reference Standards, and Tolerances
Verification starts with three definitions.
The claim. "Accurate" is meaningless until it names a property and a setting. A calculator can be exact for monoisotopic mass and rough for pI, because the two rest on different kinds of data.
The reference standard. This is the independent answer you compare against, one that does not depend on the tool under test. The design principle shows up clearly outside chemistry. A large validation study of a clinical text mining pipeline scored its model against an independent physician-adjudicated reference standard and reported 98.4 percent accuracy for structural chunk triage but 88.2 percent for the harder task of medication status adjudication [1]. Accuracy moved by ten points between two subtasks of one pipeline. The lesson for calculator testing is direct: every property needs its own reference, and the reference must not be the tool grading itself.
The tolerance. Decide the acceptable difference before comparing. For mass, high-resolution mass spectrometers measure peptides within a few parts per million, so a mass calculator should agree with a careful hand calculation to the third or fourth decimal place for a peptide near 1000 Da (daltons, the standard unit of molecular mass). For pI, agreement within a few tenths of a pH unit is often the best any two defensible pKa sets deliver. Tolerances follow the intended use, not a universal rule.
Verify Peptide Calculator Accuracy Step by Step
The walkthrough verifies a deterministic calculator property by property, then handles the predictive case. Every step works in a spreadsheet. Python is shown because it makes batch and edge case testing automatic.
Step 1: Pin Down the Documented Parameters
Open the documentation and write down the settings that change answers.
| Setting | Typical options | Effect on the result |
|---|---|---|
| Mass basis | Monoisotopic vs average | Monoisotopic values are lower, the gap grows with peptide length (about 0.66 Da for an eight-residue peptide) |
| Termini | Free, acetylated (+42.01057 Da), amidated (-0.98402 Da) | Changes mass and charge |
| Disulfide bonds | Reduced vs one or more bonds | Each bond subtracts 2.01565 Da |
| Charge state | [M+H]+, [M+2H]2+, [M+3H]3+ | m/z = (M + z × 1.00728) / z |
| pKa set | Multiple public sets exist | Net charge shifts by hundredths, pI by tenths of a pH unit |
| Cysteine state | Reduced vs cystine | Changes ε280 by 125 per cystine |
If the documentation does not state a setting, that is itself a verification finding. Record it and move on.
Step 2: Hand-Calculate the Molecular Weight
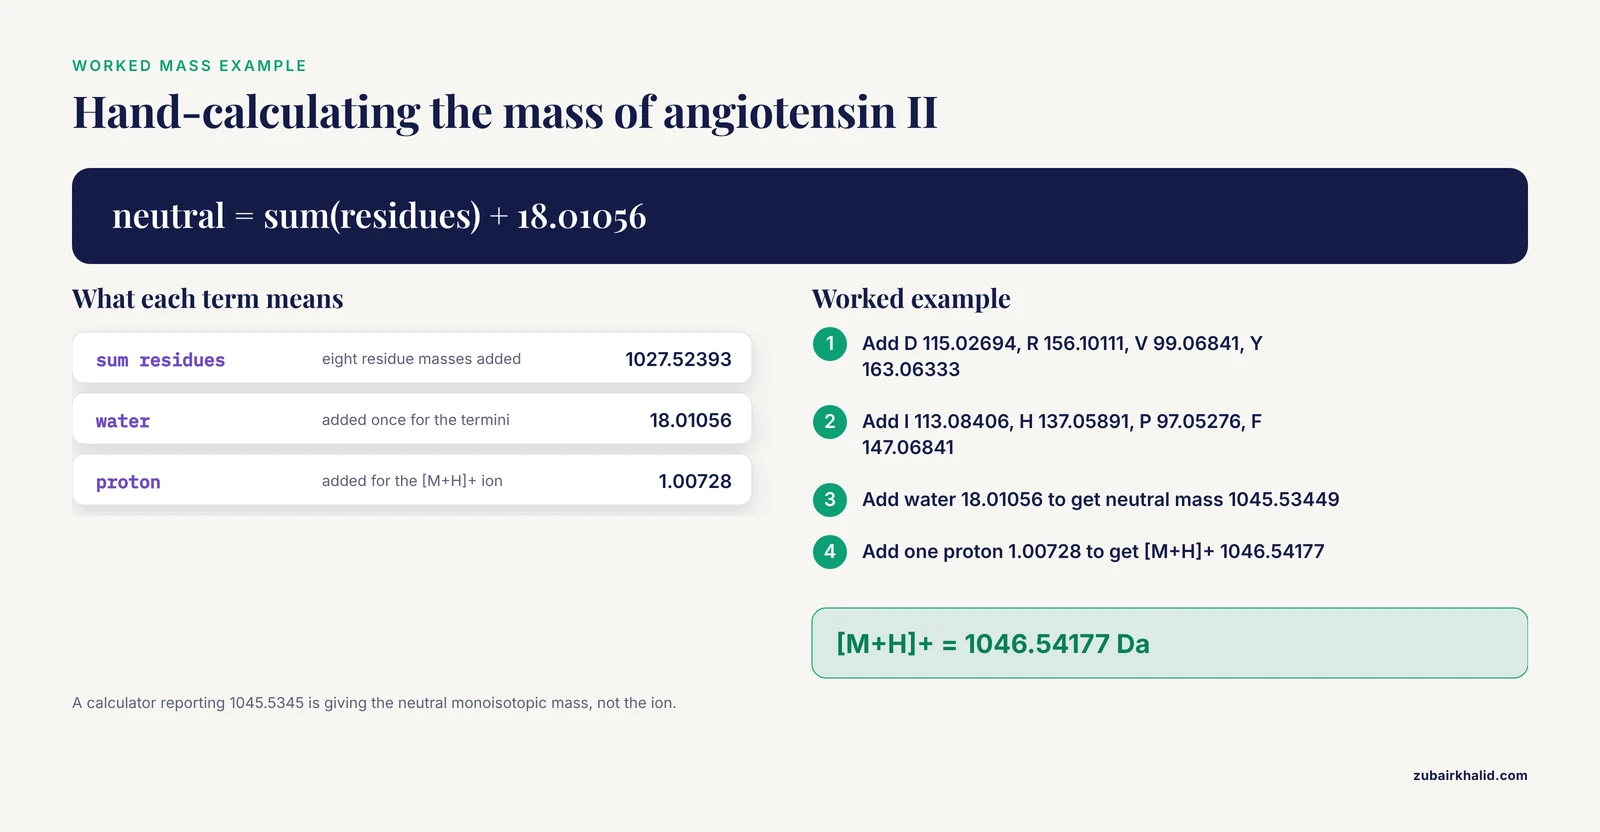
Peptide mass is arithmetic. A residue is an amino acid as it sits inside a chain, which is the free amino acid minus one water molecule. The neutral peptide mass is the sum of residue masses plus one water for the termini. The table lists standard monoisotopic residue masses used across proteomics software.
| Residue | Mass (Da) | Residue | Mass (Da) |
|---|---|---|---|
| G | 57.02146 | N | 114.04293 |
| A | 71.03711 | D | 115.02694 |
| S | 87.03203 | Q | 128.05858 |
| P | 97.05276 | K | 128.09496 |
| V | 99.06841 | E | 129.04259 |
| T | 101.04768 | M | 131.04049 |
| C | 103.00919 | H | 137.05891 |
| L | 113.08406 | F | 147.06841 |
| I | 113.08406 | R | 156.10111 |
| Y | 163.06333 | W | 186.07931 |
| Water | 18.01056 | Proton | 1.00728 |
Worked arithmetic for angiotensin II:
D 115.02694
R 156.10111
V  99.06841
Y 163.06333
I 113.08406
H 137.05891
P  97.05276
F 147.06841
sum of residues = 1027.52393
plus water 18.01056 gives neutral monoisotopic mass = 1045.53449
plus one proton 1.00728 gives [M+H]+ = 1046.54177
The same calculation as a reusable script:
MONOISOTOPIC = {
    "A": 71.03711, "C": 103.00919, "D": 115.02694, "E": 129.04259,
    "F": 147.06841, "G": 57.02146, "H": 137.05891, "I": 113.08406,
    "K": 128.09496, "L": 113.08406, "M": 131.04049, "N": 114.04293,
    "P": 97.05276, "Q": 128.05858, "R": 156.10111, "S": 87.03203,
    "T": 101.04768, "V": 99.06841, "W": 186.07931, "Y": 163.06333,
}
WATER = 18.01056
PROTON = 1.00728

def peptide_mass(seq, charge=1):
    seq = seq.upper().replace(" ", "")
    unknown = sorted(set(seq) - set(MONOISOTOPIC))
    if unknown:
        raise KeyError(f"Unknown residue(s): {unknown}")
    neutral = sum(MONOISOTOPIC[aa] for aa in seq) + WATER
    return neutral + charge * PROTON

print(round(peptide_mass("DRVYIHPF"), 5))
Expected output:
1046.54177Enter DRVYIHPF into the calculator under test and read the report against your hand calculation. A value near 1045.5345 is the monoisotopic neutral mass, near 1046.5418 the monoisotopic [M+H]+ ion, near 1046.19 the average neutral mass, and near 1047.20 the average protonated ion. All four are correct answers to different questions, which is why Step 1 exists.
Step 3: Check Charge States and m/z Values
Mass spectrometers separate ions by m/z, the mass-to-charge ratio. For a peptide of neutral mass M carrying z protons, m/z = (M + z × 1.00728) / z.
z = 1:  (1045.53449 + 1 × 1.00728) / 1 = 1046.54177
z = 2:  (1045.53449 + 2 × 1.00728) / 2 = 523.77453
z = 3:  (1045.53449 + 3 × 1.00728) / 3 = 349.51878
Electrospray spectra of peptides usually contain doubly and triply protonated ions, and the 2+ ion is often the strongest signal. A calculator that reports only the singly protonated mass is incomplete for liquid chromatography mass spectrometry work. Verify that it computes m/z at stated charge states or clearly documents its default.
Step 4: Verify Net Charge and Isoelectric Point
Net charge at a given pH comes from partial charges on ionizable groups. pKa is the pH at which a group is half protonated. For a basic group (N-terminus, Lys, Arg, His), the fraction protonated is 1 / (1 + 10^(pH - pKa)). For an acidic group (C-terminus, Asp, Glu, Tyr, Cys), the fraction deprotonated is 1 / (1 + 10^(pKa - pH)). Sum the positive and negative contributions.
Two widely used public pKa sets show why calculators disagree:
| Group | Set A | Set B |
|---|---|---|
| N-terminus | 8.0 | 9.69 |
| C-terminus | 3.1 | 2.34 |
| Asp | 3.9 | 3.65 |
| Glu | 4.1 | 4.25 |
| His | 6.0 | 6.00 |
| Cys | 8.3 | 8.18 |
| Tyr | 10.1 | 10.07 |
| Lys | 10.5 | 10.53 |
| Arg | 12.5 | 12.48 |
PKA = {"Nterm": 8.0, "Cterm": 3.1, "D": 3.9, "E": 4.1,
       "C": 8.3, "Y": 10.1, "H": 6.0, "K": 10.5, "R": 12.5}

def net_charge(seq, pH):
    seq = seq.upper()
    pos = 1 / (1 + 10 ** (pH - PKA["Nterm"]))
    for aa in ("K", "R", "H"):
        pos += seq.count(aa) / (1 + 10 ** (pH - PKA[aa]))
    neg = 1 / (1 + 10 ** (PKA["Cterm"] - pH))
    for aa in ("D", "E", "C", "Y"):
        neg += seq.count(aa) / (1 + 10 ** (PKA[aa] - pH))
    return pos - neg

def isoelectric_point(seq):
    lo, hi = 0.0, 14.0
    for _ in range(100):
        mid = (lo + hi) / 2
        if net_charge(seq, mid) > 0:
            lo = mid
        else:
            hi = mid
    return (lo + hi) / 2

print(round(net_charge("DRVYIHPF", 7.0), 3))
print(round(isoelectric_point("DRVYIHPF"), 2))
Expected output with Set A:
0.0
7.0
Angiotensin II is essentially neutral at pH 7 with Set A, and its pI sits at 7.0. Change five entries to Set B (Nterm 9.69, Cterm 2.34, D 3.65, Y 10.07, R 12.48) and the same functions return about +0.088 at pH 7 and a pI near 7.8. Neither result is wrong. Each answers the question for its pKa set. When you verify charge and pI, you are verifying that the calculator faithfully applies the pKa set it documents, not that it matches some universal truth.
Step 5: Verify the Extinction Coefficient
Aromatic residues absorb at 280 nm. The standard estimate is
ε280 = 5500 × (number of Trp) + 1490 × (number of Tyr) + 125 × (number of cystines)
in units of M⁻¹ cm⁻¹, where a cystine is a disulfide-bonded pair of cysteines. Angiotensin II contains one tyrosine and no tryptophan:
def extinction_280(seq, cystines=0):
    seq = seq.upper()
    return 5500 * seq.count("W") + 1490 * seq.count("Y") + 125 * cystines

print(extinction_280("DRVYIHPF"))
Expected output:
1490Concentration then follows from the Beer-Lambert relation, c = A280 / (ε280 × l), with path length l in centimeters. A frequent calculator defect is counting every C residue as a cystine, which inflates ε280 for reduced peptides. Test the cystine logic explicitly with a two-cysteine peptide in both reduced and oxidized states.
Step 6: Probe Edge Cases and Boundary Conditions
Edge cases reveal defects that normal inputs hide. Run each input and compare behavior with what a correct implementation must do.
- Empty sequence. Correct behavior is returning the water mass 18.01056 or raising a clear error. Returning 0 is a bug.
- Single glycine, G. Correct monoisotopic [M+H]+ is 57.02146 + 18.01056 + 1.00728 = 76.03930.
- Lowercase input, drvyihpf. Must match the uppercase result or be rejected explicitly. A silent skip that returns the mass of a shorter peptide is the dangerous failure.
- Ambiguous codes B (Asx), Z (Glx), X (any residue), and the nonstandard U (selenocysteine) and O (pyrrolysine). Correct behavior is an explicit error or documented expansion.
- Oxidized CGC. The reduced mass is 103.00919 + 57.02146 + 103.00919 + 18.01056 = 281.05040. With one disulfide, subtract 2.01565 to get 279.03475.
- Charge 0 requested for m/z. Must raise an error, never divide by zero.
- A 100-residue sequence, and a sequence pasted with spaces or a trailing newline. Trimming and length limits should be documented.
Keep these inputs in a file so the whole battery reruns in seconds after any tool update.
Step 7: Cross-Check Against Mass Spectrometry Data
Hand arithmetic and edge cases confirm internal consistency. Instrument data confirm correspondence with reality, and mass spectrometry is the strongest external reference for peptide identity and mass.
The bar used in peptidomics research (the systematic identification of endogenous peptides in a biological sample) shows how demanding a proper reference is. In a study of endogenous free peptides from Ophiocordyceps sinensis, a sequence was designated high confidence only when every amino acid residue corresponded to a unique fragment ion signal in the tandem mass spectrometry (MS/MS) spectrum, with identification scored by the Andromeda engine of the MaxQuant platform. The researchers then synthesized the high-confidence peptides by solid-phase synthesis and re-verified them by comparing MS/MS fragmentation spectra acquired under identical conditions [2].
Borrow that logic at laboratory scale. If you have a synthetic standard and instrument access, check that the observed precursor m/z matches your calculated value and that the observed fragment ion series matches the sequence, residue by residue. A calculated mass that also predicts the right fragment ladder is verified far more strongly than one that matches a precursor alone.
Step 8: Evaluate Machine Learning Predictors on Their Own Terms
A machine learning bioinformatics calculator cannot be verified by arithmetic, so you audit its validation evidence and then blind test it.
Read for four disclosures. First, benchmark metrics on held-out data, such as AUC-ROC (area under the receiver operating characteristic curve, the probability that the model ranks a randomly chosen true positive above a randomly chosen true negative), Matthews correlation coefficient, sensitivity, and specificity. Second, calibration, meaning predicted scores that track how often outcomes actually occur. Third, experimental validation of the tool's outputs. Fourth, a clear statement of what the tool does not cover.
A recent antioxidant peptide framework illustrates the full chain. Its predictor, RLP-T5Pred, is built on ProtT5, a transformer based protein language model adapted to peptides through a protein-to-peptide knowledge transfer strategy, and it reports AUC-ROC 0.9692 on its benchmark, with label smoothing and a logit penalty (regularization methods that discourage overconfident scores) used to keep predictions calibrated. Its generator, RLP-T5Gen, was then used to design new antioxidant peptides, and the team synthesized 17 of them. Most showed radical scavenging activity in DPPH and ABTS chemical assays (standard spectrophotometric free radical tests), and the top five candidates advanced to cellular validation [3].
That chain is the standard to demand. A tool that reports only a benchmark number, with no calibration evidence and no wet-lab check, has published evidence for ranking quality and nothing more.
Then run your own blind set. Collect 10 to 20 sequences with outcomes you know from your own system, score them without looking at the labels, and compute agreement. The set is small, but it catches tools whose benchmark performance does not transfer to your sequences.
How to Confirm the Verification Itself Is Sound
A verification can fail in its own ways. Three checks keep it honest.
Independence. A second calculator agrees with the first only if the two do not share code, mass tables, or pKa sets. Diff the documented settings before trusting any agreement. Two tools built on the same pKa table will match for the wrong reason.
Round trip. Feed the calculator's outputs back through independent formulas. A reported [M+H]+ should convert back to the neutral mass when you subtract 1.00728, and a reported pI should give a net charge near zero when you evaluate the charge function at that pH.
Loop closure. The peptidomics study cited above closed its loop the same way, synthesizing candidates and re-acquiring spectra under identical conditions rather than trusting the first analysis [2].
Finally, log it. Keep a verification log with columns for date, tool name and version, parameter set, test input, expected value, reported value, difference, pass or fail, and notes. Re-run the log after every tool update. A verification that is not recorded cannot be repeated.
Common Errors and Their Exact Fixes
Crashes are friendly failures because they stop you. Silent errors are the ones that reach a notebook.
| Symptom | Likely cause | Fix |
|---|---|---|
| KeyError: 'X' | Ambiguous code B, Z, X, or nonstandard U, O reached the mass table | Expand to documented alternatives or reject with a clear message |
| ValueError: could not convert string to float: 'DRVYIHPF' | Sequence passed into a numeric parser, columns swapped during CSV import | Check column order, parse the sequence column as text |
| ZeroDivisionError: float division by zero | m/z computed with charge 0 | Validate that charge is at least 1 before dividing |
| TypeError: can only concatenate str (not "int") to str | Spreadsheet column mixes text and numbers | Coerce with str() and strip whitespace before processing |
| AttributeError: 'float' object has no attribute 'count' | Empty or numeric cells in the sequence column | Filter or fill empty cells before counting residues |
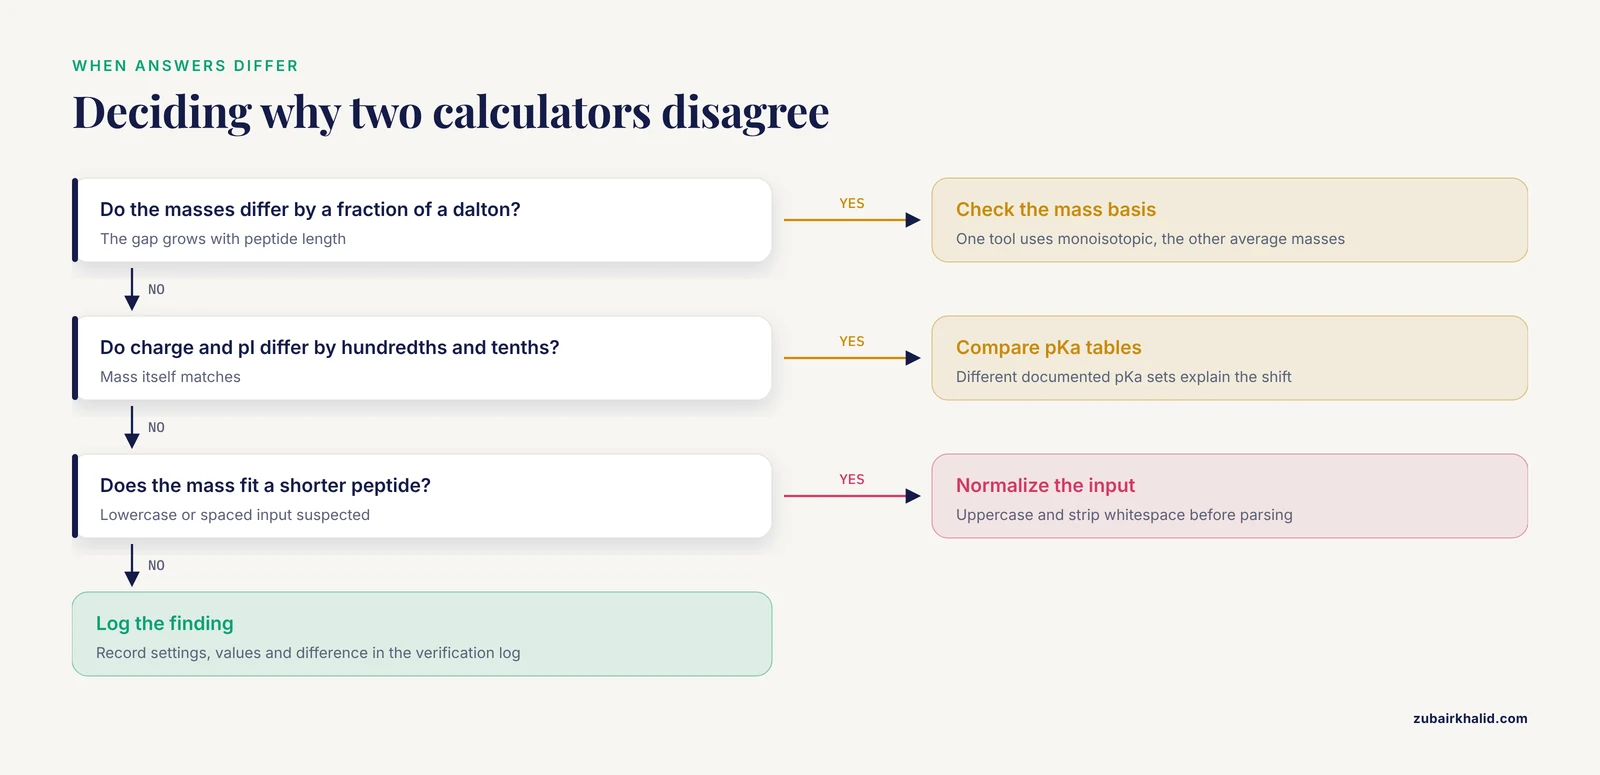
| No error, masses differ by a fraction of a dalton that grows with length | Monoisotopic and average settings switched between tools | Confirm the mass basis and recompute |
| No error, charge differs by hundredths and pI by tenths | Different pKa sets | Compare the documented pKa tables, not just the answers |
| No error, mass corresponds to a shorter peptide | Lowercase residues skipped by a parser | Normalize case before parsing |
Spreadsheet software can also reformat or truncate pasted text, so paste sequences into a plain text editor first and paste as values afterward.
Common Mistakes and Limitations
- Circular verification. Testing a tool against another tool built on the same tables or code confirms consistency, not correctness.
- Reading benchmark metrics as per-peptide promises. AUC-ROC describes ranking across a whole dataset. Even a framework with strong benchmark numbers and wet-lab validation, like the antioxidant predictor discussed above, does not guarantee that any particular designed sequence will be active [3].
- Verifying one property and inferring the rest. The clinical text mining pipeline discussed earlier was highly accurate for one subtask and clearly less accurate for a harder subtask [1]. Property by property is the only safe granularity.
- Ignoring salt form and peptide content. Calculators describe the bare peptide. Commercial preparations are frequently salts, for example trifluoroacetate salts, and carry counterions and variable water, so a weighed mass never maps one to one onto a calculated mass.
- Testing only friendly inputs. Calculators fail at boundaries, empty strings, unknown residues, charge zero, not at the sequences you normally type.
- Forgetting that measurements carry error too. When calculated and observed masses disagree, the sample, the instrument state, and the calculation are all suspects until each is checked.
- Treating verification as characterization. A verified calculator confirms arithmetic and documented behavior. It does not replace analytical characterization of an actual preparation, and unusual cases such as modified residues, isotope labels, or exotic termini deserve review by an experienced analyst before results are trusted.
Verification Tips That Save Time
- Build a permanent test suite of 10 to 20 peptides once, covering mass, charge, edge cases, and one disulfide. Re-run it after every update.
- Record parameter values in the log, not just the tool name. Settings, not software, cause most disagreements.
- Prefer calculators that print their pKa table and mass basis on the results page. Transparency is itself a quality signal.
- When two calculators disagree, diff their settings before doubting either answer.
- Automate the comparison in a short script. A rerunnable battery beats an afternoon of copy and paste.
Frequently Asked Questions
What does it mean to verify a peptide calculator's accuracy?
It means reproducing the calculator's documented outputs independently and confirming they match hand calculations, reference constants, or instrument measurements within a tolerance you set in advance. Verification is done property by property, because accuracy for one output does not transfer to another.
Which test peptide should I start with?
Start with a short, well-characterized reference peptide such as angiotensin II (DRVYIHPF). It contains acidic, basic, and aromatic residues plus both termini, so a single sequence exercises mass, charge, and extinction coefficient calculations at once.
Why do two calculators report different molecular weights for the same peptide?
Usually because one uses monoisotopic masses and the other average masses, or because termini and modification settings differ. Check the mass basis and terminus settings before assuming either number is wrong.
How do I evaluate a machine learning bioinformatics calculator?
Audit its validation evidence: benchmark metrics on held-out data, calibration of its scores, and experimental confirmation of its predictions. Then score a small blind set of sequences from your own domain and measure agreement.
Can mass spectrometry data verify my calculations?
Yes, and it is the strongest external check available. Observed precursor m/z values and residue-by-residue fragment ion series confirm both the mass and the sequence behind the mass.
What tolerance should I allow between calculated and measured mass?
Let the instrument decide. High-resolution mass spectrometry operates within a few parts per million, which is a few thousandths of a dalton for a peptide near 1000 Da, while low-resolution instruments work at the dalton level.
Do I need to write code to verify a calculator?
No. A spreadsheet with the residue mass and pKa tables reproduces every standard check in this guide. Code pays off when you want batch testing, edge case batteries, or automatic comparison across tool updates.
How often should verification be repeated?
Repeat it after every version or parameter change, and before results feed a new experiment, dataset, or manuscript. A logged verification you can rerun in minutes costs almost nothing.
Sources
- Auditable large language model curation of clinical notes refines glucagon-like peptide-1 initiation, persistence ascertainment, and compounding use beyond prescription records.
- Peptidomics-based identification of endogenous free peptides from Ophiocordyceps sinensis and functional validation of immunomodulatory peptide WALGT.
- RLAnOxPeptide: an integrated framework combining transformer and reinforcement learning for efficient antioxidant peptide prediction and innovative design.