Shannon Diversity Index: Formula and Calculation Examples
By Dr. Zubair Khalid, DVM, MS, PhD ·
The Shannon diversity index is a single number that summarizes how diverse a community is. It combines two things: how many types are present (richness) and how evenly individuals are spread across those types (evenness). A higher value means more uncertainty about which species you would pick at random, which corresponds to greater diversity [1][2].
Quick Answer
- The formula is $H' = -\sum_{i=1}^{R} p_i \ln(p_i)$, where $p_i$ is the proportion of individuals belonging to type $i$ and $R$ is the number of types [1].
- $H'$ is 0 when every individual belongs to one type, and it increases as richness and evenness increase [2].
- The maximum value for a given richness is $\ln(R)$, reached when all types have equal proportions [2].
- Evenness is $H' / \ln(R)$, which rescales the index to a 0 to 1 range [2].
- The index is also called Shannon's diversity index, the Shannon-Wiener index, and Shannon entropy [1][2].
The Formula
The Shannon index is most often written as:
$$H' = -\sum_{i=1}^{R} p_i \ln(p_i)$$
Each symbol has a specific meaning:
| Symbol | Meaning |
|---|---|
| $H'$ | The Shannon diversity index value |
| $R$ | The number of types, also called species richness |
| $p_i$ | The proportion of individuals in type $i$, calculated as count divided by total |
| $\ln$ | The natural logarithm, base $e$ |
| $\sum$ | Sum over all types from 1 to $R$ |
The measure was originally proposed by Claude Shannon in 1948 to quantify entropy in strings of text [1]. The idea is that the more types there are, and the closer their proportional abundances, the harder it is to predict which type comes next [1]. In ecology this became a standard diversity index, and it is closely related to Shannon entropy in information theory.
Because $p_i$ is always between 0 and 1, $\ln(p_i)$ is always negative or zero, so each term $p_i \ln(p_i)$ is negative or zero. The leading minus sign flips the sum to a positive value.
How to Calculate It Step by Step
- Count the individuals in each type. Build a frequency table with one row per species or category.
- Find the total $N$. Add all counts together.
- Compute each proportion $p_i$. Divide each count by $N$.
- Take the natural log of each proportion. Use $\ln$, not log base 10.
- Multiply each proportion by its log. Compute $p_i \ln(p_i)$ for every type.
- Sum those products. Add all the $p_i \ln(p_i)$ values together.
- Flip the sign. Multiply the sum by $-1$ to get $H'$.
- Optional: compute evenness. Divide $H'$ by $\ln(R)$ to get a value between 0 and 1.
If you want to compare this with a measure that weights abundant types more heavily, see the Simpson diversity index formula.
Worked Example
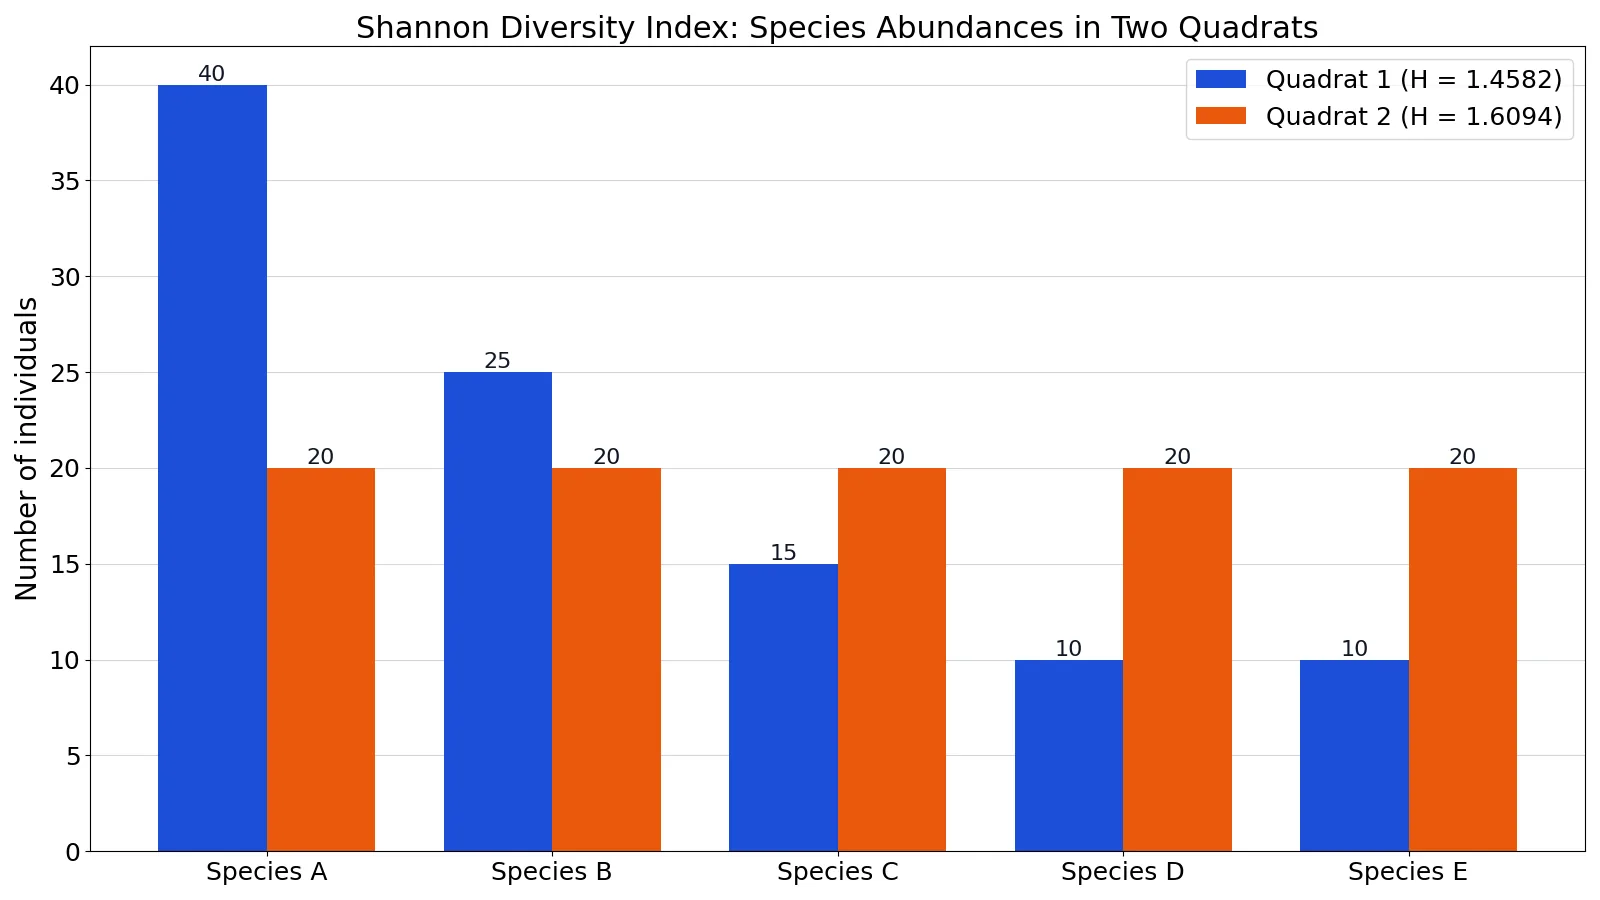
The dataset below records species counts in two quadrats, each containing 5 species.
| Species | Quadrat 1 | Quadrat 2 |
|---|---|---|
| Species A | 40 | 20 |
| Species B | 25 | 20 |
| Species C | 15 | 20 |
| Species D | 10 | 20 |
| Species E | 10 | 20 |
Quadrat 1
Total individuals: $N = 100$.
Proportions: Species A = 40/100 = 0.4000, Species B = 25/100 = 0.2500, Species C = 15/100 = 0.1500, Species D = 10/100 = 0.1000, Species E = 10/100 = 0.1000.
Now multiply each proportion by its natural log:
| Species | $p_i$ | $p_i \ln(p_i)$ |
|---|---|---|
| A | 0.4000 | -0.3665 |
| B | 0.2500 | -0.3466 |
| C | 0.1500 | -0.2846 |
| D | 0.1000 | -0.2303 |
| E | 0.1000 | -0.2303 |
Sum: $-0.3665 + -0.3466 + -0.2846 + -0.2303 + -0.2303 = -1.4582$.
Flip the sign: $H' = 1.4582$.
Quadrat 2
Total individuals: $N = 100$. Every species has 20 individuals, so every proportion is 20/100 = 0.2000.
Each term is $0.2000 \times \ln(0.2000) = -0.3219$. There are five identical terms.
Sum: $-0.3219 \times 5 = -1.6094$. Flip the sign: $H' = 1.6094$.
Both quadrats have the same richness of 5 species, but quadrat 2 is perfectly even, so it scores higher. Evenness for quadrat 1 is 0.906 and for quadrat 2 it is 1.
Here is the calculation in Python:
import math
counts = [40, 25, 15, 10, 10]
N = sum(counts)
p = [c / N for c in counts]
H = -sum(pi * math.log(pi) for pi in p)
print(H)  # 1.4582
Output:
1.458174899361326How to Interpret the Result
The Shannon index is a measure of uncertainty [2]. If a community has very low diversity, you can be fairly confident about the identity of an organism chosen at random. If a community is highly diverse, you have greater uncertainty about which species you will pick [2].
The value of $H'$ ranges from 0 to a maximum that depends on richness [2]. A value near 0 means nearly every individual belongs to the same type [3]. The maximum for a community with $R$ types is $\ln(R)$, which occurs when all types are equally abundant [2].
Because the maximum depends on richness, raw $H'$ values are not directly comparable between communities with different numbers of species. Dividing by $\ln(R)$ gives Pielou's evenness index, which runs from just above 0 to 1 [2][3]. An evenness of 1 means all types have equal abundance [3].
In the worked example, quadrat 1 has $H' = 1.4582$ and quadrat 2 has $H' = 1.6094$. Since both have 5 species, the comparison is fair, and quadrat 2 is more diverse because its individuals are spread evenly.
Doing It in Software
Python. Use the math module for the logarithms, as shown above. If you already have a table of counts, the loop is a few lines. For data frames, pandas has a value_counts() method you can chain with apply to get proportions.
R. The vegan package provides the diversity() function, which computes the Shannon index by default when you pass an abundance vector. Base R also works: -sum(p * log(p)) where p is your vector of proportions.
Excel. Enter counts in one column. In the next column, divide each count by the total to get $p_i$. In a third column, use =B2*LN(B2) for each row. Sum that column with =SUM(C2:C6) and multiply by -1. The LN function returns the natural logarithm, which is what the formula requires.
If you are comparing variability across several such measurements, the ideas in measures of variability apply to the spread of index values.
Common Mistakes
- Using log base 10 instead of natural log. The standard formula uses $\ln$, the natural logarithm. Log base 10 gives a different number and breaks comparability with published values.
- Forgetting the minus sign. Each $p_i \ln(p_i)$ term is negative, so the raw sum is negative. You must flip the sign to get a positive $H'$.
- Treating $H'$ as comparable across different richness. A community with more species can reach a higher maximum. Compare evenness, or compare only communities with similar richness.
- Including zero counts as types. A type with $p_i = 0$ contributes nothing, and $\ln(0)$ is undefined. Drop empty categories before calculating.
- Confusing richness with diversity. Richness is just a count of types [1]. Two communities can have identical richness and very different diversity, as the worked example shows.
- Ignoring sample size effects. The original Shannon formula is negatively biased at small sample sizes, and the deviation from the true value shrinks as samples grow [4].
Limitations
The Shannon index summarizes a community in one number, so it discards information. Two communities with the same $H'$ can have very different abundance structures. The index also weights rare species more heavily than some alternatives, which makes it sensitive to sampling effort: if you sample more individuals, you tend to find more rare types and the value shifts.
The original formula is biased downward when sample sizes are small, and this bias is larger for populations with low heterozygosity [4]. Unbiased estimators exist, and studies have compared the original formula against estimators such as those of Zahl, Chao and Shen, and Chao et al. [4]. For small samples, consider one of these corrected estimators. The index also says nothing about which species are present or their ecological roles, only about the distribution of abundances.
Frequently Asked Questions
What is a good Shannon diversity index value?
There is no universal threshold. The value depends on the number of types in your system, since the maximum is $\ln(R)$. A common approach is to report evenness alongside $H'$ so readers can see how close the community is to its own maximum. Values near 0 indicate dominance by one type, and values near $\ln(R)$ indicate an even community.
What is the difference between the Shannon index and the Simpson index?
Both combine richness and evenness, but they use different means. The Shannon index uses a weighted geometric mean of the proportional abundances, while the Simpson index uses a weighted arithmetic mean [1]. The Simpson index is more sensitive to the most abundant species, and the Shannon index gives more weight to rare species.
Can the Shannon index be greater than 1?
Yes. The maximum is $\ln(R)$, so with 5 species the maximum is about 1.609, and with 20 species it is about 3.0. Values above 1 are common in species-rich communities. Only evenness is bounded between 0 and 1.
Why is the Shannon index sometimes called the Shannon-Wiener index?
The index is known by several names in the ecological literature, including Shannon's diversity index, the Shannon-Wiener index, and the Shannon-Weaver index [1][2]. The last form is considered erroneous [1]. All of these names refer to the same calculation.
Does the Shannon index require count data?
You can use any non-negative measure of abundance, including counts, biomass, or cover. What matters is that the values are on a consistent scale across types, because the formula converts them to proportions. If your abundances are estimates rather than exact counts, the index still works, but interpret small differences with caution.
For a related way to measure how similar two samples are when you care about direction instead of magnitude, see cosine similarity and distance.
References
- Diversity index - Wikipedia
- 22.2: Diversity Indices - Biology LibreTexts
- Shannon Diversity: Richness and Evenness
- Konopiński MK. (2020). Shannon diversity index: a call to replace the original Shannon's formula with unbiased estimator in the population genetics studies. PeerJ
Further Reading
Related Articles
- Simpson Diversity Index: Formula, Calculation and Examples
- Measures of Variability: Range, Variance and Standard Deviation
- What Is Shannon Entropy? Definition, Formula and Examples
- Multicollinearity: Definition, Detection and Examples
- Standard Deviation of a Binomial Distribution: Formula and Example
- Statistical Range: Definition, Calculation, and Applications
- Statistical Parameter: Definition, Types, and Estimation
- Statistical Symbols and Notation: A Quick Reference