Ranking Correlation Coefficient: Spearman and Kendall
By Dr. Zubair Khalid, DVM, MS, PhD ·
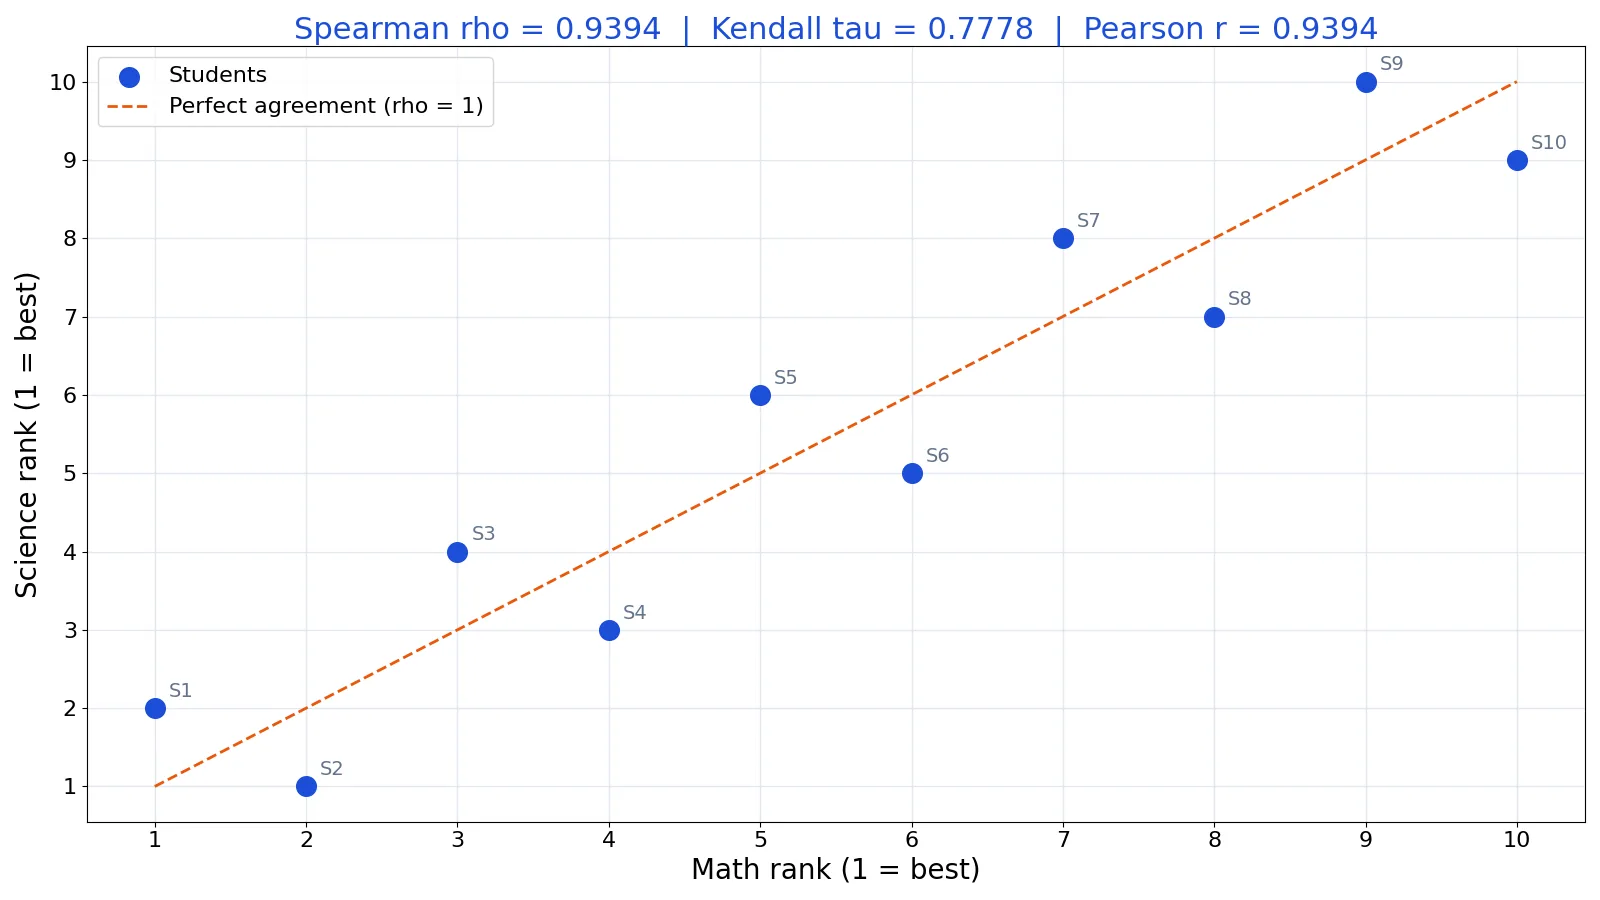
A ranking correlation coefficient measures how strongly two variables move together when you compare their ranks instead of their raw values. The two best-known versions are Spearman's rho and Kendall's tau. Both range from -1 to +1, both detect monotonic relationships, and both work on ordinal data where a Pearson correlation would be misleading.
Quick Answer
- A ranking correlation coefficient quantifies the monotonic association between two variables using rank order numbers instead of the original measurements [1].
- Spearman's rho applies the Pearson formula to ranks. It equals $1 - 6\sum d_i^2 / (n(n^2-1))$ when there are no tied ranks.
- Kendall's tau counts concordant and discordant pairs and equals $(C - D)/(C + D)$.
- Both coefficients run from -1 (perfect reversal) through 0 (no monotonic association) to +1 (perfect agreement) [2].
- Spearman is the more common choice, but Kendall's tau is often preferred for small samples and is more directly interpretable as a probability.
What Ranking Correlation Coefficient Means
A ranking correlation coefficient is a number that tells you whether two variables tend to increase and decrease together when you sort each one from smallest to largest. Instead of asking "do the values line up on a straight line," it asks "do the positions line up."
The plain definition: replace every value with its rank, then measure how similar the two rank sequences are.
The precise statistical definition: the Spearman rank-order correlation coefficient is a nonparametric measure of the monotonicity of the relationship between two datasets [2]. It varies between -1 and +1, with 0 implying no correlation. Correlations of -1 or +1 imply an exact monotonic relationship. Positive correlations mean that as x increases, y also increases. Negative correlations mean that as x increases, y decreases [2].
Kendall's tau is defined differently. It is built from pairwise comparisons. For every pair of observations, you check whether the two variables agree on the ordering. The proportion of agreeing pairs minus the proportion of disagreeing pairs, scaled to the -1 to +1 range, gives tau.
Because both coefficients use ranks, they are distribution-free tests. The rank correlation test determines whether there is a monotonic relation between two variables, and a monotonic relation exists when any increase in one variable is invariably associated with either an increase or a decrease in the other [1].
How It Works
Spearman's rho
Rank all x values from 1 to n. Rank all y values from 1 to n. Then compute:
$$\rho = 1 - \frac{6\sum_{i=1}^{n} d_i^2}{n(n^2-1)}$$
- $\rho$ (rho) is the Spearman rank correlation coefficient.
- $d_i$ is the difference between the x rank and the y rank for observation i.
- $n$ is the number of paired observations.
- $\sum d_i^2$ is the sum of all squared rank differences.
This shortcut formula assumes no tied ranks. When ties exist, software applies the Pearson formula directly to the ranks, which handles ties correctly.
Kendall's tau
Kendall's tau compares every possible pair of observations:
$$\tau = \frac{C - D}{C + D}$$
- $C$ is the number of concordant pairs, where both ranks increase together.
- $D$ is the number of discordant pairs, where one rank increases while the other decreases.
- $C + D$ equals the total number of comparable pairs, which is $n(n-1)/2$ when there are no ties.
A pair is concordant if the observation that ranks higher on x also ranks higher on y. It is discordant if the reverse holds.
The p-value
Both coefficients come with a p-value. The p-value roughly indicates the probability of an uncorrelated system producing datasets with a correlation at least as extreme as the one computed from your data [2]. The null hypothesis is that the two samples have no ordinal correlation [3].
Worked Example
Ten students are ranked in math and in science, where 1 is the best rank and 10 is the worst.
| Student | Math rank | Science rank |
|---|---|---|
| S1 | 1 | 2 |
| S2 | 2 | 1 |
| S3 | 3 | 4 |
| S4 | 4 | 3 |
| S5 | 5 | 6 |
| S6 | 6 | 5 |
| S7 | 7 | 8 |
| S8 | 8 | 7 |
| S9 | 9 | 10 |
| S10 | 10 | 9 |
Step 1. Write out the two rank vectors.
math = [1, 2, 3, 4, 5, 6, 7, 8, 9, 10] science = [2, 1, 4, 3, 6, 5, 8, 7, 10, 9]
Step 2. Compute the rank differences.
d = [-1, 1, -1, 1, -1, 1, -1, 1, -1, 1]
Step 3. Square each difference.
d² = [1, 1, 1, 1, 1, 1, 1, 1, 1, 1]
Step 4. Sum the squared differences.
sum(d²) = 10
Step 5. Apply the Spearman formula.
$$\rho = 1 - \frac{6 \times 10}{10(10^2-1)} = 1 - \frac{60}{990} = 0.9394$$
Step 6. Count concordant and discordant pairs for Kendall's tau.
C = 40 concordant pairs D = 5 discordant pairs
Step 7. Apply the Kendall formula.
$$\tau = \frac{40 - 5}{40 + 5} = \frac{35}{45} = 0.7778$$
Step 8. Compare with Pearson on the raw ranks.
Pearson r = 0.9394
Here is the same computation in Python:
import numpy as np
from scipy import stats
math_rank = [1,2,3,4,5,6,7,8,9,10]
sci_rank  = [2,1,4,3,6,5,8,7,10,9]
rho, p = stats.spearmanr(math_rank, sci_rank)
tau, p2 = stats.kendalltau(math_rank, sci_rank)
r, p3 = stats.pearsonr(math_rank, sci_rank)
print(f"Spearman rho = {rho:.4f} (p = {p:.4f})")
print(f"Kendall tau = {tau:.4f} (p = {p2:.4f})")
print(f"Pearson r   = {r:.4f} (p = {p3:.4f})")
Output:
Spearman rho = 0.9394 (p = 0.0001)
Kendall tau = 0.7778 (p = 0.0009)
Pearson r   = 0.9394 (p = 0.0001)
The two rank coefficients tell the same story with different scales. Spearman rho is 0.9394 and Kendall tau is 0.7778. Both p-values are small, so you would reject the null hypothesis of no ordinal correlation. You can reproduce this with the Correlation Coefficient Calculator.
How to Interpret It
The sign tells you the direction. A positive coefficient means that as one variable's rank increases, the other's rank tends to increase. A negative coefficient means the opposite.
The magnitude tells you the strength of the monotonic association. A coefficient of -1 or +1 implies an exact monotonic relationship [2]. A coefficient near 0 implies no monotonic association.
Rough benchmarks for Spearman's rho:
| Absolute value | Interpretation |
|---|---|
| 0.00 to 0.19 | Very weak |
| 0.20 to 0.39 | Weak |
| 0.40 to 0.59 | Moderate |
| 0.60 to 0.79 | Strong |
| 0.80 to 1.00 | Very strong |
Kendall's tau values run lower than Spearman's rho for the same data, as the worked example shows. Do not apply the same cutoffs to both. For tau, values around 0.7 already indicate a strong association.
Always read the p-value alongside the coefficient. A large coefficient from a tiny sample can be noise. The p-value for Spearman is only accurate for very large samples, above roughly 500 observations, when you rely on the standard approximation [2].
When to Use It (and when not to)
Use a ranking correlation coefficient when:
- Your data are ordinal, such as survey ratings, letter grades, or competition placements.
- The relationship is monotonic but not linear.
- You have outliers that would distort a Pearson correlation.
- You want a distribution-free test that makes no assumption about the shape of the underlying distributions [1].
Do not use it when:
- You need to measure the strength of a linear relationship specifically. Use Pearson.
- Your data are nominal categories with no natural order.
- You need to model the relationship, not just describe it. A quadratic regression analysis or another regression form may fit better.
- You have clustered or repeated-measures data and want a single overall number. Standard Spearman treats every observation as independent, and clustered data need adjusted methods [5].
If you are deciding between the two classic coefficients, the guide on Pearson vs. Spearman correlation walks through the trade-offs.
Spearman vs Kendall
Both coefficients measure monotonic association. They differ in how they get there.
| Feature | Spearman's rho | Kendall's tau |
|---|---|---|
| Basis | Pearson formula applied to ranks | Concordant minus discordant pairs |
| Range | -1 to +1 | -1 to +1 |
| Typical value | Higher for the same data | Lower for the same data |
| Small samples | Less reliable | Often preferred |
| Ties | Handled by Pearson-on-ranks formula | Handled with tau-b variants |
| Interpretation | Rank correlation | Probability of agreement |
| Common use | General purpose | Small samples, ordinal agreement |
Kendall's tau has a direct probabilistic reading. If you pick two observations at random, tau relates to how much more likely they are to be concordant than discordant. That makes tau easier to explain to a non-technical audience.
Spearman's rho is more familiar and appears in more software defaults. For most exploratory work, either is fine. Report which one you used.
Common Mistakes
- Applying the shortcut formula with tied ranks. The $1 - 6\sum d_i^2/(n(n^2-1))$ formula assumes no ties. Fix: use software that computes Pearson on the ranks, or use a tie-corrected formula.
- Comparing tau and rho against the same cutoffs. Kendall's tau is systematically smaller. Fix: use separate benchmark tables for each coefficient.
- Ignoring the p-value. A coefficient of 0.9 from 5 observations is not strong evidence. Fix: always report the p-value and the sample size together.
- Treating a rank correlation as a linear correlation. A high rho means the ranks move together, not that the relationship is a straight line. Fix: plot the data before you interpret.
- Using Spearman on nominal data. Ranks require an order. Fix: use a measure designed for categories, such as Cramer's V.
- Reporting only the coefficient. Readers need the direction, the strength, the sample size, and the p-value. Fix: report all four.
Limitations
A ranking correlation coefficient cannot tell you the shape of a relationship. Two datasets can share the same rho while one follows a gentle curve and the other jumps in steps. It also cannot detect non-monotonic patterns. A perfect U-shape can produce a coefficient near zero even though the variables are strongly related.
The coefficient is sensitive to how you handle ties and missing values. Different software defaults can produce slightly different numbers on the same data. The p-value approximation is only accurate for very large samples, above roughly 500 [2]. For clustered or repeated-measures data, the standard coefficient ignores the dependence structure and can mislead, which is why adjusted between- and within-cluster versions have been developed [5].
Frequently Asked Questions
What is a ranking correlation coefficient in simple terms?
It is a number between -1 and +1 that shows whether two ranked lists tend to agree. If both lists put the same items near the top and the same items near the bottom, the coefficient is close to +1. If one list is the reverse of the other, it is close to -1.
What is the difference between Spearman and Kendall?
Spearman's rho applies the Pearson formula to ranks and is based on squared rank differences. Kendall's tau counts concordant and discordant pairs. Tau values are typically lower than rho values for the same data, and tau has a direct probability interpretation.
Can Spearman's rho be negative?
Yes. A negative rho means that as one variable's rank increases, the other's rank tends to decrease [2]. A value of -1 indicates an exact monotonic relationship in the opposite direction.
Which coefficient should I report?
Report the one that matches your question and your audience. Spearman is the common default and is widely understood. Kendall's tau is often preferred for small samples and when you want a probability-based interpretation. State your choice and why.
Does a high rank correlation prove causation?
No. A ranking correlation coefficient measures association only. Two variables can move together because of a shared cause, a selection effect, or coincidence. To explore causal claims you need a design that controls for confounders, such as an experiment or a well-specified regression model. For background on how correlation fits into broader modeling, see Introduction To Statistical Learning.
References
- The Rank Correlation coefficient
- spearmanr, SciPy v1.18.0 Manual
- spearmanrho, SciPy v1.18.0 Manual
- Spearman
- Tu S, Li C, Shepherd BE. (2025). Between- and Within-Cluster Spearman Rank Correlations. Statistics in medicine
Further Reading
Related Articles
- Correlation Examples: Positive, Negative and Zero Relationships
- Correlation vs Covariance: Differences and When to Use Each
- Confirmatory Factor Analysis: Definition and Example
- Multivariate Analysis: Definition, Methods and Examples
- Quadratic Regression Analysis: Equation and Example
- Which R-Value Represents the Strongest Correlation? A Guide to Interpreting Correlation Coefficients
- Correlation Analysis in SPSS
- Pearson vs. Spearman Correlation