NORM.DIST Formula in Excel: Syntax and Examples
By Dr. Zubair Khalid, DVM, MS, PhD ·
The NORM.DIST formula in Excel returns the normal distribution for a specified mean and standard deviation [1]. You supply a value, the mean, the standard deviation and a logical flag, and Excel returns either a cumulative probability or a probability density. It is one of the most widely used statistical functions in Excel, with applications in hypothesis testing and general data analysis [1].
Quick Answer
- Syntax:
NORM.DIST(x, mean, standard_dev, cumulative)[1]. - All four arguments are required [1].
- Set
cumulativeto TRUE for the cumulative distribution function, or FALSE for the probability density function [1]. - If
meanorstandard_devis nonnumeric, you get#VALUE!. Ifstandard_devis less than or equal to 0, you get#NUM![1]. - With mean 0, standard deviation 1 and cumulative TRUE, NORM.DIST returns the standard normal distribution, the same result as NORM.S.DIST [1].
Syntax
NORM.DIST(x, mean, standard_dev, cumulative)
| Argument | Required? | Meaning |
|---|---|---|
| x | Required | The value for which you want the distribution [1] |
| mean | Required | The arithmetic mean of the distribution [1] |
| standard_dev | Required | The standard deviation of the distribution [1] |
| cumulative | Required | A logical value. TRUE returns the cumulative distribution function, FALSE returns the probability density function [1] |
The order matters. Excel reads the arguments positionally, so NORM.DIST(115, 100, 15, TRUE) and NORM.DIST(100, 115, 15, TRUE) give very different answers.
How It Works
The normal distribution is defined by two parameters, the mean and the standard deviation. The mean sets the center of the curve and the standard deviation sets its spread. The density function describes the height of the curve at a given point. The cumulative function describes the area under the curve to the left of that point, which is the probability that a random value falls at or below x.
When cumulative is FALSE, NORM.DIST evaluates the normal density function [1]:
$$f(x) = \frac{1}{\sigma\sqrt{2\pi}} e^{-\frac{(x-\mu)^2}{2\sigma^2}}$$
When cumulative is TRUE, the result is the integral of that density from negative infinity to x [1]:
$$F(x) = \int_{-\infty}^{x} \frac{1}{\sigma\sqrt{2\pi}} e^{-\frac{(t-\mu)^2}{2\sigma^2}} \, dt$$
In practice you will use the cumulative form far more often. It answers questions like "what proportion of values fall below this threshold" or "what is the probability of a result this low or lower." The density form is useful for plotting the bell curve or comparing relative likelihoods at specific points.
NORM.DIST is the modern replacement for the older NORMDIST function. NORMDIST remains available for backward compatibility but may not be available in future versions of Excel, so new workbooks should use NORM.DIST [2]. The two functions take the same arguments and return the same values.
If you need the reverse operation, finding the x value that corresponds to a given probability, use NORM.INV. That function seeks the value x such that NORM.DIST(x, mean, standard_dev, TRUE) equals your target probability, so its precision depends on the precision of NORM.DIST [3].
Worked Example
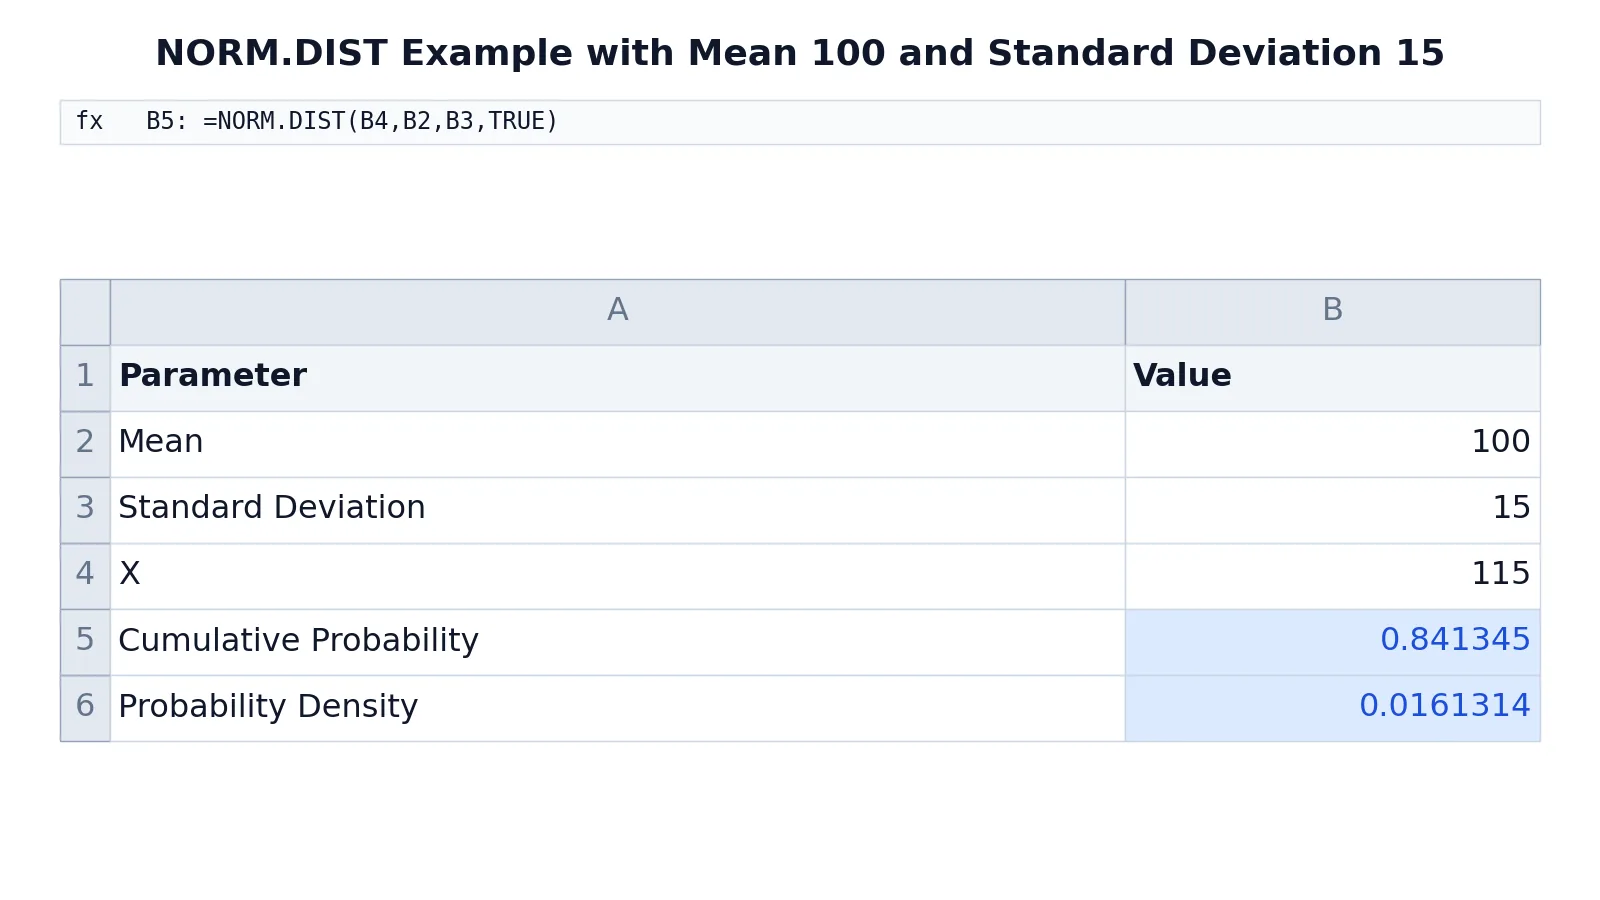
Suppose you are analyzing exam scores where the mean is 100 and the standard deviation is 15, and you want to know the probability of a score at or below 115, plus the density at that point.
| A | B | |
|---|---|---|
| 1 | Parameter | Value |
| 2 | Mean | 100 |
| 3 | Standard Deviation | 15 |
| 4 | X | 115 |
| 5 | Cumulative Probability | =NORM.DIST(B4,B2,B3,TRUE) -> displays 0.841345 |
| 6 | Probability Density | =NORM.DIST(B4,B2,B3,FALSE) -> displays 0.0161314 |
Cell B5 computes the cumulative probability using TRUE. The result 0.841345 means about 84.13 percent of values in this distribution fall at or below 115. Cell B6 computes the probability density using FALSE. The result 0.0161314 is the height of the density curve at x = 115, not a probability.
Notice that the two formulas differ only in the final argument. That single TRUE or FALSE switch changes the meaning of the output entirely. If you want a probability, use TRUE. If you want a curve height, use FALSE.
More Examples
Probability above a threshold. NORM.DIST gives the area to the left. To get the area to the right, subtract from 1:
=1-NORM.DIST(115,100,15,TRUE) returns 0.158655, the probability of a value above 115.
Probability between two values. Subtract the lower cumulative value from the upper one:
=NORM.DIST(115,100,15,TRUE)-NORM.DIST(85,100,15,TRUE) returns 0.682689, the probability of a value between 85 and 115. That figure matches the familiar rule that roughly 68 percent of a normal distribution lies within one standard deviation of the mean.
Standard normal distribution. With mean 0 and standard deviation 1, the cumulative form gives the standard normal result [1]:
=NORM.DIST(1.96,0,1,TRUE) returns 0.975002.
Referencing cells instead of typing numbers. Point the arguments at cells so you can change the mean or standard deviation without editing the formula. This is what the worked example above does with B2, B3 and B4. If you need to build cell references from text, the INDIRECT function can help, though direct references are simpler and faster.
Comparing groups. If you track two groups with different means and standard deviations, you can compute a cumulative probability for each and compare them side by side. The STDEV function gives you the sample standard deviation to feed into the standard_dev argument when you are estimating from data.
Counting values that meet a condition. If you want to count how many raw observations fall above a cutoff instead of computing a theoretical probability, SUMIF and SUMIFS or a comparison operator like greater than or equal to will do the job on the actual data.
Errors and How to Fix Them
| Error | Cause | Fix |
|---|---|---|
#VALUE! | mean or standard_dev is nonnumeric [1] | Check that the referenced cells contain numbers, not text |
#NUM! | standard_dev is less than or equal to 0 [1] | Supply a positive standard deviation |
#NAME? | The function name is misspelled | Use NORM.DIST exactly, with the period |
#VALUE! from the cumulative argument | cumulative was given a nonlogical value | Use TRUE or FALSE, or 1 or 0 |
A standard deviation of exactly 0 is a common trap when a column of identical values feeds the argument. Excel cannot compute a normal distribution with zero spread, so it returns #NUM! [1].
Common Mistakes
- Swapping the mean and x arguments. The first argument is the value you are evaluating, the second is the center of the distribution. Check the order against the syntax table before pressing Enter.
- Using FALSE when you want a probability. The density output looks like a small probability but it is a curve height and can exceed 1 for narrow distributions. Use TRUE for any probability question.
- Forgetting that NORM.DIST returns the left tail. Many people want the probability above a value and forget to subtract from 1. Wrap the formula in
1-for the right tail. - Passing a sample standard deviation without checking. If your data is a sample, use the sample standard deviation from the STDEV function rather than a population figure, and confirm which one your analysis requires.
- Typing the standard deviation as a variance. The argument is the standard deviation, not its square. If you have a variance, take the square root first.
- Mixing up NORM.DIST with NORMDIST in shared files. Both work, but NORMDIST is the legacy version and may not be available in future releases [2]. Standardize on NORM.DIST.
Limitations
NORM.DIST assumes your data follows a normal distribution. Real data often does not. Skewed data, data with heavy tails, or data with hard boundaries will produce misleading probabilities if you force a normal model onto it. Always plot the distribution before trusting the output.
The function also treats the mean and standard deviation you supply as known constants. In practice you usually estimate them from a sample, which adds uncertainty that NORM.DIST does not account for. For small samples, confidence intervals and t-based methods are more appropriate than normal probabilities. The function returns a single number for a single x value, so it does not test whether a normal model fits your data in the first place.
Frequently Asked Questions
What is the difference between NORM.DIST and NORM.S.DIST?
NORM.S.DIST is the standard normal case with mean 0 and standard deviation 1. NORM.DIST with mean 0, standard deviation 1 and cumulative TRUE returns the same result [1]. Use NORM.DIST when your distribution has its own mean and standard deviation, and NORM.S.DIST when you have already standardized your values.
Does NORM.DIST return a probability or a density?
It depends on the cumulative argument. TRUE returns the cumulative distribution function, which is a probability. FALSE returns the probability density function, which is a curve height and is not a probability [1]. If you need a probability, always use TRUE.
How do I get the probability above a value instead of below it?
Subtract the NORM.DIST result from 1. For example, =1-NORM.DIST(115,100,15,TRUE) returns 0.158655, the probability of a value greater than 115. NORM.DIST always returns the area to the left of x.
Why does NORM.DIST return #NUM!?
The most common cause is a standard deviation of 0 or a negative value. NORM.DIST returns #NUM! when standard_dev is less than or equal to 0 [1]. Check the cell feeding that argument and confirm it holds a positive number.
Can I use NORM.DIST to find the x value for a given probability?
No, that is the job of NORM.INV. NORM.INV seeks the value x such that NORM.DIST(x, mean, standard_dev, TRUE) equals your target probability [3]. Use NORM.DIST to go from x to probability and NORM.INV to go from probability back to x.
Is NORM.DIST the same as NORMDIST?
They take the same arguments and return the same values, but NORMDIST is the older function kept for backward compatibility and may not be available in future versions of Excel [2]. Use NORM.DIST for new work. If you are auditing an older workbook, the VLOOKUP guide and other function references can help you spot legacy formulas that may need updating.
References
- NORM.DIST function | Microsoft Support
- NORMDIST function | Microsoft Support
- NORM.INV function | Microsoft Support
Further Reading
- Altman DG, Bland JM (1995). Statistics notes: The normal distribution. BMJ
- Broman KW, Woo KH (2018). Data Organization in Spreadsheets. The American Statistician
- Ziemann M, Eren Y, El-Osta A (2016). Gene name errors are widespread in the scientific literature. Genome Biology