Descriptive vs Inferential Statistics: Differences and Examples
By Dr. Zubair Khalid, DVM, MS, PhD ·
What are the difference between descriptive and inferential statistics? Descriptive statistics summarize and describe the data you actually collected, such as a mean, a percentage, or a standard deviation. Inferential statistics go further and use that data to draw conclusions about a larger population you did not measure directly [1][2]. The two are not competitors. They answer different questions, and most real analyses use both.
Quick Answer
- Descriptive statistics summarize and describe a dataset. They do not generalize beyond the data at hand [1].
- Inferential statistics generalize from a sample to a population and test whether a pattern is likely to be real or just random variability [2].
- Descriptive tools include percentages, measures of central tendency (mean, median, mode), measures of dispersion (range, standard deviation, variance), and correlation coefficients [3].
- Inferential tools include confidence intervals, t-tests, chi-square tests, ANOVA, and regression.
- The key difference: descriptive statistics report on the data set itself, while inferential statistics are used to generate insights across data sets that would be difficult or impossible to analyze in full [4].
Key Differences
| Feature | Descriptive statistics | Inferential statistics |
|---|---|---|
| Purpose | Summarize and describe the data | Generalize from a sample to a population |
| Scope | Only the cases you measured | A broader population you did not measure |
| Typical outputs | Mean, median, mode, range, SD, variance, percentages, correlation coefficients | Confidence intervals, p-values, test statistics, effect sizes |
| Uses probability | No | Yes |
| Example question | "What was the average exam score in this class?" | "Is the average exam score in the population different from 70?" |
| Depends on sampling | No | Yes, results depend on how the sample was drawn |
The distinction comes down to one idea: descriptive statistics stop at the data, and inferential statistics reach past it [1][4].
Descriptive Statistics Explained
Descriptive statistics are numbers used to summarize and describe data, where data means the information collected from an experiment, a survey, or a historical record [1]. If you analyze birth certificates, a descriptive statistic might be the percentage of certificates issued in one state or the average age of the mother [1]. Any number you compute from a dataset counts as a descriptive statistic for that dataset.
Researchers usually report several descriptive statistics together to give a full picture of the data [1]. A single mean hides a lot. Pair it with a standard deviation and you see both the center and the spread. Add a median and you can spot skew.
Common descriptive measures fall into three groups:
- Frequency and percentage. How many cases fall in each category.
- Central tendency. Mean, median, and mode, which describe the typical value.
- Dispersion. Range, variance, and standard deviation, which describe how spread out the values are [3].
Correlation coefficients also count as descriptive when you use them only to describe the relationship inside your sample [3]. For a deeper look at the summary measures themselves, see What Is Descriptive Statistics? Definition and Examples. If you are unsure whether your variable is a count or a category, Qualitative vs Quantitative Data: Types and Examples covers that split.
Inferential Statistics Explained
Inferential statistics let researchers draw conclusions about a population based on data from a sample [2]. Typically researchers sample from a population but want to generalize their results to that broader population, and inferential statistics are the tool for that job [2].
The core problem is uncertainty. The effects researchers find, such as differences in means or a correlation coefficient, may be due to random chance variability, or they may reflect a real relationship between variables [2]. Inferential methods measure how surprising the observed effect would be if chance variability alone were at work.
A typical inferential workflow looks like this:
- State a null hypothesis, usually "no effect" or "no difference."
- Collect data from a sample.
- Compute a test statistic, such as a t value or a chi-square value.
- Compare it to a reference distribution to get a p-value.
- Report a confidence interval to show the plausible range of the population value.
Inferential statistics are also used to judge whether a theory has been supported, refuted, or needs modification [3]. For the broader logic behind these tests, see Inferential Statistical. When a result is statistically significant but tiny in size, Statistical Significance vs. Practical Significance explains why that gap matters.
One term you will meet constantly is the parameter, the population value you are trying to estimate. Parameter Definition in Statistics: Meaning and Examples walks through it.
Worked Example
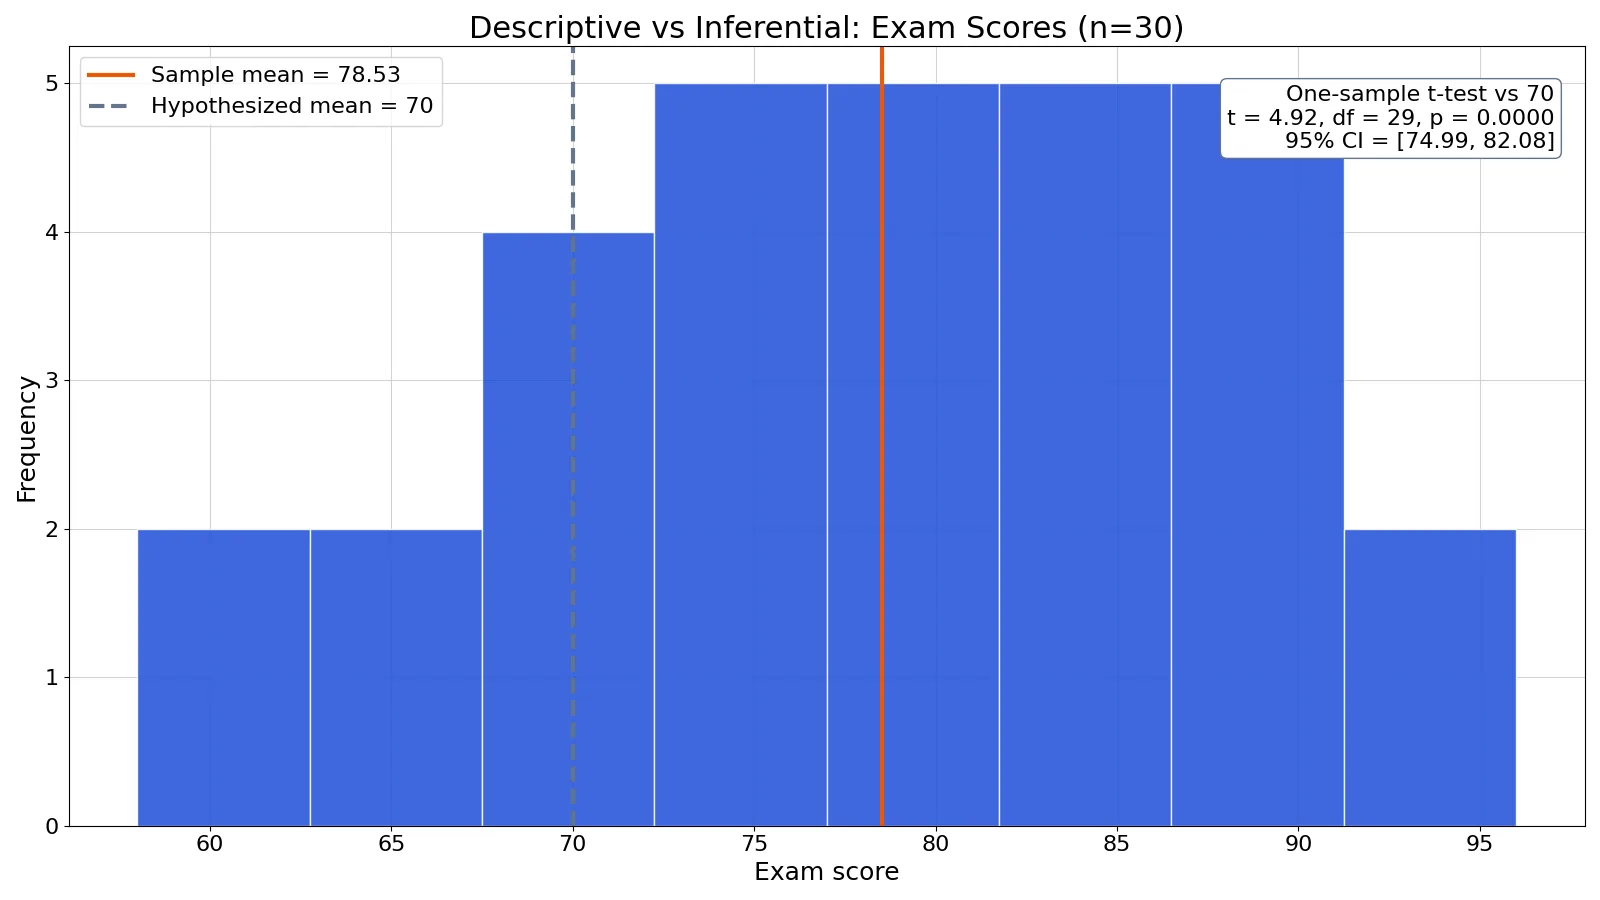
Suppose you have exam scores for a sample of 30 students. You want two things: a description of this sample, and a test of whether the population mean differs from 70.
The dataset:
| student_id | score | student_id | score | student_id | score |
|---|---|---|---|---|---|
| 1 | 58 | 11 | 75 | 21 | 84 |
| 2 | 62 | 12 | 76 | 22 | 85 |
| 3 | 65 | 13 | 76 | 23 | 86 |
| 4 | 67 | 14 | 77 | 24 | 87 |
| 5 | 68 | 15 | 78 | 25 | 88 |
| 6 | 70 | 16 | 79 | 26 | 89 |
| 7 | 71 | 17 | 80 | 27 | 90 |
| 8 | 72 | 18 | 81 | 28 | 91 |
| 9 | 73 | 19 | 82 | 29 | 93 |
| 10 | 74 | 20 | 83 | 30 | 96 |
Step 1: Descriptive statistics. The sample size is $n = 30$. The sample mean is
$$\bar{x} = \frac{2356}{30} = 78.5333$$
The sample standard deviation, using $n-1$ in the denominator, is $sd = 9.4931$. So the typical student scored about 78.5, with scores spread roughly 9.5 points around that center. These numbers describe only these 30 students.
Step 2: Standard error. The standard error measures how much a sample mean would bounce around from sample to sample:
$$SE = \frac{sd}{\sqrt{n}} = \frac{9.4931}{\sqrt{30}} = 1.7332$$
Step 3: Test statistic. Test the null hypothesis that the population mean is $\mu_0 = 70$:
$$t = \frac{\bar{x} - \mu_0}{SE} = \frac{78.5333 - 70}{1.7332} = 4.9235$$
Step 4: Degrees of freedom and p-value. With $df = n - 1 = 29$, the two-sided p-value is $p = 0.0000$. The observed mean is far from 70 relative to the standard error.
Step 5: Confidence interval. The 95% confidence interval for the population mean is $[74.9885, 82.0781]$. This is the inferential part. It says that if you repeated this sampling process many times, intervals built this way would capture the true population mean in 95% of cases.
The code:
import statistics
from scipy import stats
scores = [58,62,65,67,68,70,71,72,73,74,75,76,76,77,78,79,80,81,82,83,84,85,86,87,88,89,90,91,93,96]
mean = statistics.fmean(scores)
sd = statistics.stdev(scores)
t, p = stats.ttest_1samp(scores, popmean=70)
Output:
mean = 78.5333, sd = 9.4931, t = 4.9235, p = 0.0000, 95% CI = [74.9885, 82.0781]Notice how the two halves work together. The mean and standard deviation describe the sample. The t statistic, p-value, and confidence interval make a claim about the population. If you only reported the mean of 78.53, you would have a description with no basis for generalization. If you only reported the p-value, you would have a conclusion with no picture of the data behind it.
Which One Should You Use?
Use descriptive statistics when your question is about the data you have. Examples include a class average, a monthly sales total, a dashboard of customer counts, or a summary of survey responses from everyone you surveyed.
Use inferential statistics when your question is about a group larger than the data you have. Examples include testing whether a new drug lowers blood pressure more than a placebo, estimating the national unemployment rate from a survey, or checking whether a website redesign changed conversion rates.
In practice, most studies report both. Data are typically analyzed using both descriptive and inferential statistics, with descriptive statistics summarizing the data and inferential statistics generalizing the results from the sample to the population [3][2]. A results section that reports only a p-value, with no means or standard deviations, is hard to interpret. A results section that reports only means, with no test, cannot support a claim about a population.
A quick rule: if your sentence contains "in the population" or "in general," you need inferential statistics. If it contains "in this sample" or "in this dataset," descriptive statistics will do.
Common Mistakes
- Reporting a p-value with no descriptive context. A p-value tells you about evidence, not about size. Fix: always report the group means, standard deviations, and sample sizes alongside the test result.
- Treating a sample mean as the population mean. The sample mean is an estimate with uncertainty attached. Fix: report a confidence interval so readers see the range of plausible population values.
- Running an inferential test on a non-random or biased sample. Inferential methods assume the sample represents the population. Fix: check your sampling method before you test, and describe how the sample was drawn.
- Confusing statistical significance with importance. A tiny difference can be significant with a large enough sample. Fix: report an effect size and judge it against practical thresholds.
- Using the wrong standard deviation formula. The population SD divides by $n$, and the sample SD divides by $n-1$. Fix: use $n-1$ when your data are a sample, which is almost always the case in research.
- Ignoring the assumptions of the test. The one-sample t-test assumes roughly independent observations and a reasonably normal distribution, or a large enough sample. Fix: check a histogram or use a method suited to your data.
Limitations
Descriptive statistics cannot support any claim beyond the data you measured. A mean of 78.53 for 30 students says nothing about students you did not test, no matter how clean the number looks. Descriptive summaries also hide structure. Two datasets with the same mean and standard deviation can have completely different shapes, including outliers, gaps, and clusters.
Inferential statistics carry their own limits. Their conclusions depend on how the sample was drawn, so a biased sample produces confident but wrong answers. A p-value is not the probability that the null hypothesis is true, and it does not measure the size or importance of an effect. Confidence intervals depend on the same sampling assumptions. When assumptions are violated, or when many tests are run on the same data, the stated error rates no longer hold.
Frequently Asked Questions
Is a mean a descriptive or inferential statistic?
A mean is descriptive when it summarizes the data you collected. It becomes part of an inferential analysis when you use it to estimate a population mean, for example inside a confidence interval or a t-test. The same number can play either role depending on the claim you attach to it.
Can you use inferential statistics without descriptive statistics?
You can compute them, but the result is hard to trust or interpret. Descriptive statistics show whether the data look reasonable and reveal outliers or odd distributions. Skipping them means you might run a test on data that violate its assumptions without knowing it.
What is the difference between a parameter and a statistic?
A statistic is a number computed from a sample, such as the sample mean of 78.5333 in the example above. A parameter is the corresponding value in the population, which is usually unknown. Inferential statistics use statistics to estimate parameters.
Does a small p-value prove that an effect is real?
No. A small p-value means the observed result would be unlikely if the null hypothesis were true. It does not prove causation, and it does not rule out bias, confounding, or chance from other sources. It is one piece of evidence among several.
How large should a sample be for inferential statistics?
It depends on the test, the effect size you want to detect, and the variability in your data. Larger samples give narrower confidence intervals and more power to detect small effects. A power analysis before data collection is the standard way to choose a sample size.
References
- 6.8: Descriptive versus Inferential Statistics - Social Sci LibreTexts/06%3A_Inferential_Statistics_and_an_Introduction_to_Hypothesis_Testing/6.08%3A_Descriptive_versus_Inferential_Statistics)
- 2.7: Analyzing the Data - Social Sci LibreTexts
- 2.7: Analyzing the Data- Overview - Social Sci LibreTexts/02%3A_Overview_of_the_Scientific_Method/2.07%3A_Analyzing_the_Data-_Overview)
- What's the difference between descriptive and inferential statistics?
Further Reading
Related Articles
- What Is Descriptive Statistics? Definition and Examples
- Parameter Definition in Statistics: Meaning and Examples
- Mean vs Median: Differences and When to Use Each
- Qualitative vs Quantitative Data: Types and Examples
- Inferential Statistical
- Statistical Significance vs. Practical Significance
- Descriptive Research Questions