CAGR Formula in Excel: How to Calculate Annualized Growth
By Dr. Zubair Khalid, DVM, MS, PhD ·
The CAGR formula in Excel answers a simple question: if an investment or metric grew at a steady compounded rate every year, what rate would take the starting value to the ending value? You only need three inputs, the beginning value, the ending value, and the number of periods. The result is a single annualized growth rate you can compare across investments or time spans.
Quick Answer
- CAGR stands for compound annual growth rate, the smoothed annual rate that links a beginning value to an ending value over a set number of periods [1].
- The core formula is $CAGR = \left(\frac{Ending}{Beginning}\right)^{\frac{1}{n}} - 1$, where $n$ is the number of periods.
- In Excel, type
=(B6/B2)^(1/4)-1to get the rate directly from two cells and a period count. - The
RATEfunction gives the same answer:=RATE(4,0,-B2,B6). - Format the result as a percentage so it reads as a rate instead of a decimal.
The Formula
The compound annual growth rate formula is:
$$CAGR = \left(\frac{EV}{BV}\right)^{\frac{1}{n}} - 1$$
Each symbol means the following:
- $EV$ is the ending value, the final figure in the series.
- $BV$ is the beginning value, the starting figure.
- $n$ is the number of periods, usually years. It is the count of intervals between the two values, not the count of data points.
- The exponent $\frac{1}{n}$ spreads the total growth evenly across those periods.
- Subtracting 1 converts the growth multiple into a rate.
Microsoft describes CAGR as a "smoothed" rate of return because it measures growth as if it had happened at a steady rate on an annually compounded basis [1]. That smoothing is the whole point. It ignores the bumps in between and reports one comparable number.
How to Calculate It Step by Step
- Put your beginning value in one cell and your ending value in another. For example,
B2holds the first year andB6holds the last. - Count the periods. If your data runs from 2019 to 2023, that is 4 periods, not 5. The number of periods is the number of gaps between the values.
- Divide the ending value by the beginning value. This gives the total growth multiple.
- Raise that multiple to the power of $1/n$. In Excel, the caret
^is the power operator, so(B6/B2)^(1/4)does this in one step. - Subtract 1 to turn the multiple into a rate.
- Format the cell as a percentage. Right-click the cell, choose Format Cells, and pick Percentage.
The finished formula looks like this:
=(B6/B2)^(1/4)-1If you prefer a built-in function, Excel's RATE function returns the same value. It takes the number of periods, the payment (0 here, since there are no periodic payments), the present value as a negative number, and the future value [2]. The syntax is =RATE(nper, pmt, pv, fv).
Worked Example
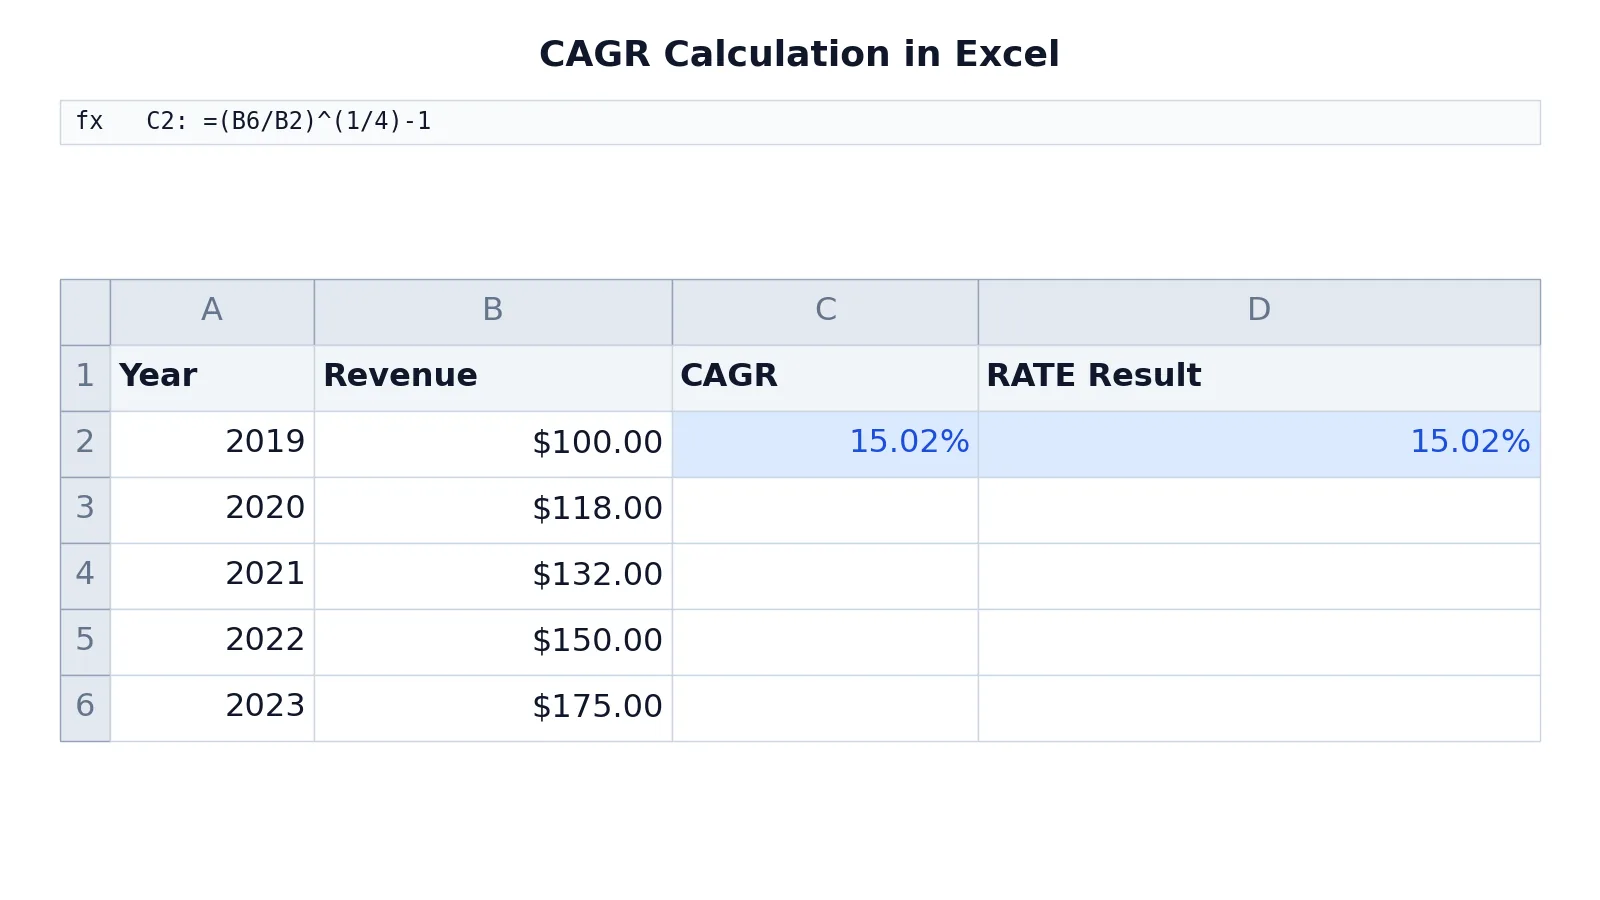
The table below shows annual revenue for a small business from 2019 to 2023. Column C computes CAGR with the power formula, and column D computes the same rate with RATE.
| A | B | C | D | |
|---|---|---|---|---|
| 1 | Year | Revenue | CAGR | RATE Result |
| 2 | 2019 | 100 | =(B6/B2)^(1/4)-1 -> displays 15.02% | =RATE(4,0,-B2,B6) -> displays 15.02% |
| 3 | 2020 | 118 | ||
| 4 | 2021 | 132 | ||
| 5 | 2022 | 150 | ||
| 6 | 2023 | 175 |
Cell C2 computes CAGR using the beginning value, the ending value, and 4 periods. Cell D2 computes CAGR using the RATE function with 4 periods, no payments, the beginning value as a negative, and the ending value. Both return 15.02%.
Notice that the revenue did not grow 15.02% every year. It grew 18%, then about 11.9%, then about 13.6%, then about 16.7%. CAGR reports the single steady rate that produces the same end result. That is why it is useful for comparison and misleading if you treat it as a forecast.
How to Interpret the Result
A CAGR of 15.02% means the revenue grew at an average compounded rate of 15.02% per year across the four periods. If the business had grown at exactly that rate each year, it would have reached the same 175 figure.
Use CAGR to compare growth across different time spans or different investments. Microsoft advises comparing CAGRs only when each rate is calculated over the same investment period, since a rate over 3 years and a rate over 10 years are not directly comparable [1].
A positive CAGR means growth. A CAGR of 0% means the ending value equals the beginning value. A negative CAGR means the value shrank. The rate is always expressed per period, so if your periods are months, the result is a monthly compounded rate, not an annual one.
Doing It in Software
Excel offers three practical routes to the same number.
The power formula is the most transparent:
=(B6/B2)^(1/4)-1The RATE function is cleaner when you already think in financial terms:
=RATE(4,0,-B2,B6)The RRI function returns "an equivalent interest rate for the growth of an investment" and takes the number of periods, the present value, and the future value [2]. Its syntax is =RRI(nper, pv, fv), so the same example becomes:
=RRI(4,B2,B6)All three return 15.02% for this data. Pick whichever fits your sheet. The power formula works in every version of Excel and in Google Sheets. RATE and RRI are standard Excel functions available in current versions [2].
If you track growth across quarters instead of years, the same math applies once you count the right number of periods. A guide on how to calculate quarter of year in Excel can help you build the period count correctly before you feed it into the formula.
Common Mistakes
- Counting data points instead of periods. Five years of data give 4 periods, not 5. Fix: subtract 1 from the number of values, or count the gaps between them.
- Mixing up beginning and ending values. Reversing them gives a wrong rate, and a negative one if the value grew. Fix: label the cells clearly before writing the formula.
- Forgetting to subtract 1.
(B6/B2)^(1/4)returns a multiple like 1.1502, not a rate. Fix: always end the formula with-1. - Leaving the result as a decimal. 0.1502 is correct math but reads poorly. Fix: format the cell as a percentage.
- Using a simple average of yearly growth rates. Averaging yearly percentages overstates compounded growth. Fix: use the CAGR formula, which accounts for compounding.
- Comparing CAGRs over different periods. A 3-year CAGR and a 10-year CAGR are not comparable. Fix: align the period length before comparing [1].
Limitations
CAGR smooths everything into one number, so it hides volatility. An investment that swung wildly and one that climbed steadily can share the same CAGR, even though the risk was completely different. It also says nothing about what happened in the middle years, so it cannot show a dip, a recovery, or a plateau.
CAGR is a historical measure, not a forecast. It describes what already happened between two points. It does not predict future growth, and it assumes reinvestment of all gains at the same rate. When you need to account for irregular cash flows, a function like XIRR is the better tool, since it handles money moving in and out at different dates [1]. For a plain percentage change between two single values, a simpler percentage increase formula in Excel may be all you need.
Frequently Asked Questions
What is the CAGR formula in Excel?
The formula is =(Ending/Beginning)^(1/n)-1, where n is the number of periods. You can also use =RATE(n,0,-Beginning,Ending) or =RRI(n,Beginning,Ending). All three return the same annualized rate.
How do I calculate CAGR in Excel with the RATE function?
Use =RATE(nper, pmt, pv, fv). Set nper to the number of periods, pmt to 0 because there are no periodic payments, pv to the beginning value as a negative number, and fv to the ending value. For 4 periods from 100 to 175, =RATE(4,0,-100,175) returns 15.02%.
Is there a CAGR function in Excel?
There is no function literally named CAGR. The RRI function is the closest built-in equivalent, since it returns an equivalent interest rate for the growth of an investment given periods, present value, and future value [2]. The power formula and RATE also work.
How many periods should I use for CAGR?
Use the number of intervals between your beginning and ending values. Data from 2019 to 2023 spans 4 periods. If your data is monthly, use the number of months and label the result as a monthly rate.
Can CAGR be negative?
Yes. If the ending value is lower than the beginning value, the ratio is below 1 and the result is negative. A negative CAGR means the value declined at a steady compounded rate over the period.
References
- Calculate a compound annual growth rate (CAGR) in Excel | Microsoft Support
- RRI function | Microsoft Support
Further Reading
- Broman KW, Woo KH (2018). Data Organization in Spreadsheets. The American Statistician
- Ziemann M, Eren Y, El-Osta A (2016). Gene name errors are widespread in the scientific literature. Genome Biology
- Microsoft Support: Excel help and learning
- McCullough B, Heiser DA (2008). On the accuracy of statistical procedures in Microsoft Excel 2007. Computational Statistics & Data Analysis