Binary Fission: Steps and Bacterial Growth
By Dr. Zubair Khalid, DVM, MS, PhD ·
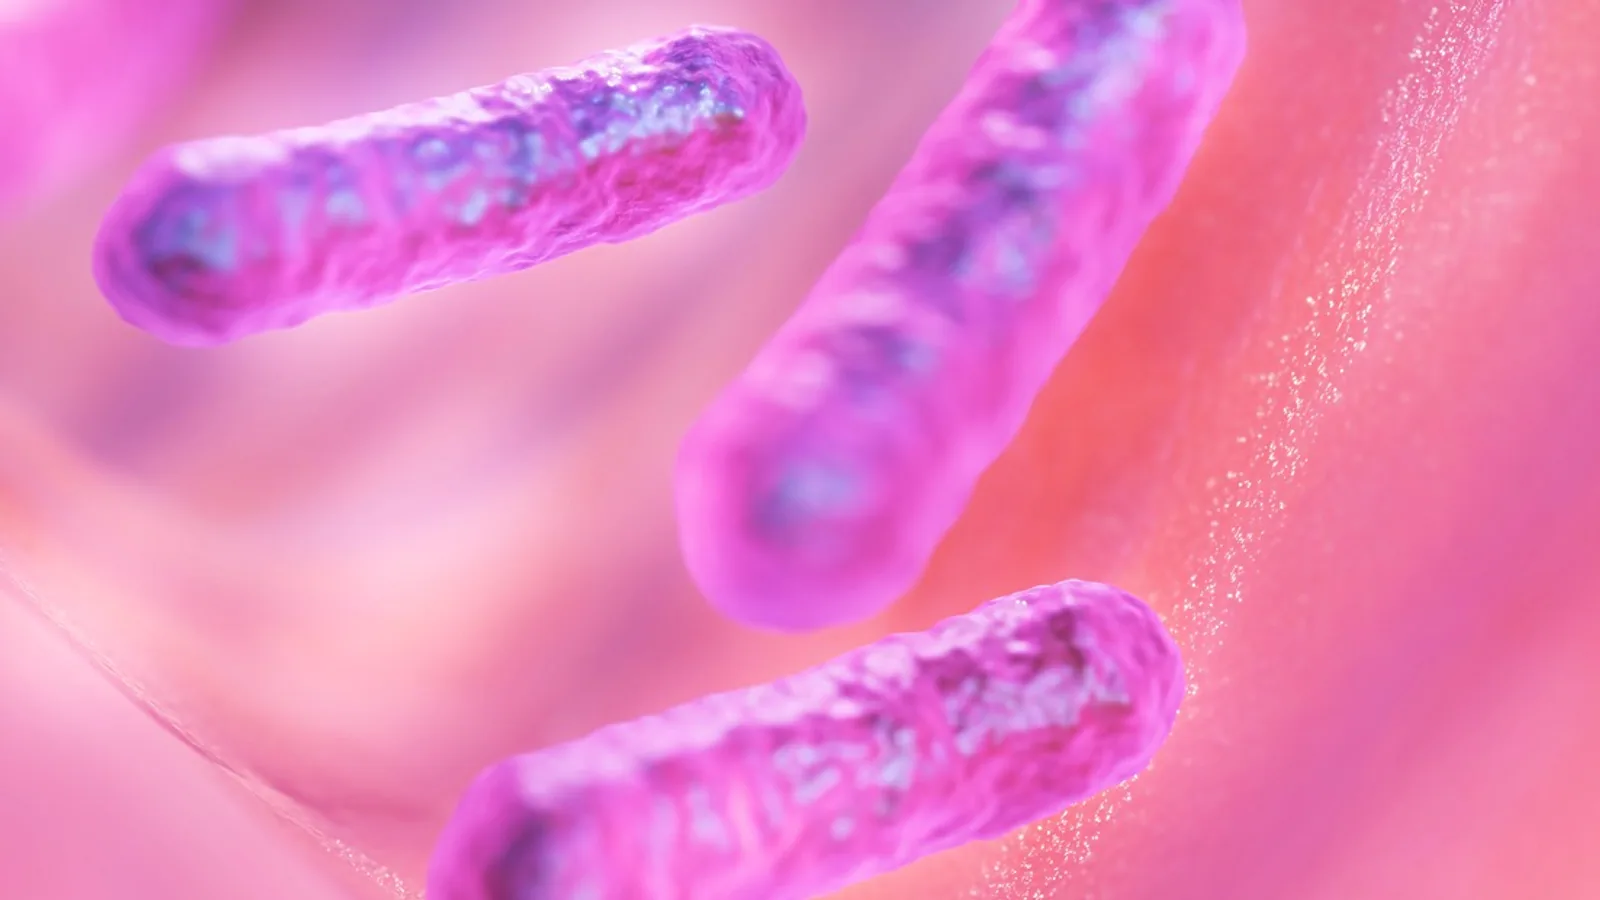
Binary fission is the asexual division of one bacterial cell into two genetically identical daughter cells of roughly equal size. It is the most common mode of bacterial reproduction and is distinct from mitosis, which occurs in eukaryotic cells and uses a spindle apparatus, and from budding, in which a smaller daughter cell grows out of a parent cell rather than forming by symmetric constriction at mid-cell [1][2].
This matters in veterinary practice because bacterial population growth drives the speed of infection, the size of a wound contamination problem, and the timing of culture results. A single organism that lands in a warm, nutrient-rich environment can become a visible, clinically significant population in hours. Understanding the mechanics of division and the phases of the growth curve lets a clinician reason about why a culture turns positive overnight, why a biofilm behaves differently from a planktonic culture, and why some organisms grow so slowly that cultures must be held for days or weeks.
What Binary Fission Is and What It Is Not
Binary fission is a form of fission biology, the broad study of how cells split into new cells. In bacteria, the process is coordinated by a multiprotein assembly called the divisome, a transient complex of more than 30 proteins that assembles at the cytoplasmic membrane, constricts the cell envelope, and remodels the peptidoglycan layer until the cell separates into two [3].
The defining features of binary fission are symmetry and identity. The mother cell replicates its chromosome, segregates one copy to each half, and divides at the midpoint so both daughters receive a comparable share of cytoplasm, ribosomes, and envelope. The daughters are clones. Binary fission does not generate genetic diversity on its own. Variation in bacteria comes from mutation, horizontal gene transfer, and recombination, not from the division event itself [4].
Binary Fission Compared With Mitosis and Budding
| Feature | Binary fission | Mitosis | Budding |
|---|---|---|---|
| Cell type | Bacteria and archaea | Eukaryotic cells | Some bacteria, fungi, yeast |
| Division plane | Mid-cell, symmetric | Spindle-guided | Polar, asymmetric |
| Chromosome handling | Single circular chromosome, ParABS partitioning | Multiple linear chromosomes, spindle and kinetochores | Chromosome copied and partitioned into the bud |
| Daughter cells | Two identical cells | Two identical cells | Parent and smaller bud, not identical |
| Key machinery | FtsZ ring and divisome | Tubulin spindle and kinetochores | Varies, often MreB-dependent |
| Genetic outcome | Clonal | Clonal | Clonal but asymmetric in size and content |
Budding is not a minor variation. Chlamydia, an obligate intracellular pathogen with a reduced genome, has lost ftsZ entirely and divides by an MreB-dependent polarized budding process instead of FtsZ-based binary fission [5]. The planctomycete Planctopirus limnophila also divides by budding and can survive deletion of canonical division genes such as ftsI, ftsW, and mreB without a change in growth rate [6]. These exceptions show that binary fission is the dominant but not the universal route.
The Ordered Steps of Binary Fission
The sequence below follows the well-characterized model in Escherichia coli, where most molecular players have been identified [3]. Other species adapt the same framework to different shapes and lifestyles.
Step 1: DNA Replication
The single circular chromosome is copied before division. Replication begins at a defined origin and proceeds bidirectionally around the ring. In rapidly growing E. coli, a new round of replication can start before the previous round finishes, so a cell may carry multiple replication forks at once. The cell cycle tightly coordinates chromosome replication with the other division events [7][8].
Step 2: Chromosome Segregation
The two completed chromosomes must move apart so each daughter receives one. Bacteria lack a mitotic spindle. Instead, the ParABS system and nucleoid-associated proteins position the chromosomes. The ParB protein binds a centromere-like region near the origin and, with ParA, drives the replicated chromosomes toward opposite cell poles [8]. In Bdellovibrio bacteriovorus, this partitioning machinery is so tightly choreographed that the timing of chromosome segregation determines how many progeny the predator produces [8].
Step 3: FtsZ Ring Formation
FtsZ is a bacterial homolog of eukaryotic tubulin. It polymerizes into filaments that bundle into a ring, the Z-ring, at the future division site at mid-cell [1]. The Z-ring is the first visible step of bacterial cytokinesis and the scaffold on which the rest of the divisome assembles. FtsZ is highly conserved across most prokaryotes, which is why it is a focus of antibiotic research: blocking FtsZ halts division and produces a bacteriostatic or bactericidal effect [1].
In rod-shaped cells, placement of the Z-ring is guided by the nucleoid occlusion system and the Min proteins, which prevent the ring from forming over the chromosome or at the poles. Spherical bacteria such as Staphylococcus aureus and Streptococcus pneumoniae face a harder problem because they lack obvious polarity, and they use additional regulators to find mid-cell [2]. In S. aureus, the essential protein GpsB localizes to mid-cell, co-constricts with the division machinery, bundles and organizes FtsZ filaments, and stimulates FtsZ GTPase activity [9]. Depletion of GpsB arrests division and causes lysis, while overproduction inhibits division and produces enlarged cells [9].
Step 4: Septum Formation and Cell Wall Constriction
Once the Z-ring is anchored to the membrane, the divisome recruits peptidoglycan synthesis enzymes and begins building the septum, a cross-wall that grows inward from the envelope. FtsZ is tethered to the membrane by anchor proteins, including FtsA in E. coli and SepF in archaea and some bacteria [3][10]. The ring constricts, pulling the membrane and cell wall inward. Peptidoglycan is simultaneously synthesized at the septum and remodeled so the new wall is continuous with the old [11][4].
In S. aureus, the division septum also serves as a hub for modifying the peptidoglycan that decorates the cell surface, linking division directly to the organism's surface architecture and its interaction with the host [11].
Step 5: Separation of Daughter Cells
The final step is splitting the shared envelope. The septum is cleaved by peptidoglycan hydrolases, and the two cells separate. In some species, separation is incomplete, and daughter cells remain attached as chains or clusters. In multicellular magnetotactic prokaryotes, cells adhere through juxtaposed membranes and divide by unilateral constriction, with incomplete separation of offspring driving the evolution of multicellularity [12].
flowchart TD
    A[Vegetative cell] --> B[[DNA replication](/blog/guides/dna-replication)]
    B --> C[Chromosome segregation]
    C --> D[FtsZ ring at mid cell]
    D --> E[Divisome assembly]
    E --> F[Septum synthesis]
    F --> G[Constriction]
    G --> H[Septum cleavage]
    H --> I[Two daughter cells]
The Bacterial Growth Curve
When a pure culture is inoculated into fresh broth and incubated, the population passes through four phases. The classic curve is drawn on a log scale of viable cell number against time.
Lag Phase
The cells are metabolically active but not yet dividing. They synthesize enzymes, ribosomes, and ATP to exploit the new medium. Viable count stays flat. In the laboratory, a lag phase is visible as no change in turbidity or colony count for the first hours after inoculation. Lag length depends on the age of the inoculum and the difference between the old and new medium.
Log Phase (Exponential Phase)
Cells divide at a constant maximum rate. Each generation doubles the population, so numbers rise exponentially. On a log-scale plot, log phase is a straight line. The slope of that line gives the specific growth rate, and the reciprocal gives the generation time.
Generation time is not a fixed property of bacteria. E. coli in ideal laboratory conditions divides roughly every 20 minutes. In vivo, in a host, generation time is usually much longer because nutrients are limited, the immune system removes organisms, and the environment is hostile. Obligate intracellular bacteria are extreme examples. Chlamydia depends on host cell resources and has a complex developmental cycle rather than a simple doubling time [5]. Endosymbionts such as Blattabacterium in cockroaches are constrained by the space and resources of their host cells, yet they still show division rates of 20% to 58% in sampled populations [13].
Stationary Phase
Growth slows and then stops. The number of viable cells is constant because the rate of division equals the rate of death. Nutrients become limiting, waste products accumulate, and pH or oxygen tension shifts. Cells become smaller and more resistant. In E. coli and Salmonella enterica, stationary-phase cells converge on a similar cell volume distribution regardless of the growth medium, and resuspending them in rich medium causes a transient volume increase that peaks after about 2 hours before returning to the stationary size [14].
Death Phase
The viable count falls as cells die faster than they divide. Death is not instantaneous and not uniform. Some cells persist, and a small fraction may survive for long periods. This is one reason cultures can remain positive long after the visible turbidity has cleared.
Table: Growth Phase, Cell Biology, and Lab Observations
| Phase | What the cells are doing | Typical lab observation |
|---|---|---|
| Lag | Synthesizing enzymes and ribosomes, not dividing | Flat viable count, no rise in turbidity |
| Log | Dividing at maximum rate, population doubles per generation | Rising turbidity, straight line on log plot, short generation time |
| Stationary | Division rate equals death rate, nutrient limitation, cells shrink | Plateau in viable count, stable turbidity, smaller cells |
| Death | Death exceeds division, lysis and persistence | Falling viable count, clearing or debris, some survivors |
Generation Time and Exponential Growth
Generation time, also called doubling time, is the time required for the population to double. In log phase, the relationship is:
N = N₀ × 2ⁿ
where N is the final number, N₀ is the starting number, and n is the number of generations. The number of generations is the elapsed time divided by the generation time.
A worked example makes this concrete. If 100 E. coli cells enter log phase with a 20-minute generation time, then after 2 hours (120 minutes) there have been 6 generations. N = 100 × 2⁶ = 6,400 cells. After 6 hours (18 generations), N = 100 × 2¹⁸ = about 26 million cells. This is why a culture that looks clear at 8 a.m. can be turbid by early afternoon.
The same arithmetic explains why in vivo growth is slower. If the generation time in a host is 60 minutes rather than 20, the same 6 hours yields only 6 generations instead of 18, and the population is roughly 6,400 rather than 26 million.
Generation time varies widely across species and conditions. A slow-growing organism may take hours per division, which is why some cultures are held for weeks. The growth rate is a property of the organism in a given environment, not a constant.
How Binary Fission and Growth Are Observed in Practice
In the diagnostic laboratory, bacterial growth is assessed by several methods.
Viable plate counts measure colony-forming units (CFU) per milliliter. Serial dilutions are plated, incubated, and counted. This method captures only cells that can divide and form colonies, so it underestimates total cell number if some cells are viable but non-culturable.
Turbidity measured by spectrophotometer at 600 nm is a rapid proxy for biomass. It correlates with cell number in log phase but not in stationary or death phase, because dead cells and debris still scatter light.
Time-lapse microscopy follows individual cells and reveals division events directly. This approach was used to show that the spherical appendages of Pseudogemmatithrix spongiicola never grow or divide, disproving the earlier assumption that they were daughter cells from budding and confirming that the organism divides by FtsZ-based binary fission [15].
Growth curve construction combines viable counts and turbidity over time to define lag, log, stationary, and death phases for a given organism and medium. The shape of the curve is used to standardize inocula for susceptibility testing and to compare growth rates between strains.
In veterinary microbiology, these methods are applied to samples from animals. A urine culture, a wound swab, or a milk sample is inoculated onto selective and non-selective media, incubated, and examined for colony morphology and growth rate. The growth rate itself can be a clue: rapidly growing organisms such as E. coli produce visible colonies overnight, while slow-growing or fastidious organisms may require extended incubation.
Clinical Relevance, Limitations and Common Mistakes
Binary fission is the engine of bacterial population growth, and its speed determines how quickly an infection can progress. A contaminated wound, a urinary tract infection, or a contaminated surgical site can go from a small inoculum to a large population in a short time if conditions favor log-phase growth. The same principle applies to food safety and to the contamination of intravenous lines, catheters, and surgical implants.
The growth curve is a laboratory abstraction. In a real host, bacteria face immune pressure, nutrient limitation, competing flora, and physical clearance. A broth culture in log phase is not a model of an infected tissue. In vivo, organisms may grow slowly, persist in stationary phase, or form biofilms in which cells divide at different rates and are protected from antimicrobials.
Several mistakes are common among students.
Assuming all bacteria divide at the same rate. Generation times range from roughly 20 minutes for E. coli in ideal conditions to hours or days for slow-growing or intracellular organisms. The rate depends on the species and the environment.
Confusing binary fission with mitosis. Binary fission uses FtsZ and a mid-cell septum. Mitosis uses a spindle and a nuclear envelope. They are mechanistically different.
Thinking binary fission creates genetic diversity. It does not. The daughters are clones. Diversity arises from mutation, horizontal gene transfer, and recombination [4].
Assuming the Z-ring is universal. Chlamydia lacks FtsZ and divides by MreB-dependent budding [5]. Planctopirus limnophila divides by budding and does not require several canonical division genes [6]. Bdellovibrio can switch between binary and non-binary fission depending on prey size [7].
Treating the growth curve as fixed. Lag length, growth rate, and stationary-phase behavior all change with medium, temperature, and inoculum history. Stationary-phase cell size, for example, converges across media, but the path to that state depends on the medium [14].
This article is educational and is not a substitute for veterinary diagnosis or treatment.
Quick Review
- Binary fission is asexual division into two identical daughter cells, distinct from mitosis and budding.
- The ordered steps are DNA replication, chromosome segregation, FtsZ ring formation, septum synthesis and constriction, and separation.
- FtsZ is a tubulin homolog that polymerizes into the Z-ring at mid-cell and anchors the divisome [1].
- The growth curve has four phases: lag, log, stationary, and death.
- In log phase, the population doubles per generation, so numbers grow exponentially.
- Generation time is not fixed. E. coli divides about every 20 minutes in ideal lab conditions and more slowly in vivo.
- Binary fission is the dominant but not universal mode. Chlamydia, Planctopirus, and Bdellovibrio deviate in instructive ways.
Frequently Asked Questions
What is binary fission in simple terms?
Binary fission is how a bacterium splits into two identical cells. The cell copies its DNA, builds a ring of FtsZ protein at its midpoint, pinches inward, and separates into two daughters.
How is binary fission different from mitosis?
Binary fission occurs in bacteria and uses an FtsZ ring and a mid-cell septum. Mitosis occurs in eukaryotic cells and uses a spindle apparatus and a nuclear envelope.
How fast do bacteria divide?
It depends on the species and the environment. E. coli can divide about every 20 minutes in ideal laboratory conditions, but growth in a host is usually much slower.
What are the four phases of bacterial growth?
Lag, log, stationary, and death. Lag is preparation, log is exponential division, stationary is a balance of division and death, and death is a net decline in viable cells.
Do all bacteria divide by binary fission?
No. Chlamydia divides by MreB-dependent budding without FtsZ, and some predatory and planctomycete bacteria use non-binary or budding modes.
Does binary fission create genetic diversity?
No. The daughter cells are clones. Genetic diversity comes from mutation, horizontal gene transfer, and recombination.
Related Articles
- How to Set Up a Positive Control for Bacterial Growth Curves
- Bacterial Growth Dynamics in Chicken: From Farm to Refrigeration
- How to Perform a Bacterial Growth Curve: Protocol and Data Analysis
- How to Calculate Bacterial Growth Rate and Doubling Time from a Growth Curve
- Growth Curve Modeling for Biological Data
- Translation Biology Diagram: Steps, Simple Guide
- Genetic Transduction: How Phages Move Bacterial Genes
- Epiphyseal Plate: Growth, Anatomy and Clinical Notes
Sources
- Targeting Bacterial Cell Division: A Binding Site-Centered Approach to the Most Promising Inhibitors of the Essential Protein FtsZ.
- How do spherical bacteria regulate cell division?
- A dynamic duo: Understanding the roles of FtsZ and FtsA for Escherichia coli cell division through in vitro approaches.
- Plasticity in the cell division processes of obligate intracellular bacteria.
- Division without Binary Fission: Cell Division in the FtsZ-Less Chlamydia.
- Non-essentiality of canonical cell division genes in the planctomycete Planctopirus limnophila.
- Binary or Nonbinary Fission? Reproductive Mode of a Predatory Bacterium Depends on Prey Size.
- Chromosome choreography during the non-binary cell cycle of a predatory bacterium.
- An essential Staphylococcus aureus cell division protein directly regulates FtsZ dynamics.
- SepF is the FtsZ anchor in archaea, with features of an ancestral cell division system.
- Staphylococcus aureus as an emerging model to study bacterial cell division.
- Juxtaposed membranes underpin cellular adhesion and display unilateral cell division of multicellular magnetotactic prokaryotes.
- Frequent and asymmetric cell division in endosymbiotic bacteria of cockroaches.
- Inferring bacterial cell size dynamics across media conditions.
- An untargeted cultivation approach revealed Pseudogemmatithrix spongiicola gen. nov., sp. nov., and sheds light on the gemmatimonadotal mode of cell division: binary fission.