Precision vs. Recall in Bioinformatics
By Dr. Zubair Khalid, DVM, MS, PhD ·

Precision is the fraction of predictions a bioinformatics tool makes that are actually correct, while recall is the fraction of true biological features present in the data that the tool actually finds. Precision answers the question "when the tool reports a result, how often is it right?" and recall answers the question "of everything that is really there, how much did the tool recover?"
These two numbers sit at the center of nearly every benchmarking study in computational biology because almost every tool in the field makes a choice between them. A variant caller that reports only the variants it is certain about will have high precision and low recall. A metagenomic classifier that flags every possible species in a sample will have high recall and low precision. Neither tool is wrong. They are tuned for different costs of being wrong in each direction, and understanding which cost matters for your analysis is the core skill this article teaches. When you read a benchmark paper, a tool README, or a methods comparison, precision and recall are the vocabulary that turns marketing claims into measurable, comparable statements.
Precision and Recall, Explained from First Principles
Every prediction task in bioinformatics can be reduced to a set of calls: the tool says "yes, this variant is real," "yes, this peptide binds this HLA allele," "yes, this cell type is present," or "yes, this off-target site gets cut." To evaluate those calls you compare them against a ground truth, and four outcomes are possible.
- True positive (TP): the tool calls it and it is real.
- False positive (FP): the tool calls it and it is not real.
- False negative (FN): it is real and the tool missed it.
- True negative (TN): it is not real and the tool correctly said nothing.
From these counts, two ratios define the entire discussion.
Precision = TP / (TP + FP). If a variant caller reports 100 variants and 90 of them match the truth set, precision is 0.90. Precision is also called positive predictive value, and it is conditional on the tool's own output. Look only at what the tool gave you and ask how much of it you can trust.
Recall = TP / (TP + FN). If the truth set contains 200 real variants and the caller found 90 of them, recall is 0.45. Recall is also called sensitivity, and it is conditional on the truth. Look only at what was really there and ask how much the tool captured.
The two metrics are joined by a third, the F1 score, which is the harmonic mean of precision and recall: F1 = 2 × (precision × recall) / (precision + recall). The harmonic mean punishes imbalance. A tool with precision 0.95 and recall 0.10 gets an F1 near 0.18, which correctly signals that a highly precise tool that finds almost nothing is rarely useful. A tool with precision 0.80 and recall 0.80 gets F1 = 0.80, because balanced performance is rewarded.
A worked example with real numbers
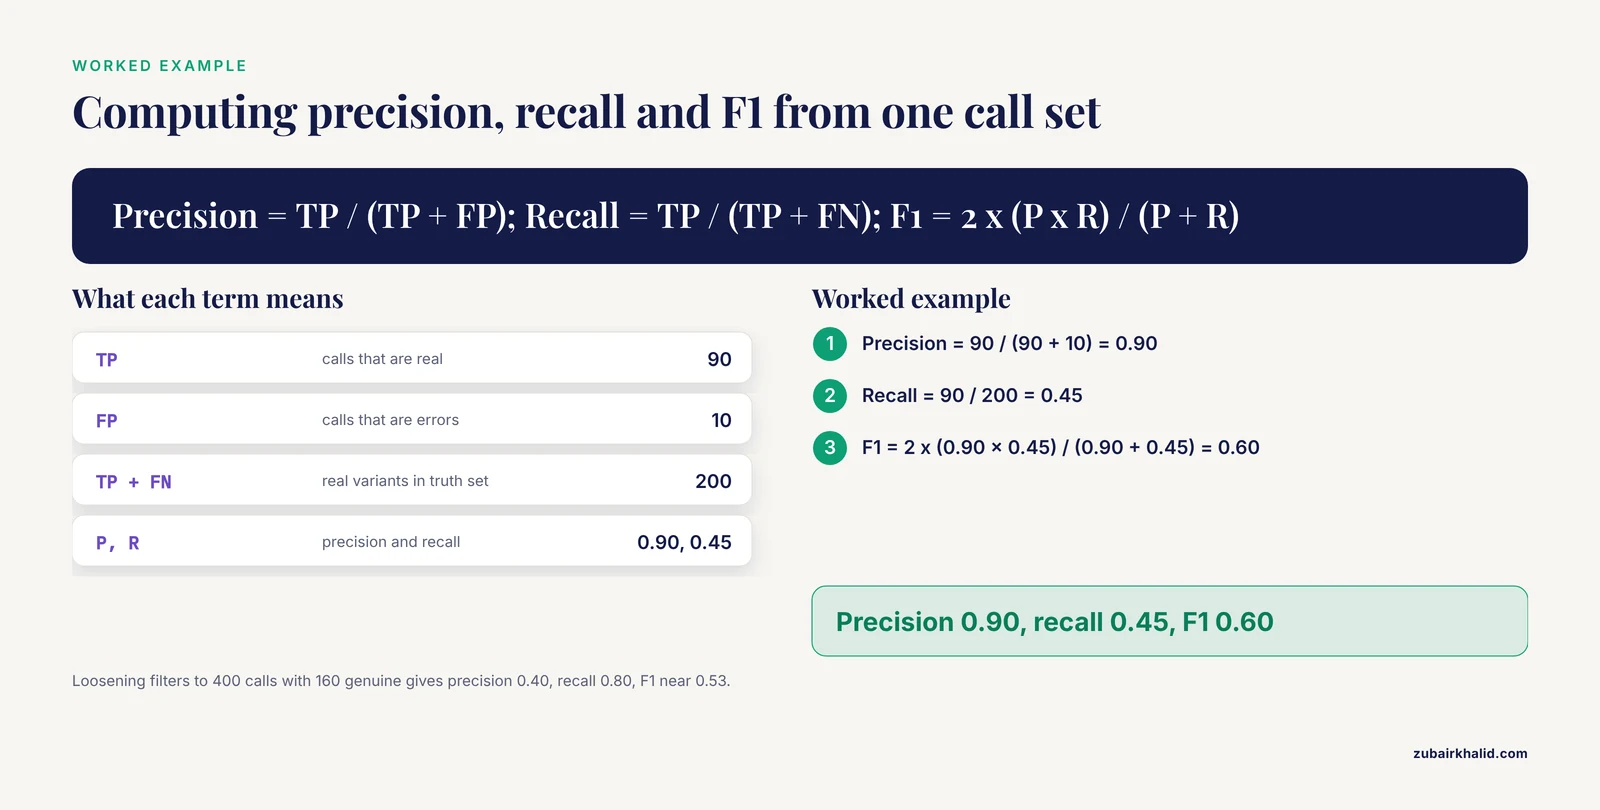
Suppose you run a variant caller against a reference sample with a known truth set of 200 genuine single nucleotide variants. The caller produces 100 variant calls. Comparison against the truth set shows 90 of those calls are genuine and 10 are errors.
- Precision = 90 / 100 = 0.90
- Recall = 90 / 200 = 0.45
- F1 = 2 × (0.90 × 0.45) / (0.90 + 0.45) = 0.60
The tool is trustworthy when it speaks but misses more than half of the truth. Now suppose you loosen the caller's filters so it emits 400 calls, of which 160 are genuine. Precision drops to 0.40, recall rises to 0.80, and F1 stays near 0.53. Nothing about the underlying data changed. You moved along a tradeoff curve, and that movement is the single most important concept in this article.
The precision-recall curve and AUPR
Most tools do not output a single yes-or-no answer. They output a score, a probability, or a rank. By sweeping a threshold across those scores you generate a series of precision-recall pairs, and plotting them produces the precision-recall curve (PRC). The area under that curve, abbreviated AUPR (or sometimes average precision), summarizes performance across all operating thresholds in one number that ranges from 0 to 1. In a benchmark of short-read taxonomic classifiers, Kraken2 achieved the best AUPR among the tools tested, while MetaPhlAn4 showed the highest precision when identifying species in simulated metagenomic samples [1]. The two findings are not contradictory. They describe different operating regions of different tradeoff curves.
Why Precision-Recall Curves Beat ROC Curves in Genomics
Students trained on machine learning coursework often reach first for the receiver operating characteristic (ROC) curve and its area (AUROC). In bioinformatics this habit causes systematic misjudgment, and the reason is class imbalance.
The ROC curve plots the true positive rate against the false positive rate, and the false positive rate is computed relative to the enormous number of true negatives. In a human genome with roughly 3 billion bases, the number of positions that are not disease-relevant variants is astronomical. Even a modest false positive rate spread across that many negatives yields thousands of false calls, which destroys precision. The PR curve, by contrast, conditions on the actual positives and the actual calls made, so it stays informative when true positives are rare relative to true negatives.
This is why benchmarking papers in genomics report AUPR or PR curves as their headline metric. The PredictONCO web tool for precision oncology, which uses an XGBoost-based predictor over protein structure and stability features, reported both AUROC values of 0.97 and 0.94 and average precision values from the precision-recall curve of 0.99 and 0.94 for structure-based and sequence-based predictions respectively [2]. Note the pattern: when positives are scarce, the average precision number is the more demanding and more honest of the two summaries.
A related metric appears in older text-mining benchmarks. Evaluation frameworks such as the BioCreative challenge series used the area under the interpolated precision curve to rank document classification systems, a direct ancestor of the AUPR convention used across bioinformatics today [3]. The vocabulary has standardized, and reading a modern benchmark means reading precision-recall language.
How Precision and Recall Are Actually Measured
You cannot compute precision or recall without a truth set, and obtaining one is the hard part of any evaluation. Benchmarks use three main strategies, and knowing which one a study used tells you how much to trust its numbers.
1. Curated reference truth sets. For human variant calling, the community standard is the Genome in a Bottle (GIAB) set of high-confidence variant calls for reference individuals such as NA12878 and NA24385. One evaluation of Oxford Nanopore variant callers used exactly these GIAB-backed samples to compare six calling tools, including Clair3, Clair, NanoCaller, Longshot, Medaka, and Human-SNP-wf, and expressed performance as precision, recall, and F1 computed with the hap.py comparison tool. Clair3, and Human-SNP-wf which incorporates Clair3, achieved the highest performance among the six [4]. The lesson for method selection is concrete: Clair3 is a defensible default for nanopore SNPs, and hap.py is the standard tool for producing the comparison metrics themselves.
2. Simulation. When no truth set exists, or when you need to control contamination levels and error rates precisely, you simulate reads from a known reference. A dedicated simulator called RRBSsim was built to benchmark methylation aligners for reduced representation bisulfite sequencing, because the simulator knows exactly where every read came from and can therefore count every false negative [5]. Simulation carries the risk that simulated errors differ from real instrument errors, so the strongest studies pair simulation with experimental validation.
3. Expert curation. For problems where even defining truth is difficult, such as clinical variant pathogenicity, benchmark studies assemble expert-reviewed case sets. An evaluation of ACMG/AMP-based variant classification tools used 151 expert-curated datasets from Mendelian disorders, then assessed top-N accuracy at N = 1, 5, 10, 20, and 50 alongside precision, recall, F1, and AUC, with statistical validation by bootstrap confidence intervals of n = 1000 and Friedman tests [6].
Precision vs. Recall Across Bioinformatics Domains
The tradeoff surfaces everywhere, but it takes a different shape in each subfield. The following sections walk through the domains where recent benchmarking literature gives concrete guidance.
Variant calling: the tradeoff is explicit
An analysis of variant calling tools in inbred mouse strains found a direct tradeoff between the recall and precision of different callers, driven partly by the fact that most tools assume outbred genomes with implicit heterozygosity, conditions that inbred laboratory models violate [7]. The study's central recommendation is one of the most practically useful ideas in this literature: an optimal variant call set can be obtained with an ensemble approach focused on the intersection of variants reported by multiple callers. Intersecting callers spends recall to buy precision. A variant that two independent algorithms agree on is far more likely to be real than a single-caller finding, so the intersection set has higher precision while retaining most variants that matter. The same study identified empirical filters that improve performance both for rare variant discovery and for identifying strain polymorphisms, underlining that caller choice and filter choice should vary by strain and analytical goal [7].
The tradeoff also depends on sequencing chemistry. Evaluations of Oxford Nanopore calling found Clair3 leading on precision, recall, and F1 against GIAB truth sets [4], and the broader point holds across platforms: callers tuned for one error profile do not transfer automatically to another.
Methylation mapping: recall fails first at the hard sites
Bisulfite sequencing reduces sequence complexity by converting unmethylated cytosines, which makes alignment itself harder and pushes errors into the calls. A comprehensive evaluation of seven mapping algorithms for reduced representation bisulfite sequencing data, using both real lung tumor RRBS data and RRBSsim simulations, found that methylation results were least consistent between tools at CpG sites with low sequencing depth, medium methylation levels, or locations on CpG island shores and gene bodies. Simulations showed that aligners generally had lower recall when detecting those vulnerable CpG sites and lower precision when estimating their methylation levels [5]. Among the tools tested, bwa-meth and BS-Seeker2 with the bowtie2 backend were the preferred aligners in terms of recall, precision, and speed [5].
The pattern generalizes. Recall and precision degrade first at the difficult edge cases, which in methylation means low-coverage and borderline sites, in variant calling means repetitive and paralogous regions, and in classification means taxonomically ambiguous reads. When you read a benchmark, look for where performance breaks down, not just the headline average.
Alignment tool choice even propagates into downstream quantitative conclusions. A forensic study of an epigenetic clock aligned the same bisulfite data with four aligners, Bwa-meth, Abismal, Bismark, and BS-Seeker2, testing up to six settings per tool and assessing read depth, precision, recall, F1 score, and alignment run time, with the goal of determining whether predicted chronological ages differed considerably between tools [8]. When the final biological output is a number such as an age estimate, alignment-level precision and recall become upstream determinants of the end result.
Metagenomic classification: precision depends on the classifier's philosophy
Taxonomic classifiers fall into families with built-in precision-recall personalities. Marker-gene-based tools restrict their search to a curated set of clade-specific markers, which raises precision because ambiguous reads have nowhere to go. k-mer-based tools classify every read against a broad database, which raises recall but admits more false assignments. A performance analysis of MetaPhlAn4, Centrifuge, Kraken2, and Bracken on synthetic and real samples captured exactly this: MetaPhlAn4 exhibited high precision on the simulated dataset, Kraken2 had the best AUPR, and Centrifuge, Kraken2, and Bracken estimated species abundances more accurately than MetaPhlAn4, which showed a higher L2 distance from the truth [1]. On real inflammatory bowel disease samples, MetaPhlAn4 and Kraken2 had faster execution times, and performance differences appeared between family-level and species-level classification [1].
For precision recall interpretation in metagenomics, the practical reading is this. If your question is "which species are truly present, and I cannot tolerate false attributions," weight precision and lean toward marker-based approaches. If your question is "find everything plausibly here, including low-abundance organisms," weight recall and accept that you will validate candidates downstream.
Single-cell genomics: precision in estimating contamination, not just calling
The vocabulary extends beyond binary calls. Ambient RNA, the RNA released from damaged cells that gets captured alongside RNA from intact cells, produces spurious expression signals that distort cell identification. A systematic benchmark of seven ambient RNA decontamination tools on simulated and experimental datasets from diverse tissues and species evaluated accuracy in estimating contamination levels, robustness across conditions, and sensitivity to subtype-specific contamination [9]. The results map directly onto the precision-recall frame. DecontX provided the most accurate contamination-level estimation, scAR was the most robust across conditions but tended to overestimate contamination, and CellClear performed best for resolving closely related cell subtypes [9].
Overestimating contamination is a recall-precision error in disguise. A tool that flags too much RNA as ambient will strip genuine signal from real cells, which is a loss of precision in the cleaned expression matrix. The benchmark's conclusion, that tools have distinct strengths and methods must be matched to data characteristics and research goals, is the recurring lesson of every domain in this article [9].
Immunoinformatics: thresholds are the operating point
Peptide-HLA binding prediction, central to vaccine design and immunotherapy, illustrates how the tradeoff becomes a design choice. A comprehensive evaluation of 17 HLA-I peptide binding prediction models on a curated dataset of over 290,000 peptides spanning 44 HLA-I alleles assessed accuracy, robustness, and interpretability using explainability techniques such as SHAP and LIME [10]. Self-attention-based models including STMHCpan and BigMHC showed superior accuracy, the capsule network model CapsNet-MHC_AN demonstrated robust performance, and models trained on eluted ligand datasets outperformed those relying on binding affinity data, a finding that assigns much of the performance ceiling to training data quality rather than model architecture [10]. For the user, the threshold you apply to a binding predictor's score is your operating point on its precision-recall curve. Vaccine candidate screening, where each experimental validation is expensive, rewards precision. Prioritizing a ranked list of neoantigens for a pipeline that will test many candidates rewards recall at the top of the list, because you want true binders concentrated in the first ranks even if the tail contains noise.
Genome editing safety: recall among top-ranked sites is the metric that matters
CRISPR-Cas9 off-target prediction is a domain where recall has a safety interpretation. A systematic benchmarking of 14 in silico off-target prediction tools, both standard approaches and machine-learning models, used a curated dataset of 3,827 deep-sequenced genomic sites across 26 guide RNA and Cas9 combinations in human cells, with true off-targets operationally defined as sites with indel frequencies of at least 0.1% [11]. The evaluation used score distributions, correlation with indel frequencies, precision-recall characteristics, and recall among top-ranked candidate sites. All tools assigned higher scores to true off-target sites than to nontarget sites, but substantial overlap between the classes remained, correlation between prediction scores and measured indel frequencies was weak to moderate, and precision-recall performance was moderate across all tools [11].
The preclinical implication is asymmetric. For a therapy intended for human use, a missed off-target site is a safety event, so recall dominates. The study found that recall increased with the number of predicted candidate sites examined, meaning that the standard practice of widening the search window and validating more candidates computationally and experimentally is the correct response to the precision-recall tradeoff in this setting [11].
Clinical interpretation: precision and recall join rank-aware metrics
In clinical variant interpretation, a raw precision-recall pair misses something practitioners care about, namely whether the right answer appears near the top of a ranked list. The benchmark of four ACMG/AMP-based tools (Franklin, InterVar, TAPES, Genebe) against LIRICAL, a phenotype-driven comparator, reported top-N accuracy at several depths alongside precision, recall, F1, and AUC. LIRICAL achieved 68.21% and Franklin 61.59% top-10 variant prioritization accuracy across 151 expert-curated Mendelian datasets, significantly outperforming the other tools, and tools with advanced phenotypic integration outperformed those relying primarily on molecular data alone [6]. For precision recall bioinformatics tools interpretation in the clinical setting, this teaches a structural lesson. Metrics must match the decision workflow. A clinician reviewing a ranked list reads the top entries first, so top-10 accuracy is a form of precision-at-depth, and a tool with a marginally better raw F1 but worse top-10 ranking is the worse tool for that job.
An analogous rank-aware view appears in retrieval-style evaluations of clinical decision support agents. A comparison of four LLM-based architectures in precision oncology, including a standalone LLM, an unconstrained function-calling agent, a ReAct agent, and a workflow-orchestrated agent restricted to 20 curated domain tools, evaluated 375 clinician-authored questions across 41 cancer cases with rubric scoring and expert adjudication. The workflow-orchestrated agent achieved the highest embedding recall under both a biomedical retrieval model (MedCPT, R = 0.877) and a general-purpose model (Snowflake Arctic, R = 0.803), significantly exceeding the unconstrained alternatives [12]. In retrieval contexts, "recall" means recall of relevant reference content, and constraint plus curation beat breadth, a conclusion that echoes the ensemble and curated-truth-set themes of the rest of this article.
Summary Table: Precision, Recall, and Their Neighbors
| Term | Definition | Question it answers | Common confusion |
|---|---|---|---|
| Precision | TP / (TP + FP) | Of my calls, how many are right? | Often confused with accuracy, which includes true negatives |
| Recall (sensitivity) | TP / (TP + FN) | Of all real features, how many did I find? | Often confused with specificity, which is about true negatives |
| F1 score | Harmonic mean of precision and recall | Are both metrics balanced? | Arithmetic mean would not punish imbalance the same way |
| AUPR / average precision | Area under the precision-recall curve | How does the tradeoff behave across all thresholds? | Not interchangeable with AUROC under class imbalance |
| AUROC | Area under the ROC curve | How does the true positive rate trade against the false positive rate? | Overly optimistic when true negatives vastly outnumber true positives |
| Specificity | TN / (TN + FP) | Of all negatives, how many did I correctly reject? | High specificity does not imply high precision when positives are rare |
| Top-N accuracy | Fraction of cases where the truth appears in the top N ranked results | Is the right answer where a human reviewer will see it? | A tool can have modest raw recall and still be clinically useful |
How to Read a Benchmark Report Step by Step
When you pick up a benchmarking paper or compare candidate software, a disciplined reading sequence extracts the numbers that matter and discards the noise.
- Identify the truth set. Ask what defines "correct." GIAB high-confidence calls [4], simulated reads with known origins [5], or expert-curated clinical cases [6] each carry different caveats.
- Check class balance. If positives are rare relative to the search space, AUPR and precision at fixed recall are the numbers to trust, and AUROC will flatter every tool.
- Locate the operating point. A single precision-recall pair corresponds to one threshold. Ask whether the study's chosen threshold matches your intended use.
- Look at where performance degrades. Benchmarks that report performance stratified by difficulty reveal failure modes. Methylation aligners lose recall at low-depth CpG sites [5], and off-target predictors show class overlap that no tool escapes [11].
- Check robustness across conditions. A tool that wins on one dataset but collapses on another has memorized a data regime rather than learned the problem. Robustness across biological and technical conditions was an explicit axis in the ambient RNA benchmark [9].
- Consider ensembles. Where single tools trade precision against recall, intersections or combinations of tools can dominate either extreme, as shown for mouse variant calling [7] and for HLA prediction, where ensemble and multi-algorithm approaches improved reliability [10].
- Match the metric to the decision. Ranked-list workflows deserve top-N metrics [6], safety workflows deserve recall-first framing [11], and discovery workflows deserve AUPR.
Bioinformatics Tools Comparison: What Recent Benchmarks Show
A compressed view of the benchmark evidence discussed above, useful when you weigh candidate software for a new project.
| Domain | Tools compared | Headline finding | Source |
|---|---|---|---|
| Ambient RNA removal (single-cell) | Seven tools including DecontX, scAR, CellClear | Distinct strengths. DecontX best for contamination estimation, scAR most robust but overestimates, CellClear best for close subtypes | [9] |
| Nanopore variant calling | Clair3, Clair, NanoCaller, Longshot, Medaka, Human-SNP-wf | Clair3 and Human-SNP-wf highest precision, recall, and F1 against GIAB truth | [4] |
| Mouse variant calling | Multiple widely used callers | Explicit recall-precision tradeoff, ensemble intersection recommended | [7] |
| RRBS methylation alignment | Seven aligners including bwa-meth, BS-Seeker2, Bismark | bwa-meth and BS-Seeker2 (bowtie2) preferred for recall, precision, and speed | [5] |
| Forensic methylation alignment | Bwa-meth, Abismal, Bismark, BS-Seeker2 | Precision, recall, F1, and runtime assessed across settings to test age-prediction stability | [8] |
| Metagenomic profiling | MetaPhlAn4, Centrifuge, Kraken2, Bracken | MetaPhlAn4 highest precision on simulated data, Kraken2 best AUPR, three tools better at abundance estimation | [1] |
| HLA-I binding prediction | 17 models including STMHCpan, BigMHC, CapsNet-MHC_AN | Self-attention models superior, eluted-ligand training data outperforms affinity data, ensembles help | [10] |
| CRISPR off-target prediction | 14 in silico tools | Moderate precision-recall performance across all tools, weak-to-moderate correlation with editing frequency, recall rises with more candidates examined | [11] |
| Clinical variant classification | Franklin, InterVar, TAPES, Genebe, LIRICAL | LIRICAL 68.21% and Franklin 61.59% top-10 accuracy, phenotype integration decisive | [6] |
| Oncology variant impact | PredictONCO (XGBoost) | AUROC 0.97 and 0.94, average precision 0.99 and 0.94 for structure- and sequence-based modes | [2] |
| Clinical decision agents | Standalone LLM, unconstrained agent, ReAct agent, workflow-orchestrated agent | Orchestrated agent with curated tools highest embedding recall (R = 0.877 MedCPT) and best rubric scores | [12] |
| Text mining (BioCreative III) | NER and dictionary tools with linear classifier | Area under interpolated precision used to rank article classification systems | [3] |
Two patterns emerge from this table and they generalize. First, no tool wins everywhere, and the winning tool is the one whose operating characteristics match the data regime and the decision at hand. Second, the performance ceiling is often set by data quality rather than algorithm design, whether that is eluted ligand datasets for HLA prediction [10], curated deep-sequenced off-target sites [11], or expert-curated Mendelian cases [6].
Choosing the Best Bioinformatics Software for Your Precision and Recall Needs
The keyword question behind most searches on this topic is practical: given several candidate tools, which is the best bioinformatics software for my task? Precision and recall give you a disciplined way to answer it rather than relying on citation counts or tool popularity.
Start from the cost of each error type in your specific workflow. A clinical diagnostic report that will change patient management should be precision-heavy, because a false call triggers cascading consequences, while a discovery screen feeding an experimental validation pipeline should be recall-heavy, because missed candidates are unrecoverable and false candidates get filtered by the assay. CRISPR safety assessment is the clearest recall-dominant case in the current literature [11]. Variant classification for Mendelian disease is a case where ranking quality sits between the two [6].
Prefer tools with published, reproducible benchmarks on data resembling yours. A benchmark on simulated mouse genomes does not automatically transfer to your outbred population sample [7]. A metagenomic result on simulated communities does not automatically transfer to a real gut sample with uneven abundances [1]. Look for evaluation on data matched to your tissue, platform, and difficulty profile.
Budget for validation rather than trusting a single number. Every headline precision or recall figure is conditional on the truth set used. Building a small internal truth set, even a few dozen curated examples from your own data, converts published numbers into directly comparable local numbers.
Use ensembles deliberately. The intersection strategy for variant calls [7] and multi-algorithm ensembles for HLA prediction [10] are the same idea in two fields. Agreement between independent methods is one of the few reliable ways to raise precision without giving up proportional recall.
Record your operating point. Write down the thresholds, filters, and tool versions you used. Reproducibility in bioinformatics is largely the practice of pinning the position on the tradeoff curve that produced your results.
Common Mistakes and Limitations
- Treating precision and recall as single fixed properties of a tool. They are properties of a tool at a threshold on a dataset. Loosening filters changes them, and the underlying data can change them further. Any claim of a tool's precision without a stated threshold and dataset is incomplete.
- Reading AUROC as if it were AUPR. Under heavy class imbalance, which is the norm in genomics, AUROC can look excellent while precision at practical recall levels is poor. The off-target benchmark showed moderate precision-recall performance across all 14 tools even though every tool separated true off-targets from nontargets in its score distribution [11].
- Confusing precision with accuracy. Accuracy counts true negatives in the denominator and therefore inflates on imbalanced problems. A classifier that labels everything negative in a dataset with 1% positives achieves 99% accuracy, zero recall, and undefined-or-zero precision. Precision is the metric that reflects what a call is worth.
- Ignoring the truth set's own limitations. GIAB truth sets, simulated reads, and expert curation each contain systematic biases. Metrics computed against an imperfect truth set are estimates with the truth set's errors folded in.
- Assuming benchmark rankings transfer. A tool that wins on one tissue, species, platform, or difficulty stratum can lose on another. The ambient RNA benchmark explicitly showed distinct strengths across tissues, species, and contamination regimes [9].
- Optimizing F1 blindly. F1 assumes precision and recall matter equally. In clinical and safety contexts they almost never do, and the correct weighting is a domain decision, not a default.
- Forgetting that downstream analyses amplify upstream errors. False positives in an alignment propagate into methylation estimates and then into downstream quantities such as epigenetic age predictions [8]. The precision of a pipeline is bounded by its weakest step, not its average step.
- Reporting one metric in isolation. A precision figure without recall, or a recall figure without precision, is uninterpretable, because for any tool you can trivially raise one by collapsing the other. Always demand the pair, the curve, or the area under it.
A final limitation applies to the benchmarks themselves. Simulation-based studies, including the RRBS and mouse genome analyses, inherit whatever mismatches exist between their simulators and real instruments or real populations [7], [5]. Treat simulated-data rankings as hypotheses to confirm on your own data.
Quick Review
- Precision = TP / (TP + FP). It measures the trustworthiness of the calls a tool actually makes.
- Recall = TP / (TP + FN). It measures how much of the real biology the tool recovered.
- F1, the harmonic mean, punishes imbalance between the two metrics, and it punishes hard.
- Precision-recall curves and AUPR are preferred over ROC curves in genomics because class imbalance makes false positive rates misleading.
- Every precision and recall value is conditional on a threshold, a truth set, and a dataset. None of the three is optional context.
- Ensembles and intersections of multiple tools are a practical strategy for raising precision without proportional recall loss, validated in variant calling and HLA prediction.
- Match the metric to the decision. Ranked clinical lists deserve top-N accuracy, safety assessments deserve recall-first framing, and discovery screens deserve AUPR.
Frequently Asked Questions
What does precision recall bioinformatics tools mean?
It refers to evaluating computational biology software by two complementary error rates. Precision measures what fraction of the tool's reported results are correct, and recall measures what fraction of the true results in the data the tool found. Benchmarking papers report both, or the area under the precision-recall curve, precisely because neither number alone describes a tool's performance.
Which should I prioritize, precision or recall?
It depends entirely on the cost of each error type in your workflow. Prioritize precision when a false call triggers expensive or harmful downstream action, such as clinical reporting. Prioritize recall when a missed true feature is unrecoverable, such as off-target safety screening for genome editing therapies.
Why are precision-recall curves preferred over ROC curves in genomics?
Because genomics problems are usually heavily imbalanced, with true positives rare against an enormous background of true negatives. The ROC false positive rate is computed against that huge negative pool, which makes ROC curves look deceptively good, while the precision-recall curve conditions on the actual calls and actual positives and stays informative.
What is a good F1 score for a bioinformatics tool?
There is no universal threshold, because a good F1 depends on how difficult the task is and how noisy the truth set is. A score that would be excellent for CRISPR off-target prediction, where all 14 benchmarked tools showed only moderate precision-recall performance, could be mediocre for a simpler classification problem. Always compare against the benchmarks for your specific task and data type.
How do benchmarking studies actually measure precision and recall?
They compare tool output against a ground truth, which comes from curated reference sets such as Genome in a Bottle samples, purpose-built simulators where every read's origin is known, or expert-reviewed case collections. Comparison tools such as hap.py compute the matching statistics, and strong studies add confidence intervals and statistical tests to confirm that differences between tools are real.
Can I improve precision and recall at the same time?
Yes, but rarely by turning a single knob, since adjusting one tool's threshold moves you along its tradeoff curve. The reliable strategies are ensemble approaches that combine independent tools, better training or truth data, which several benchmarks identified as the true performance ceiling, and matching the tool to your data characteristics rather than forcing a mismatched tool to work.
Sources
- Analyzing the performance of short-read classification tools on metagenomic samples toward proper diagnosis of diseases.
- Analysis of mutations in precision oncology using the automated, accurate, and user-friendly web tool PredictONCO.
- A linear classifier based on entity recognition tools and a statistical approach to method extraction in the protein-protein interaction literature.
- Evaluation of the Available Variant Calling Tools for Oxford Nanopore Sequencing in Breast Cancer.
- A comprehensive evaluation of alignment software for reduced representation bisulfite sequencing data.
- Comprehensive evaluation of ACMG/AMP-based variant classification tools.
- Benchmarking genomic variant calling tools in inbred mouse strains: recommendations and considerations.
- Assessing the influence of different alignment tools on the accuracy of a forensic epigenetic clock.
- Systematic benchmarking of ambient RNA decontamination tools to advance precision in single-cell transcriptomic analysis.
- Comprehensive Evaluation and Explainable Interpretation of Peptide-HLA Binding Prediction Tools.
- Systematic Benchmarking of CRISPR-Cas9 Off-Target Prediction Tools Reveals Limitations and Implications for Preclinical Assessment.
- Optimizing genomics-aware clinical agents in precision oncology.