Open Source Bioinformatics Community Health: A Guide
By Dr. Zubair Khalid, DVM, MS, PhD ·

By the end of this guide you will be able to audit the health of an open source bioinformatics project before you build a pipeline on it, compare tools using published benchmark evidence instead of reputation, choose software that fits your problem and your team's skills, and contribute back in ways that keep the ecosystem alive. You will run real commands against real repositories, interpret the outputs, and learn where most people go wrong.
To follow the walkthrough you need a computer with git, curl, and jq installed, Python 3.10 or newer with the mamba or conda package manager, and optionally a container runtime such as Docker or Apptainer. All of these are free. You also need a GitHub account if you want to file issues or open pull requests later in the process.
What Open Source Bioinformatics Community Health Means
Community health describes a project's capacity to keep producing reliable releases, answer user questions, accept outside contributions, and survive the departure of any single maintainer. It is a property of the people and processes around the code, not of the code itself. A brilliant algorithm wrapped in an abandoned repository is a liability. A modest tool with responsive maintainers, clear documentation, and steady releases is an asset you can build a thesis or a clinical workflow on.
Several signals indicate community health:
- Release cadence. Regular tagged releases show that someone is curating the code into usable snapshots.
- Issue responsiveness. Bug reports and questions that receive replies within days, not years.
- Contributor breadth. More than one or two active contributors, which reduces bus-factor risk.
- Documentation quality. A README that gets a new user to a first successful run, plus reference documentation and worked examples.
- Tests and continuous integration. Automated checks that catch breakage before users do.
- Licensing clarity. A LICENSE file that tells you exactly what you may do with the code.
- Citation infrastructure. A CITATION.cff file or similar, so users can credit the work correctly.
- Archival. A frozen snapshot with a persistent identifier, so a paper's claims remain checkable years later.
Real projects in the bioinformatics literature show these signals in action. Nextstrain provides continually updated real-time genomic surveillance for 21 viruses and Mycobacterium tuberculosis, with most analyses running daily on open sequence data, all source code available on GitHub, and a snapshot archived at Zenodo with a persistent identifier [1]. Cytoflow, a Python tool for computational flow cytometry, explicitly credits feedback from an active user community as a driver of ongoing development [2]. The Swedish COVID-19 Data Portal published open-source code that twelve national portals then adapted for local data sharing, a direct demonstration of how healthy open code multiplies through reuse [3]. OpenDVP, a framework for deep visual proteomics, was built from the start inside a community-driven ecosystem combining established open-source image analysis tools with community standard data formats [4].
Why Community Health Affects Your Scientific Results
Community health is not an abstract virtue. It changes the numbers you publish.
Consider the evidence from head-to-head evaluations. In untargeted GC-Orbitrap-HRMS metabolomics for food authentication, the open-source MS-DIAL software putatively annotated 115 compounds at Level 2 identification confidence, while the commercial Compound Discoverer annotated 52, in a study comparing the two on thyme geographical differentiation [5]. In 16S rRNA gene amplicon analysis on the Ion Torrent platform, eight open-source pipelines built on QIIME2 and the SILVA database were benchmarked against the proprietary Ion Reporter software, and at the species level single-hypervariable-region open-source pipelines significantly outperformed the proprietary workflows [6]. In drug discovery benchmarking, the ct-validation Python package showed that a single curated open clinical trial source reproduced the signal of a proprietary comparator, with relative success values of 2.92 versus 2.65, while naively aggregating open registries compressed that signal to 1.52 [7].
Three lessons follow. First, open source tools are competitive with, and sometimes better than, commercial alternatives when they are actively developed and properly configured. Second, the configuration matters as much as the tool, because in the 16S study the choice of denoising algorithm, DADA2 versus Deblur, significantly affected alpha diversity calculations across all configurations [6]. Third, open communities produce the benchmarking frameworks themselves, which means the evidence you use for a bioinformatics tools comparison increasingly comes from the same healthy communities whose tools you are evaluating.
There is also a maintenance dimension. A tool behind a responsive community gets bug fixes when sequencer formats change, when dependency libraries break, or when reference databases update. An abandoned tool fails silently. Silent failure is the worst outcome in bioinformatics, because your pipeline still produces output, and that output is simply wrong.
Auditing Community Health Step by Step
This walkthrough audits a real project, MultiVirusConsensus, an open-source pipeline for identification and consensus sequence generation of multiple viruses from mixed samples such as wastewater, hosted at github.com/niemasd/MultiVirusConsensus [8]. The same procedure works for any project hosted on GitHub, GitLab, or a similar forge. Output values shown below are illustrative. Your numbers will differ. The shape of the output is what matters.
Step 1. Clone the repository and inventory its contents
git clone https://github.com/niemasd/MultiVirusConsensus.git
cd MultiVirusConsensus
ls -la
Expected output looks like this:
drwxr-xr-x  .git
-rw-r--r--  LICENSE
-rw-r--r--  README.md
-rw-r--r--  MultiVirusConsensus.py
...
You are looking for four files. A README that explains installation and a minimal run. A LICENSE with a named license. A CITATION.cff or similar file that tells you how to cite the tool. A requirements file, environment file, or container definition that pins dependencies. Missing README or LICENSE files are immediate red flags.
Step 2. Read the license before you plan anything
head -n 5 LICENSEExpected output:
MIT License

Copyright (c) 2024 ...
The license determines what you may legally do. Permissive licenses such as MIT and BSD allow most academic and commercial reuse with attribution. Copyleft licenses such as GPL require derivative works to carry the same license, which matters if you are wrapping the tool in a product. Free availability is not the same as open licensing. LIGSIFT, a ligand structural alignment and virtual screening tool, is freely available to academic users but with restrictions that make it not fully open source, which is a different model with different obligations [9]. If your use case is commercial or clinical, an academic-only license can block you late in a project.
Step 3. Check activity signals through the API
curl -s https://api.github.com/repos/niemasd/MultiVirusConsensus \
  | jq '{stars: .stargazers_count,
         forks: .forks_count,
         open_issues: .open_issues_count,
         license: .license.spdx_id,
         pushed_at: .pushed_at,
         archived: .archived}'
Expected output:
{
  "stars": 9,
  "forks": 3,
  "open_issues": 1,
  "license": "MIT",
  "pushed_at": "2026-10-14T18:22:05Z",
  "archived": false
}
Interpret each field. pushed_at within the last six months suggests live maintenance. archived: true means the maintainer has explicitly frozen the project, which is honest but means no fixes are coming. Stars measure attention, not health. A specialized viral genomics tool with 9 stars and monthly commits is healthier for your purposes than a hyped tool with 2,000 stars and no commits in two years. Small numbers are normal for domain tools, and the MultiVirusConsensus repository is a case where recent publication and active development matter more than popularity [8].
Step 4. Measure commit recency and contributor breadth
curl -s "https://api.github.com/repos/nextstrain/ncov/commits?per_page=5" \
  | jq '.[] | [.commit.author.date, .commit.author.name]'
Expected output:
[
  "2026-11-08T14:31:22Z",
  "Jane Doe",
]
...
Then count distinct contributors over the last year:
curl -s "https://api.github.com/repos/OWNER/REPO/contributors?per_page=20" \
  | jq '. | length'
A single contributor is common in bioinformatics, where one lab member often builds a tool alone, but it concentrates risk. A project with three or more contributors merging changes in the past year is more resilient. Nextstrain's pathogen analyses, maintained by a distributed team across multiple institutions, illustrate what a well-resourced community project looks like [1].
Step 5. Inspect issue tracker responsiveness
curl -s "https://api.github.com/repos/OWNER/REPO/issues?state=all&per_page=100" \
  | jq '[.[] | select(.pull_request == null)] | length'
This counts real issues, excluding pull requests. Then open the issue tracker in a browser and read the last ten closed issues. You are judging two things. Whether maintainers respond at all, and whether responses are substantive. An issue that sat unanswered for fourteen months tells you how your own bug report will be treated. A project like Cytoflow, where user feedback visibly shapes the development roadmap, shows the opposite pattern [2].
Step 6. Test the install on a throwaway machine
mamba create -n audit -c conda-forge -c bioconda python=3.11
mamba activate audit
Follow the project README exactly, from a clean environment. Many bioinformatics tools distribute through Bioconda, PyPI, or container registries. Package names vary by project, so trust the README over memory. If the documented install command fails, that is a finding. File an issue with the full error text and your operating system. A healthy community treats your failed install as valuable bug data.
Note that MultiVirusConsensus is designed to pipe datastreams between tools without writing intermediate files, which eliminates slowdowns from slow disk access, so its performance depends on the versions of the tools it wraps. This is exactly the kind of dependency sensitivity that version pinning addresses.
Step 7. Run the tool on built-in or public test data
Never adopt a tool based on its paper alone. Run it. The methylation sequencing workflow in Current Protocols chains FastQC for per-sample quality control with MultiQC to aggregate results, giving a concrete model of a first run [10]:
fastqc *.fastq.gz -o qc/
multiqc qc/ -o multiqc_report
Expected output is a terminal summary followed by a single multiqc_report.html file aggregating per-sample metrics such as per-base quality scores and adapter content. Open that file. If the tool you are auditing produces plots, tables, or log summaries, verify that the numbers in the output match a small case you can check by hand. If there is no test data at all, that is a documentation failure and a health signal.
Step 8. Check for version pinning and archival
Look for a CITATION.cff file and release tags:
curl -s https://api.github.com/repos/OWNER/REPO/releases \
  | jq '.[].tag_name'
Expected output:
"v1.0.2"
"v1.0.1"
"v1.0.0"
Semantic version tags let you record exactly which code produced your results. Archival matters for the field, not just for you. Nextstrain archives snapshots of its analyses at Zenodo with persistent identifiers, which means any figure in any paper built on Nextstrain can be traced to a frozen, retrievable state [1]. When you write your methods section, cite the specific version, not just the paper.
Step 9. Benchmark against a reference standard
For any tool you intend to publish with, run it on a reference material where the right answer is known. The 16S evaluation discussed above benchmarked eight open-source pipelines against a commercial human fecal reference material characterized by shotgun sequencing, using the known composition as ground truth [6]. In virtual screening, LIGSIFT was evaluated against 40 protein targets from the Directory of Useful Decoys using the area under the ROC curve, the enrichment factor, and the hit rate, reporting an average AUC of 0.79, an average enrichment factor of 20.8, and a hit rate of 59 percent in the top 1 percent of the screened library [9]. Those three metrics have standard definitions. AUC measures ranking quality across all thresholds, the enrichment factor measures how much more often actives appear near the top of the ranked list than chance would predict, and the hit rate measures the fraction of true actives in the top slice of the list. Reproducing a published metric on a published benchmark before trusting a tool on your own data is the single highest-value hour you can spend in tool evaluation.
Step 10. Record your audit
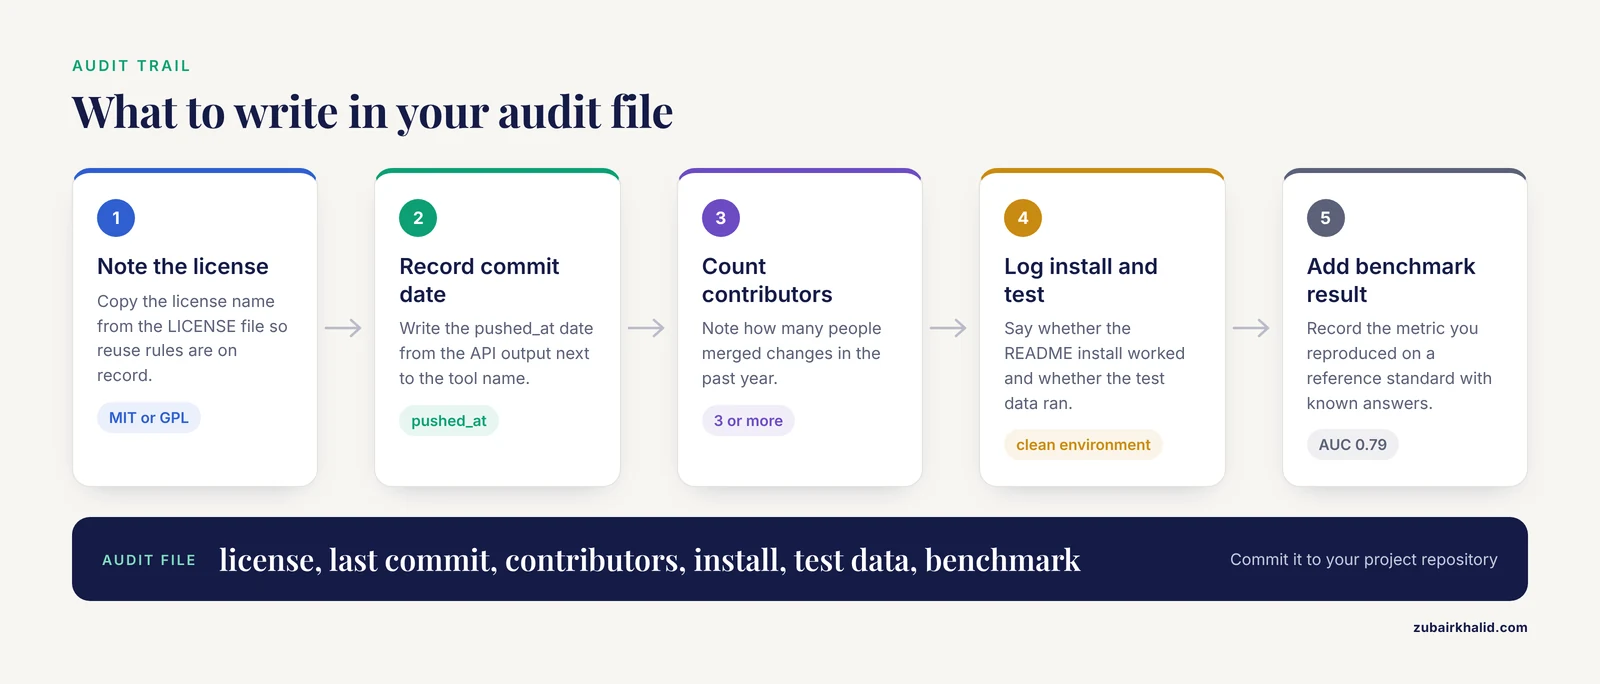
Write a short markdown file per tool covering license, last commit date, contributor count, install success, test data result, and benchmark result. Commit it to your project repository. Six months later, when a collaborator asks why you chose one aligner over another, you will have the answer with dates attached.
Community Health Tips That Work in Practice
These tips compress the audit into habits you can apply continuously.
Prefer tools with staged quality control. The best-documented workflows build checkpoints into every stage. The targeted methylation sequencing protocol cited above runs preprocessing with Trim Galore and FastQC/MultiQC, then methylation calling with BWA-meth, Picard duplicate marking, and MethylDackel, then a structured third stage in R for beta-value calculation and differential methylation with methylKit, with explicit reporting of intermediate outputs at each boundary [10]. A tool whose community documents checkpoints is a tool whose community has debugged real failures.
Learn from educational resources built by communities. Metabonaut, an open educational resource for reproducible script-based untargeted LC-MS/MS metabolomics, teaches FAIR practice extended from data to analysis and software, with executable vignettes running from raw mzML files to annotated feature tables on the R for Mass Spectrometry and Bioconductor ecosystem [11]. Studying such a resource shows you what a healthy analysis workflow looks like before you have to build one.
Favor interoperable tools over walled gardens. The ICEES, ROBOKOP, and CAM Knowledge Provider applications were developed as a suite with interoperability as a design goal, queryable through a common endpoint or independently, which let the authors chain clinical exposure data, knowledge graph reasoning, and causal inference in one asthma use case [12]. Tools that adopt community standard formats, such as the AnnData and SpatialData formats used by OpenDVP for multiomics integration [4], plug into pipelines you have not built yet.
Read the paper and the repository. The paper tells you what the tool did in the authors' hands. The repository tells you what it will do in yours. In the metabolomics comparison, both MS-DIAL and Compound Discoverer required careful manual assessment of unknown metabolites, background signals, and duplicate features before multivariate analysis, which no marketing page mentions but every user manual should [5].
Pin everything. Record software versions, container digests, database versions, and parameter values. The reproducibility crisis in computational biology is mostly a versioning crisis.
Report problems upstream. A minimal reproducible example with your command, versions, and full error output is the single most useful contribution most users can make.
Bioinformatics Tools Comparison: Reading the Evidence
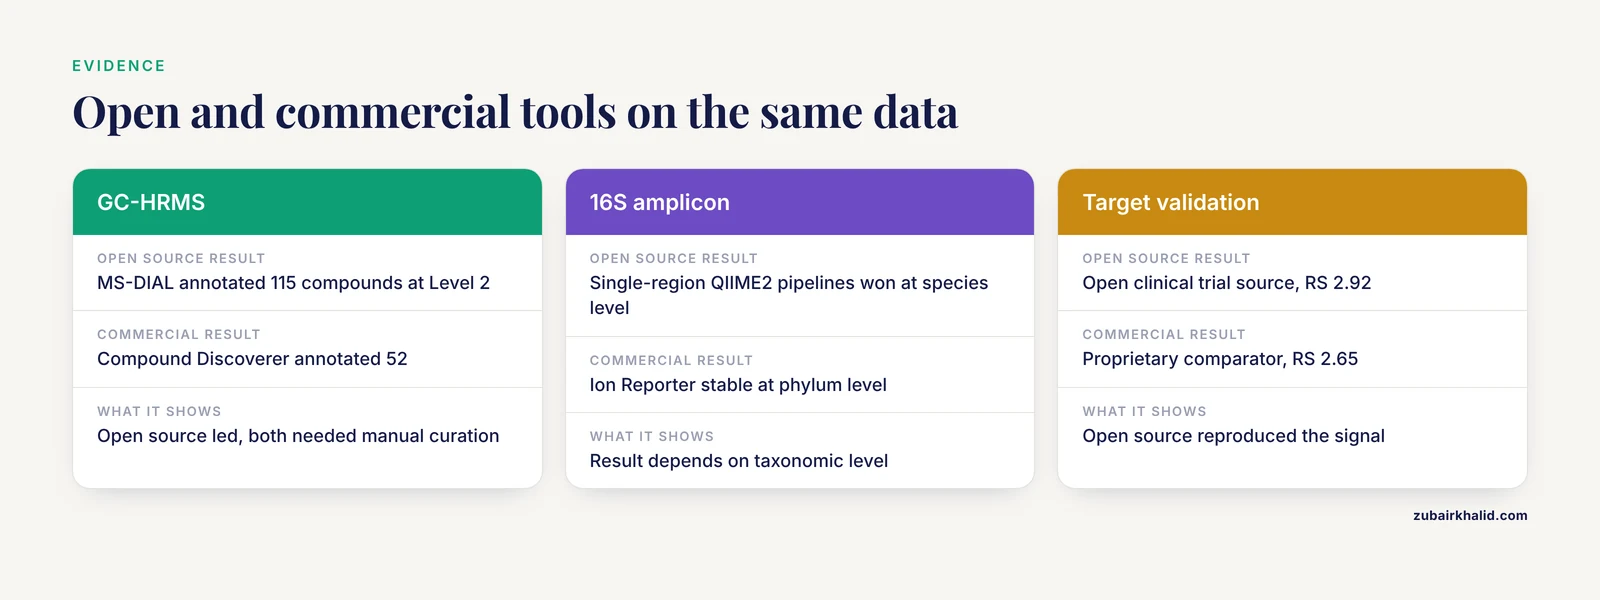
A defensible bioinformatics tools comparison has three components: identical input data, a reference standard or ground truth, and pre-declared metrics. Published comparisons in the literature show what this looks like across domains.
| Domain | Tools compared | Key finding | Lesson for your audit |
|---|---|---|---|
| GC-HRMS metabolomics | MS-DIAL vs Compound Discoverer | MS-DIAL annotated 115 compounds at Level 2, Compound Discoverer 52 [5] | Open source can lead, but both needed manual curation of unknowns and duplicates |
| 16S amplicon microbiomics | Eight QIIME2-based open pipelines vs Ion Reporter | Single-hypervariable-region open pipelines outperformed the proprietary workflow at species level [6] | Pipeline configuration, especially the denoiser, changes diversity results |
| Virtual screening | LIGSIFT vs decoy-set benchmarks | Average AUC 0.79, enrichment factor 20.8, 59 percent hit rate in top 1 percent [9] | Size-independent scoring and published metrics make claims testable |
| Target validation | ct-validation open framework vs proprietary benchmark | Open clinical trial source reproduced proprietary signal, RS 2.92 vs 2.65 [7] | Open benchmarks can validate open tools against proprietary gold standards |
Notice the pattern in the two wet-lab-adjacent comparisons. In the metabolomics study, the difference in annotation counts, 115 versus 52, came with the caveat that feature detection in both tools was affected by unknown metabolites at identification confidence Levels 4 and 5, background signals, and duplicate features [5]. In the 16S study, the proprietary workflow produced stable consensus predictions at the phylum level while open pipelines won at the species level [6]. Comparison results are granularity-dependent and context-dependent. A tool that wins at one taxonomic level can lose at another. Any comparison you read, or run, should report the level at which the comparison was made.
The covalent docking field illustrates the breadth problem in tool comparison more broadly. Reviews of the covalent docking software landscape now must cover open-source, commercial, and web-based platforms alongside emerging artificial intelligence and machine learning methods, with many docking tools unable to accurately model covalent bond energetics without quantum mechanical or semi-empirical follow-up [13]. When a domain has that many competing tools with partial capabilities, community-maintained benchmark sets become the only fair way to compare.
Choosing the Best Bioinformatics Software
The best bioinformatics software for your problem is the intersection of four circles: it solves your biological problem, it is healthy as a community, it fits your team's skills, and it has evidence in your exact domain. Rank candidates against this checklist:
- Problem fit. Does the tool address your exact data type? MultiVirusConsensus exists because prior open-source viral consensus tools were optimized for single viruses, not mixed wastewater samples, a gap the new pipeline fills by running consensus calling for all viruses of interest completely in parallel [8].
- Skill fit. Cytoflow was built specifically so that non-programmers can apply computational flow cytometry methods through a point-and-click interface, while the same modules remain callable from Python scripts and JupyterLab notebooks [2]. Choosing a tool that matches your team's actual skills beats choosing the most powerful tool your team cannot operate.
- Evidence in domain. The methylation workflow described above assembles widely used open-source tools across three stages because each tool has standing in its specific niche [10]. "Widely used in this exact application" is a stronger recommendation than any general popularity metric.
- Community health. Apply the Step 3 through Step 5 checks. A recent
pushed_atdate, answered issues, and multiple contributors outweigh star counts. - Accessibility. OpenDVP provides two workflows, a fast-track pipeline requiring no image analysis expertise and an AI-powered pipeline incorporating state-of-the-art segmentation methods, deliberately serving both novice and expert users [4]. Tools that offer graded entry points signal a community thinking about adoption.
- Transparency of output. VascX, the retinal vascular biomarker toolbox, emphasizes explainability, computing artery and vein segmentation masks, centerlines, vessel graphs, and derived biomarkers such as vascular density and tortuosity, with published test-retest reproducibility showing most biomarkers at intraclass correlation coefficients above 0.5 and important differences in robustness between individual biomarkers [14]. A community that publishes which of its own outputs are fragile is a community you can trust on the ones it claims are solid.
For a concrete starter stack across common domains, the published workflows themselves are the best guide: Trim Galore, FastQC, MultiQC, BWA-meth, Picard, MethylDackel, and methylKit for targeted methylation sequencing [10], MS-DIAL for GC-HRMS untargeted metabolomics [5], QIIME2 with SILVA for 16S microbiomics [6], and the Nextstrain toolchain for pathogen genomic surveillance [1].
Improving Open Source Bioinformatics Community Health
If you use these tools, you are part of the community whether you intend to be or not. Five actions raise community health for everyone.
File precise issues. Include your command, full error text, operating system, and software version. Maintainers cannot fix what they cannot reproduce.
Fix documentation. A pull request correcting a wrong flag or adding a missing install step is merged quickly in healthy projects and costs you twenty minutes. Documentation errors are the most common failure point for new adopters, so documentation fixes compound.
Cite versions, not just papers. When you cite a tool in your methods, include the version number and, where available, the archival identifier. Nextstrain's Zenodo archive is the model: a frozen snapshot anyone can retrieve [1].
Answer newcomers. Every question you answer in a project's discussion forum is a question the maintainers do not answer, which directly extends project capacity. Cytoflow's developers credit community feedback for guiding development, which only works if users actually speak up [2].
Reuse and adapt openly. The twelve national COVID-19 Data Portals succeeded because the Swedish portal's code was open and adaptable, letting each country localize data sharing rapidly during the pandemic response [3]. Publishing your workflow under an open license, with documentation, is how the next team moves faster than you did.
Common Mistakes and Limitations
Mistake 1. Treating popularity as health. Star counts measure visibility. Commit recency, issue response, and contributor breadth measure health. Audit the second group.
Mistake 2. Assuming "free" means "open source." LIGSIFT is free for academic users but not open source in the full sense [9]. If your work is commercial, clinical, or contracted, read the license before you build.
Mistake 3. Letting the tool choose the answer. In the 16S benchmark, the denoising algorithm alone significantly changed alpha diversity results [6]. If switching tools changes your biology, the difference is methodological, and you must report it.
Mistake 4. Skipping manual curation after automated processing. The metabolomics comparison showed that unknown metabolites, background signals, and duplicate features affect feature detection in both open and commercial tools, and must be assessed before multivariate analysis [5]. Automated output is a draft, not a result.
Mistake 5. Citing the paper without pinning the version. A methods section that says "we used MS-DIAL" is unverifiable. Cite the version and any archival snapshot.
Mistake 6. Building on an archived project unknowingly. The archived flag in the API output exists precisely so you cannot miss it. Archived repositories accept no fixes.
Mistake 7. Confusing interoperability claims with interoperability practice. Test the format handoff yourself. The ICEES, ROBOKOP, and CAM suite earned its interoperability claim by demonstrated sequential querying [12], and your tools should earn theirs the same way in your hands.
Mistake 8. Benchmarking on your data first. Always start with a reference standard where the answer is known, as the 16S study did with a characterized mock community [6]. Your experimental data has no ground truth, so it cannot reveal a tool's errors.
Limitations of audits. A snapshot audit misses seasonal lull, maintainer sabbaticals, and funding cycles. API rate limits restrict unauthenticated queries to roughly 60 requests per hour, so batch your checks. Comparisons between open and commercial tools are never fully symmetric, because commercial tools ship curated vendor workflows while open tools expose all knobs. And individual analyses, especially those feeding clinical or regulatory decisions, need domain-specific statistical review beyond what any tool audit provides.
Frequently Asked Questions
What does community health mean for open source bioinformatics software?
It means the project can keep releasing reliable versions, respond to users, accept contributions, and survive maintainer turnover. You judge it through release cadence, issue responsiveness, contributor count, documentation, tests, licensing, and archival, not through star counts.
How do I check whether a bioinformatics tool is actively maintained?
Query the repository API for the last commit date, check for releases in the past year, and read the last ten closed issues for response quality. A last-commit date within six months and substantive maintainer replies are the strongest signals.
Is open source bioinformatics software as good as commercial software?
Published head-to-head comparisons show open tools matching or beating commercial ones in specific contexts. MS-DIAL annotated more compounds than Compound Discoverer in a GC-HRMS metabolomics comparison, and open QIIME2 pipelines beat a proprietary workflow at species-level 16S analysis. Results depend on configuration and granularity, so benchmark in your own setting.
What are the best bioinformatics software tools for a beginner?
Choose tools with point-and-click interfaces or no-code fast-track modes, such as Cytoflow for flow cytometry or the OpenDVP fast-track pipeline for deep visual proteomics, plus well-documented QC-first workflows like FastQC and MultiQC. Skill fit matters more than raw power.
How do I cite open source bioinformatics tools correctly?
Cite the paper, the specific software version, and any archival identifier such as a Zenodo snapshot. If the repository contains a CITATION.cff file, it gives you the exact citation format the maintainers request.
What license should I look for before using a tool in my pipeline?
MIT, BSD, and Apache-style permissive licenses suit nearly all academic use. GPL requires derivative works to remain open, which matters if you distribute software. Academic-only licenses, as used by some free-but-not-open tools, can block commercial or clinical deployment, so read the LICENSE file first.
How can I contribute to an open source bioinformatics project without being an expert programmer?
File precise bug reports with full error output, fix documentation errors, answer newcomer questions in discussion forums, and share reproducible workflows. These contributions shape development directly and require no deep coding skill.
How do I make my own bioinformatics workflow reproducible for others?
Pin every software version, use containers or locked environment files, build quality control checkpoints between stages with explicit reporting of intermediate outputs, publish your code under an open license, and archive a frozen snapshot with a persistent identifier.
Sources
- Nextstrain automates real-time phylogenetic analysis of open data for endemic and emerging pathogens.
- Cytoflow: User-Friendly Python Software for Computational Flow Cytometry.
- The Network of National COVID-19 Data Portals: public health equity through collaboration.
- OpenDVP: an experimental and computational framework for community-empowered deep visual proteomics.
- Comparison of data processing strategies using commercial vs. open-source software in GC-Orbitrap-HRMS untargeted metabolomics analysis for food authentication: thyme geographical differentiation and marker identification as a case study.
- Evaluating 16S metagenomics data analysis pipelines using an Ion Torrent sequencer for human gut microbiome research.
- ct-validation: an open framework for benchmarking target-indication evidence against clinical trial outcomes.
- MultiVirusConsensus: an accurate and efficient open-source pipeline for identification and consensus sequence generation of multiple viruses from mixed samples.
- LIGSIFT: an open-source tool for ligand structural alignment and virtual screening.
- A Guide to Enzymatic Targeted Methylation Sequencing Bioinformatics Workflow: Best Practices.
- Metabonaut: an open educational resource for learning reproducible, script-based untargeted LC-MS/MS metabolomics.
- Integrated query of three open-source bioinformatics tools to reveal clinical and molecular insights into environmental determinants of disease.
- The covalent docking software landscape: features and applications in drug design.
- Retinalysis-Vascx: An Explainable Software Toolbox for the Extraction of Retinal Vascular Biomarkers From Color Fundus Images.