NCBI Gene to Protein Pathway: How to Interpret It
By Dr. Zubair Khalid, DVM, MS, PhD ·

The NCBI gene to protein pathway is the annotated chain of linked records inside the National Center for Biotechnology Information databases that connects a gene entry to the messenger RNA transcripts it produces, the protein products those transcripts encode, and the biological pathways those proteins participate in. Interpreting it means reading a Gene record from top to bottom, following its transcript and protein links, and then evaluating the domain, ontology, and pathway annotations attached to each product.
This workflow matters because nearly every modern genomics study depends on correctly connecting a gene symbol to the right protein sequence and the right biological context. A researcher who misidentifies the transcript variant, overlooks a protein isoform, or misreads a pathway annotation can draw conclusions that do not hold up under scrutiny. The NCBI Gene database contains millions of gene records across thousands of species, each with its own set of transcripts, proteins, and functional annotations. Knowing how to navigate this structure and interpret what each section tells you is a core skill for anyone working in molecular biology, bioinformatics, or biomedicine. This guide walks through the full workflow, from the initial gene search to the final pathway interpretation, with concrete examples drawn from published research.
What the NCBI Gene to Protein Pathway Means
The phrase "gene to protein pathway" describes two connected things. The first is the data relationship inside NCBI: a Gene record serves as the central hub, linking outward to transcript sequences, protein sequences, conserved domains, pathway databases, and chemical interaction data. The second is the biological process itself: the flow of information from DNA through messenger RNA to a functional protein. When you interpret the NCBI gene to protein pathway, you are reading both at once.
The NCBI gene to protein pathway is not a single database or tool. It is a workflow that spans multiple interconnected databases within NCBI, primarily Gene, RefSeq, Protein, Conserved Domain Database (CDD), and BioSystems. External resources such as KEGG, Reactome, Gene Ontology, and PubChem are linked from within these records. Understanding how these pieces fit together is what NCBI gene to protein pathway interpretation is all about.
Key Terms at a Glance
| Term | What It Is | What It Is Not |
|---|---|---|
| Gene record | A curated NCBI entry describing a genomic locus, its transcripts, and its products | Not a sequence file itself |
| RefSeq transcript | A curated reference mRNA sequence with an NM_ or NR_ accession | Not the only transcript a gene produces |
| RefSeq protein | A curated reference protein sequence with an NP_ or XP_ accession | Not the only possible protein product |
| Conserved domain | A recognizable protein region shared across related proteins, identified by NCBI's CDD | Not a full functional annotation |
| Pathway annotation | A link to a curated pathway in KEGG, Reactome, or another source | Not proof the gene is active in that pathway under your conditions |
| Gene Ontology (GO) term | A controlled vocabulary word describing molecular function, biological process, or cellular location | Not a pathway map |
| Entrez ID | A unique integer identifier assigned to each gene record | Not a sequence identifier |
| BioSystems | NCBI's internal aggregator for pathway and functional system records | Not an independent curation source |
How NCBI Databases Connect Genes to Proteins
The Gene Database as the Central Hub
NCBI's Gene database is the primary entry point for gene-centric information. Each Gene record is assigned a unique integer identifier called an Entrez ID (also written as GeneID). This ID is stable across NCBI databases and is used by external tools to cross-reference gene information. Researchers consolidating data from multiple sources often rely on the Entrez ID as a common key because gene symbols can change between species and across database versions.
Each Gene record contains structured sections that include:
- A summary of the gene's known function
- Genomic context (chromosome, map position, neighboring genes)
- A list of transcripts and proteins with accession numbers
- Links to conserved domains
- Gene interactions with other genes
- Pathway annotations from BioSystems
- Phenotypes and associated diseases
- External database cross-references (HGNC, UniProt, MIM)
- Links to expression data in GEO
- Bibliography including references and GeneRIFs (Gene Reference Into Function)
The Gene record is designed to be the single place where you can find everything known about a gene and follow links to more detailed resources.
RefSeq Accession Numbers and What They Tell You
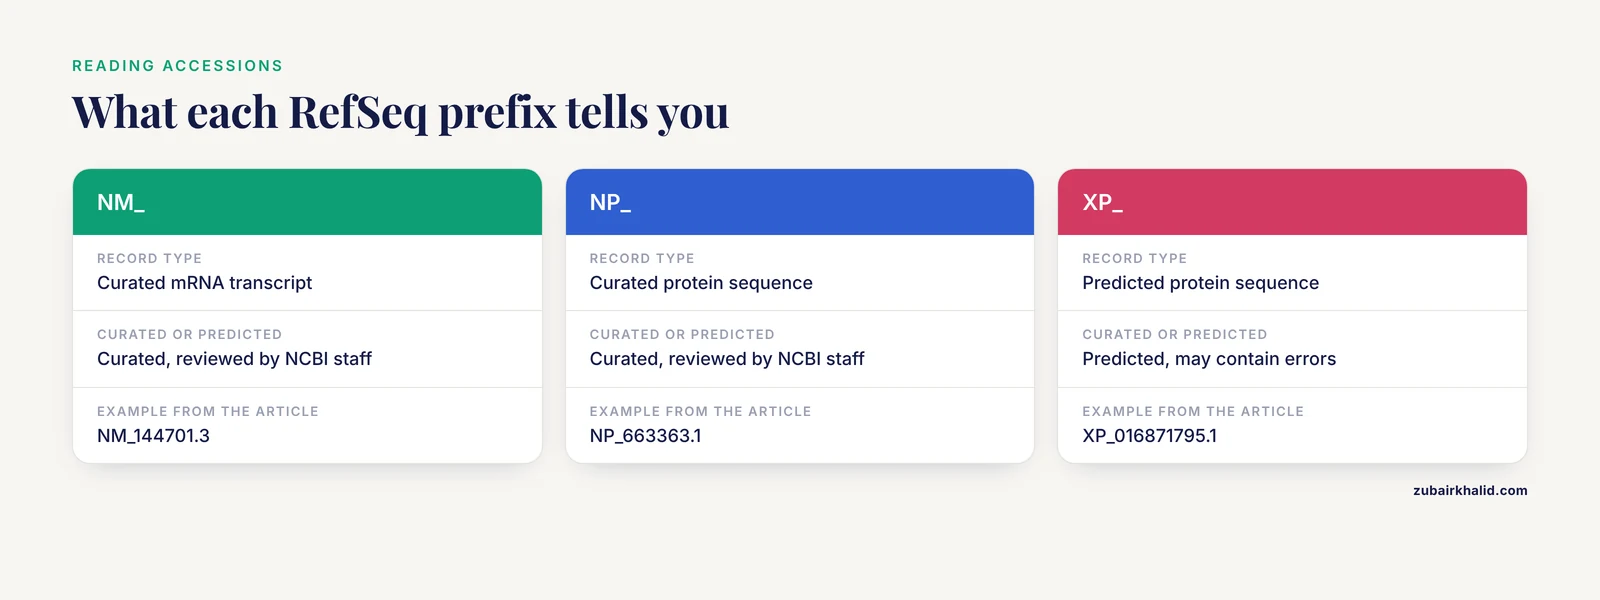
RefSeq (Reference Sequence) is NCBI's curated, non-redundant collection of sequences representing naturally occurring molecules. Understanding accession number prefixes is essential for interpreting gene-to-protein relationships:
| Prefix | Record Type | Example |
|---|---|---|
| NM_ | Curated mRNA transcript | NM_144701.3 |
| NR_ | Non-coding RNA transcript | NR_024540.1 |
| NP_ | Curated protein sequence | NP_663363.1 |
| NG_ | Genomic reference sequence | NG_017013.2 |
| XP_ | Predicted protein sequence | XP_016871795.1 |
| XM_ | Predicted mRNA transcript | XM_011533378.2 |
The trailing number after the decimal point is the version. When NM_144701.3 appears in a publication, the ".3" indicates the third version of that transcript record. Citing the version matters because sequence updates between versions can change the encoded protein.
The distinction between curated (NM_, NP_) and predicted (XM_, XP_) accessions is significant. Curated records are reviewed by NCBI staff and based on experimental evidence. Predicted records come from automated gene prediction algorithms and may contain errors, especially in poorly characterized genomes.
From Transcript to Protein: The One-Gene-Many-Proteins Problem
Each mRNA transcript in a Gene record links to one or more protein products through the genetic code. The relationship is not always one-to-one. A single gene can produce multiple transcript variants through alternative splicing (different exon combinations), alternative promoter usage (different first exons), or alternative polyadenylation (different 3' ends). Each transcript variant may encode a distinct protein isoform with different functional properties.
For example, the human IL23R gene has a primary transcript NM_144701.3 that encodes a protein of 629 amino acids, referenced in UniProt as Q5VWK5-1 [1]. Other transcript variants of the same gene may encode shorter isoforms that lack certain extracellular domains. When interpreting a Gene record, you need to identify which transcript is designated as the reference (usually the longest, most complete one) and which variants produce distinct proteins.
This matters in practice because different studies may use different isoforms. A variant analysis that maps mutations onto isoform 1 may miss variants that affect only isoform 2. A proteomics experiment that identifies peptides unique to one isoform provides evidence for that specific product.
Where Pathway Information Comes From
NCBI does not independently curate biological pathways. Instead, it aggregates pathway information from external databases through its BioSystems resource. The primary sources are:
- KEGG (Kyoto Encyclopedia of Genes and Genomes): manually drawn pathway maps organized by metabolic, genetic, environmental, and cellular processes
- Reactome: peer-reviewed pathway database with detailed reaction-level descriptions
- BioCyc: metabolic pathway databases for specific organisms
When you see "Pathways from BioSystems" on a Gene record, you are seeing this aggregated view. Each entry names the source database and links to the full pathway diagram.
For chemical interactions, PubChem provides Protein, Gene, Pathway, and Taxonomy data collections that organize chemical information around biological targets. These collections contain annotations about biological targets collected from authoritative or curated data sources and can be accessed programmatically through PubChem's PUG View interface or as machine-readable PubChemRDF [2].
Step-by-Step: Tracing a Gene to Its Protein in NCBI
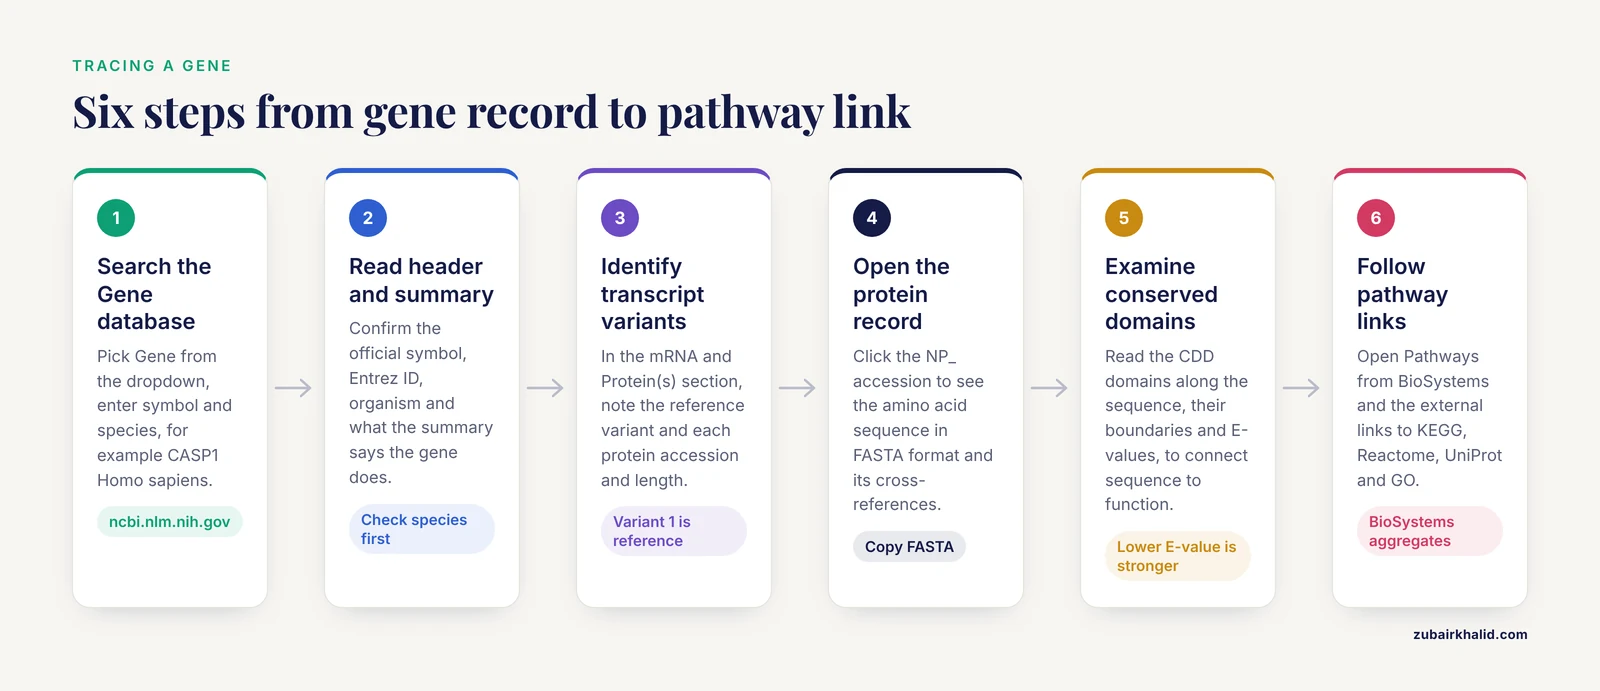
Step 1: Search the Gene Database
Go to the NCBI homepage at ncbi.nlm.nih.gov. Select "Gene" from the database dropdown menu. Enter the gene symbol and species name. For example, typing "CASP1 Homo sapiens" retrieves the human caspase 1 gene record. If the symbol is ambiguous across species, the search results will list all matching records. Select the one matching your organism of interest.
For genes with official symbols, the search is straightforward. For genes known only by sequence, use NCBI BLAST (Basic Local Alignment Search Tool) first to identify the gene, then follow the BLAST result links to the Gene record. A study confirming fungal species identity used BLAST against the NCBI database to verify 18S rRNA sequences before depositing the confirmed sequence in GenBank with accession PV455323 [3].
Step 2: Read the Gene Record Header and Summary
The top of the Gene record displays:
- The official gene symbol and full name
- The Entrez ID
- The organism and taxonomic classification
- Primary source databases (Ensembl, HGNC, MIM)
- Chromosomal location with a graphical map viewer
Below this, the "Summary" section provides a concise description of the gene's known function. For CASP1, the summary describes its role as a cysteine protease involved in inflammation and apoptosis, specifically its function in cleaving pro-interleukin-1 beta into its mature active form.
Read this section carefully. It tells you what the gene does before you examine sequences and pathways. If the summary describes a function unrelated to your research question, you may have the wrong gene or the wrong species record.
Step 3: Identify Transcript Variants and Protein Products
Scroll to the "mRNA and Protein(s)" section. This lists all transcript variants, typically labeled as variant 1, variant 2, and so on. Each entry shows:
- The RefSeq accession (e.g., NM_001284415.2)
- The sequence length in base pairs
- The corresponding protein accession and length in amino acids
- A brief note on what makes this variant distinct
The reference transcript is usually variant 1. NCBI marks it as such. When a publication refers to a gene's protein without specifying an isoform, it typically means the product of the reference transcript.
For genes with many variants, the table can be long. Focus on the reference variant first, then check whether other variants encode proteins with different domain content or cellular localization.
Step 4: Open the Protein Record and Read the Sequence
Click on the protein accession (NP_ prefix) to open the Protein database record. This page shows:
- The amino acid sequence in FASTA format (a standard text format for representing sequences)
- Conserved domain annotations displayed graphically
- Links to 3D structures in the Protein Data Bank (PDB)
- Cross-references to UniProt, Pfam, and other databases
- Taxonomic classification of the protein
The FASTA sequence can be copied directly for use in alignment tools, BLAST searches, or computational analyses. The header line (beginning with ">") contains the accession number and a brief description.
Step 5: Examine Conserved Domains
The conserved domain section displays recognizable protein regions identified by NCBI's Conserved Domain Database (CDD). Each domain is shown as a colored graphical element positioned along the protein sequence. For a caspase like CASP1, you would see the peptidase C14 domain, which contains the catalytic cysteine residue essential for proteolytic activity.
Each domain annotation includes:
- The domain name and CDD accession
- Approximate amino acid boundaries on the protein
- An E-value (a measure of statistical significance for the domain match, where lower values indicate stronger matches)
- A link to the full multiple sequence alignment for that domain
Domains are often the most informative part of a protein record because they connect sequence to function. A protein with a protein kinase domain is likely an enzyme that transfers phosphate groups. A protein with a zinc finger domain is likely a DNA-binding regulator. When characterizing a newly identified gene family, domain architecture is the primary evidence for classification.
Step 6: Follow Pathway and External Database Links
Scroll to the "Pathways from BioSystems" section in the Gene record. Each pathway entry shows the pathway name, the source database, and a link to the full pathway diagram. For CASP1, the pathway section lists entries such as "NOD-like receptor signaling pathway" from KEGG and inflammasome-related pathways from Reactome.
Also check the external cross-references section. Links to UniProt provide protein-level annotations including subcellular localization, post-translational modifications, and tissue expression. Links to Gene Ontology provide functional descriptions. Links to PubChem (when available) show chemical compounds that interact with the protein product [2].
Interpreting Pathway and Functional Annotations
Gene Ontology Terms and Evidence Codes
Gene Ontology (GO) provides a controlled vocabulary for describing gene and protein attributes across three categories:
- Molecular Function: what the protein does at the biochemical level (e.g., "cysteine-type endopeptidase activity")
- Biological Process: the larger objective the protein contributes to (e.g., "inflammatory response")
- Cellular Component: where in the cell the protein acts (e.g., "cytoplasm")
GO terms are hierarchical. A specific term like "cysteine-type endopeptidase activity involved in apoptotic process" is a child of broader parent terms. When you read GO annotations on a Gene record, each term links to the GO database at geneontology.org, where you can see the full hierarchy and all genes annotated with that term.
GO annotations carry evidence codes indicating how the annotation was made:
- IDA (Inferred from Direct Assay): based on experimental data
- IMP (Inferred from Mutant Phenotype): based on mutant analysis
- IEA (Inferred from Electronic Annotation): automated, less reliable
- TAS (Traceable Author Statement): from a published paper
- ISS (Inferred from Sequence or Structural Similarity): based on homology
The scope of GO is enormous. One metabolic GO knowledgebase covers 2,393 metabolic GO terms associated with 3,144 genes, 1,492 enzyme commission (EC) annotations, and 2,621 metabolites [4]. This breadth makes GO useful for interpreting not just gene lists but also metabolomic datasets, where GO terms can connect metabolites to the genes and enzymes that produce or consume them.
KEGG Pathway Maps
KEGG organizes genes into manually drawn pathway maps. Each map is assigned a five-digit number preceded by a species prefix (e.g., "hsa" for human, "mmu" for mouse). A KEGG pathway entry shows boxes for gene products and circles for chemical compounds, connected by arrows indicating direction of reaction or regulation.
When you follow a KEGG link from a Gene record, your gene of interest is highlighted in green on the pathway map. Other genes in the same pathway are shown in white. This visual layout helps you see immediately where your gene fits within the larger biological process.
KEGG pathway maps are particularly useful for understanding metabolic networks and signaling cascades. A study of penaeid shrimp built a functional annotation platform integrating 61,287 annotated proteins representing 34,169 genes, with 178,595 gene-pathway associations across 442 KEGG pathways and 138,077 proteins mapped to 12,897 GO terms [5]. This scale illustrates how pathway databases organize thousands of gene-product relationships into navigable maps.
Reactome Pathway Diagrams
Reactome takes a different approach from KEGG. It organizes pathways into a hierarchy from broad ("Signal Transduction") to specific ("Regulation of inflammasome formation"). Each Reactome pathway has a stable identifier (e.g., R-HSA-1660662) and includes detailed descriptions of each reaction step, including the molecules involved and the evidence for each reaction.
Reactome diagrams are more detailed than KEGG maps for signaling pathways. They show protein complexes, post-translational modifications, and subcellular compartments. When you need to understand the mechanistic details of how a protein participates in a pathway, Reactome is often more informative than KEGG.
NCBI BioSystems
BioSystems serves as NCBI's internal aggregator for pathway and functional system information. It consolidates records from KEGG, Reactome, BioCyc, and other sources into a unified format searchable through Entrez. When you see "Pathways from BioSystems" on a Gene record, you are seeing this aggregated view.
BioSystems records can be searched directly. You can search for a pathway name and retrieve all genes associated with it, or search for a gene and retrieve all pathways it participates in. This bidirectional search is useful for building gene sets for enrichment analysis.
PubChem Target-Centric Data
For genes whose proteins are drug targets or interact with small molecules, the Gene record may link to PubChem's Protein, Gene, Pathway, and Taxonomy data collections. These collections organize chemical information around biological targets, allowing you to see which compounds have tested activity against a given protein or pathway [2]. Records in these collections contain information on chemicals related to a given biological target, helping users analyze and interpret the biological activity data of molecules.
This is particularly useful when a gene product is a known drug target and you want to identify chemical probes, approved drugs, or bioactive compounds that modulate its activity.
How Researchers Apply This Workflow
Variant Interpretation and Missense Analysis
When a study identifies sequence variants in a gene, the first step is to map them onto the correct transcript and protein. A study of the IL23R gene retrieved 723 missense variants from NCBI dbSNP (a database of single nucleotide polymorphisms) and verified each one against transcript NM_144701.3, which encodes the 629 amino acid protein Q5VWK5-1 [1]. The researchers then used computational tools including SIFT, PolyPhen-2, PROVEAN, and AlphaMissense to predict which variants were most likely to disrupt protein function. Sequential filtering identified 37 high-risk missense variants. This workflow depends entirely on correctly identifying the reference transcript and its protein product from the NCBI Gene record.
A similar approach was applied to the ING1 tumor suppressor gene, where 347 missense variants from NCBI dbSNP were screened using 12 sequence-based computational tools to identify those most likely to be deleterious [6]. In both cases, the starting point was the NCBI Gene record, which provided the canonical transcript, protein sequence, and domain architecture needed for downstream analysis.
Differential Expression and Pathway Enrichment
Transcriptomic studies generate lists of genes that are upregulated or downregulated between conditions. Interpreting these lists requires connecting each gene to its known functions and pathways. A study of atherosclerosis retrieved four gene expression datasets (GSE100927, GSE43292, GSE28829, and GSE20129) from NCBI's Gene Expression Omnibus (GEO) and used the limma package in R to identify differentially expressed genes [7]. The researchers then performed Gene Ontology annotation and KEGG pathway enrichment to understand what biological processes the differentially expressed genes shared. After integrating protein-protein interaction network analysis with machine learning, they identified CASP1 as a key autophagy-related gene in atherosclerosis and validated it experimentally using Western blot (a protein detection method), RT-qPCR (quantitative reverse transcription polymerase chain reaction), and immunofluorescence.
This pattern is common across published studies. A study of neonatal hypoxic-ischemic encephalopathy acquired gene expression data from two GEO datasets (GSE23317 and GSE144456) and combined differential expression analysis with Weighted Gene Co-expression Network Analysis (WGCNA) and overlap with post-translational modification-related gene sets [8]. The workflow again started with gene records from NCBI and moved through pathway enrichment to identify candidate biomarkers.
Another atherosclerosis study used three microarray datasets from NCBI-GEO and applied Gene Set Enrichment Analysis (GSEA) for biological interpretation, CIBERSORTx for immune cell deconvolution, STRING for protein-protein interaction networks, and Cytoscape for cluster analysis [9]. Gene Ontology enrichment was performed via geneontology.org, and LASSO (Least Absolute Shrinkage and Selection Operator) logistic regression with ROC (receiver operating characteristic) analysis built classification models. This multi-tool workflow again depended on accurate gene-to-protein-to-pathway connections from NCBI.
Genome Annotation and Gene Family Discovery
When a new genome is sequenced, NCBI's annotation pipelines assign gene predictions, protein-coding sequences, and functional annotations. A complete genome sequence of the bacterium Acidisoma sibiricum was annotated by NCBI PGAP (Prokaryotic Genome Annotation Pipeline), revealing 4,225 genes including 4,127 protein-coding sequences [10]. Each predicted gene receives an Entrez ID, a locus tag, and links to predicted protein sequences with domain annotations.
For gene family studies, researchers retrieve proteomes from NCBI, search for homologs using BLASTp (BLAST for proteins) or HMMER (a tool for searching sequence databases using profile hidden Markov models) against Pfam domain profiles, and then classify family members phylogenetically. A study of the TGF-beta gene family in donkey retrieved genome assemblies and proteomes from NCBI, identified 40 TGF-beta genes using BLASTp and HMMER searches against the Pfam domain PF00019, and then performed phylogenetic, synteny, and Ka/Ks (ratio of non-synonymous to synonymous substitution rates) analyses [11]. The NCBI Gene and Protein records for each identified family member provided the sequence data, domain annotations, and cross-references needed for the full analysis.
A similar approach identified seven ACC synthase (ACS) genes in Carica papaya using an RNA-seq database from NCBI GEO [12]. The researchers classified the genes into four clades based on phylogenetic relationships with well-characterized Arabidopsis ACS genes and analyzed gene structure, domain motifs, cis-regulatory elements, and expression patterns.
Co-Expression Networks and Functional Inference
When a gene has limited experimental characterization, researchers infer function from co-expression patterns. A cattle genomics study constructed a genome-wide co-expression network from 72 microarray datasets retrieved from NCBI GEO, consolidating 16,607 probe sets representing 11,397 genes into 32 co-expression modules using unique Entrez IDs [13]. Each module showed strong enrichment for Gene Ontology terms and Reactome pathways, allowing the researchers to assign putative functions to poorly characterized genes based on the "guilt-by-association" principle.
Network-based approaches extend to gene regulatory network inference. A study of Lactococcus lactis integrated the complete compendium of publicly available transcriptomic datasets from NCBI and used the GENIE3 algorithm to infer a core regulatory network, complemented by multiple tools to predict transcription factors [14]. The co-expression network partitioned into 50 functional clusters, highlighting putative regulators for unique metabolic capabilities.
Hub gene identification from protein-protein interaction networks is another common application. A study of ER stress and Alzheimer's disease collected three transcriptomic datasets from NCBI-GEO and used WGCNA combined with protein interaction network construction and cytoHubba topological algorithms to identify four hub genes: CALR, CANX, HSP90B1, and VCP [15]. These hub genes represent proteins whose perturbation is most likely to affect the network, making them candidate therapeutic targets.
Practical Tips for Using NCBI Effectively
Use the Entrez ID as your stable reference. Gene symbols can change, and accession numbers can be updated. The Entrez ID remains constant and is recognized by most bioinformatics tools.
Check the species before proceeding. Gene symbols are often shared across species. Always confirm the organism in the Gene record header.
Bookmark the reference transcript accession. When you identify the correct transcript variant for your work, record its full accession with version number (e.g., NM_144701.3). This allows others to reproduce your analysis.
Use NCBI BLAST to verify sequences. Before using a sequence in downstream analysis, run a quick BLAST search to confirm it matches what you expect. A study confirming fungal species identity used BLAST against the NCBI database to verify 18S rRNA sequences before proceeding with gene cloning [3].
Download sequences in FASTA format for computational work. The Protein database record provides a "FASTA" display option that gives you the raw amino acid sequence in a format compatible with alignment tools, BLAST, and most bioinformatics software.
Use the "Send to" feature to batch-download records. If you need sequences for multiple genes, use the "Send to" option in Gene or Protein search results to download them all at once in various formats.
Check GEO for expression data. The Gene record links to GEO datasets where the gene has been studied. This can provide expression data for your tissue or condition of interest without requiring new experiments.
Cross-reference with UniProt. UniProt provides complementary protein-level annotations including subcellular localization, post-translational modifications, and tissue expression that may not appear in the NCBI Protein record.
Common Mistakes and Limitations
Assuming the reference transcript is the only one that matters. Many genes produce multiple protein isoforms with different functions. If you only look at variant 1, you may miss biology that occurs through a shorter isoform lacking a key domain.
Confusing a pathway annotation with pathway activation. A Gene record stating that a gene participates in the "cell cycle" pathway does not mean that gene is active or dysregulated in your sample. Pathway membership is a static annotation based on literature curation. Pathway activation requires experimental evidence from your own data, such as expression changes or phosphoproteomics.
Ignoring version numbers on accessions. NM_144701.2 and NM_144701.3 may differ in sequence. Always cite and use the specific version referenced in your analysis. If you use a different version than a published study, your variant mappings or peptide identifications may not match.
Treating predicted protein sequences (XP_) as equivalent to curated ones (NP_). XP_ accessions come from automated gene prediction and may contain errors, especially in non-model organisms. NP_ accessions are curated and reviewed by NCBI staff.
Overinterpreting electronic GO annotations. GO terms with the IEA (inferred from electronic annotation) evidence code are assigned by automated similarity searches and are less reliable than experimentally validated annotations (IDA, IMP, IGI). When reviewing GO annotations, prioritize those with experimental evidence codes.
Using the wrong species record. CASP1 in human and Casp1 in mouse are different records with different Entrez IDs and different sequences. Always confirm the organism before proceeding with any analysis.
Reading pathway diagrams as causal models. A KEGG pathway map shows all known participants and interactions compiled from literature. It does not tell you which interactions are active in a specific tissue, disease state, or experimental condition. Enrichment analysis tells you that a set of genes is over-represented in a pathway, not that the pathway is upregulated or downregulated as a system.
Relying on a single annotation source. Cross-reference annotations between NCBI, UniProt, and the source pathway database. Discrepancies between sources can reveal errors or alternative isoform annotations that matter for your work.
Individual research questions require domain expertise. Automated annotations and computational predictions are starting points for investigation. Experimental validation remains necessary for any biological conclusion drawn from database annotations alone.
Quick Review
- The NCBI Gene database is the central hub connecting gene symbols to transcripts, proteins, domains, pathways, and chemical interactions.
- RefSeq accession prefixes indicate record type: NM_ for curated mRNA, NP_ for curated protein, XP_ for predicted protein, NG_ for genomic reference.
- One gene can produce multiple transcript variants through alternative splicing, each potentially encoding a distinct protein isoform.
- Conserved domains on a protein record link sequence to function and are often the most informative annotation for uncharacterized proteins.
- Pathway annotations from KEGG and Reactome describe pathway membership, not pathway activation in a specific condition.
- Gene Ontology terms describe molecular function, biological process, and cellular location using a controlled vocabulary with evidence codes indicating reliability.
- Entrez IDs serve as stable cross-reference keys across NCBI databases and in external bioinformatics tools.
Frequently Asked Questions
What does the NCBI gene to protein pathway mean?
It refers to the chain of linked records in NCBI databases that connects a gene entry to its mRNA transcripts, protein products, and associated biological pathways. Interpreting it means following those links and understanding what each annotation section tells you about the gene's function and biological context.
How do I find the protein sequence for a gene in NCBI?
Search the Gene database for your gene symbol and species, open the Gene record, scroll to the "mRNA and Protein(s)" section, and click on the NP_ accession to open the protein record with the full amino acid sequence in FASTA format.
What is the difference between NM_ and NP_ accession numbers?
NM_ accessions identify curated reference mRNA transcripts. NP_ accessions identify the curated protein sequences those transcripts encode. A transcript variant (NM_) links to its corresponding protein product (NP_) within the same Gene record.
Why does one gene have multiple protein isoforms?
Alternative splicing, alternative promoters, and alternative polyadenylation sites can produce different mRNA transcripts from the same gene. Each transcript may encode a protein isoform with different domain content, subcellular localization, or function.
How reliable are pathway annotations in NCBI?
Pathway annotations are curated by external databases such as KEGG and Reactome and aggregated by NCBI BioSystems. They represent established knowledge about pathway membership but do not indicate whether a pathway is active under specific experimental conditions.
Can I access NCBI gene and protein data programmatically?
Yes. NCBI provides the Entrez Programming Utilities (E-utilities) API for programmatic access to Gene, Protein, and other databases. PubChem also offers programmatic access through PUG View and machine-readable PubChemRDF representations for chemical and target-centric data [2].
Sources
- In Silico Identification and Structural Characterization of High-Risk Missense SNVs in the Human IL23R Gene Relevant to Inflammatory Bowel Disease.
- PubChem Protein, Gene, Pathway, and Taxonomy Data Collections: Bridging Biology and Chemistry through Target-Centric Views of PubChem Data.
- Recombinant AflQ: a novel fungal-derived protein with potent antibacterial properties.
- IDSL.GOA: Gene Ontology Analysis for Interpreting Metabolomic datasets.
- ShEnrich: a functional annotation database and enrichment platform for penaeid shrimp.
- Predicting the Impact of Deleterious Single-Nucleotide Polymorphisms in the p47ING1a Isoform of Human ING1 Gene.
- CASP1 as a key autophagy-related gene in atherosclerosis: Identification by bioinformatics analysis and experimental validation.
- Identification of Transcriptome-Derived Candidate Genes Associated with Post-Translational Modification Gene Sets in Neonatal Hypoxic-Ischemic Encephalopathy.
- Identification and Validation of Candidate Gene Module Along With Immune Cells Infiltration Patterns in Atherosclerosis Progression to Plaque Rupture via Transcriptome Analysis.
- Complete genome sequence data of Acidisoma sibiricum DSM 21000(T) with PHA pathway and a putative aerobic anoxygenic photosynthesis gene cluster.
- Genome-Wide Characterization of the TGF-β Gene Family in Donkey (Equus asinus) Reveals Lineage-Specific Gene Duplications and Deleterious Mutations.
- Genome-wide identification and characterization of 1-amino-cyclopropane-1- carboxylate synthase (ACS) gene family in Carica papaya and expression insights in response to hormone stress.
- Large-scale gene co-expression network as a source of functional annotation for cattle genes.
- Computational Identification of Novel Transcriptional Regulators and Functional Gene Clusters in Lactococcus lactis Using Integrated Bioinformatics Approaches.
- Gene Expression Analysis of Mitochondria-Associated Membrane (MAM)-Related Genes in ER Stress and Alzheimer's Disease.