How to Interpret FastQC Reports for RNA-seq
By Dr. Zubair Khalid, DVM, MS, PhD ·

Most RNA-seq FastQC reports that alarm beginners are actually showing two expected library properties. Per base sequence quality almost always drops toward the 3' end of the read, and per base sequence content almost always shows strong cyclic bias in the first dozen cycles. Both patterns come from the chemistry of Illumina sequencing and random priming, and neither means your library failed. The first thing to check when interpreting a FastQC report for RNA-seq is therefore not whether any module shows a yellow or red flag, but which modules are flagged, whether the flagged modules are the ones known to be biased by RNA-seq library preparation, and whether the same flags appear across all samples in the run or only in a few.
FastQC sits at the very start of every published RNA-seq workflow. Modern pipelines build an explicit quality control layer before alignment, normalization, and statistical modeling [1]. Published workflows run FastQC on raw FASTQ files, then trim with a tool such as Cutadapt, then align with STAR and assess the alignment separately with tools such as Qualimap [2]. Clinical-grade pipelines such as IntegrateALL likewise begin with FASTQC and MULTIQC on raw FASTQ files before any alignment or variant calling [3]. The reason for this ordering is blunt: raw RNA-seq data can carry quality problems that distort analytical results and lead to erroneous conclusions, so the data must pass through quality control before downstream analysis [4]. FastQC is how you find those problems.
This guide walks through every module of the report, explains which warnings are normal for RNA-seq, ranks the causes of genuine problems from most common to rarest, gives you a working troubleshooting table, and provides a diagnostic sequence and prevention practices you can adopt for every project.
What a FastQC report actually contains
Run FastQC on your files like this:
fastqc *.fastq.gz -o qc_reports/FastQC writes an HTML report and a fastqc_data.txt file for each input. Each report has two parts. The first is a Basic Statistics table. The second is a series of analysis modules, each with a status icon in the left margin: a green check mark (pass), a yellow triangle (warn), or a red cross (fail). Those icons compare your data against thresholds from generic sequencing libraries, not against RNA-seq expectations specifically. That single fact explains most confusion when interpreting a FastQC report for RNA-seq. A yellow triangle on a genomics library is an error. The same triangle on an RNA-seq library is often textbook behavior.
A practical habit from published workflows: run FastQC on every sample, then aggregate all reports into a single page with MultiQC so you can see whether a flag is sample-specific or run-wide [2][5]. A single sample failing per sequence GC content in an otherwise clean batch points at that sample. Every sample failing the same module points at the library preparation or the platform.
Interpreting a FastQC report for RNA-seq, module by module
Basic Statistics
This table reports the filename, encoding, total sequences, sequences flagged as poor quality, sequence length, and percent GC. For bulk RNA-seq you should confirm three things against your library plan. First, total sequences should match the depth you ordered from the sequencing provider, typically tens of millions of reads per sample for standard differential expression work. Second, read length should match the kit you bought. Third, percent GC should be plausible for your organism and enrichment method. Human mRNA-seq libraries usually sit in the high 40s to low 50s in percent GC. A sample dramatically lower than its siblings can signal ribosomal RNA carryover or contamination from another organism.
Also check "Sequence length": a range like 35 to 151 rather than a fixed 151 tells you the reads were already trimmed at the sequencing facility, which changes how you interpret the length distribution module later.
Per base sequence quality
This is the module people look at first and worry about most. The plot shows quality (Phred) scores per cycle. Phred scores are logarithmic: Q20 means a 1 percent chance of an incorrect base call, Q30 means a 0.1 percent chance. Illumina sequencing chemistry produces its best base calls in the early cycles, and quality decays toward the read end as signal-to-noise drops. On a 150-cycle paired end run, medians falling from the high 30s at cycle 1 into the low 20s or teens at cycle 150 are completely ordinary.
FastQC warns when per-cycle quality drops below its default thresholds and fails when they drop further. For RNA-seq, a warning confined to the final 10 to 30 cycles is normal. What is not normal: quality collapsing early, before the midpoint of the read, or a single sample whose quality profile is clearly worse than its siblings from the same run. Those patterns indicate a real problem with that library or that flow cell lane.
The fix for routine 3' decay is quality trimming, covered in the fixes section below. Published workflows routinely follow this order, FastQC first, then quality and adapter trimming with Cutadapt, then alignment [2].
Per tile sequence quality
Each Illumina flow cell is imaged in discrete tiles, and this module compares quality across them. A healthy library shows uniform tiles. A tile that is consistently darker (worse) than the rest indicates a physical problem at that location: an air bubble during the run, debris on the flow cell surface, or a swathe of low-diversity sequence under that imaging region. If one tile alone is bad, the reads from that tile can be filtered later, and many aligners and trimming pipelines can do this. If every tile is bad, suspect the run itself.
One caveat when interpreting this module on modern instruments: FastQC's per tile analysis was written for older flow cell layouts, and reports on newer high-throughput Illumina platforms frequently warn here without any genuine problem. Check this module only when per base quality also looks bad, or when a specific sample is an outlier from the rest of the run.
Per sequence quality scores
This is the distribution of mean quality across all reads. A sharp peak at high quality is healthy. A broad distribution pushed toward the low end means a large fraction of reads sequenced poorly overall, which points to library complexity problems, an overloaded lane, or a degraded cluster generation step, rather than the ordinary end-of-read decay seen in the per base module. This module fails far less often than per base sequence quality, so a red cross here deserves real attention.
Per base sequence content
This module plots nucleotide composition at each cycle. In a perfectly unbiased library, all four bases would each sit at about 25 percent at every position. RNA-seq libraries are never like that, and here is why. Most mRNA-seq library kits fragment RNA and use random hexamer priming for reverse transcription and amplification. Random hexamers are not actually random in their effective occupancy, and this imposes a strong, reproducible sequence preference across roughly the first 12 to 13 cycles of every read. The plot shows sharp base imbalances in those early cycles that then settle toward stable proportions. This is the single most common "failure" in RNA-seq FastQC reports and it is expected behavior, a consequence of the priming chemistry rather than contamination or an rna seq error in your experiment.
What should worry you:
- Bias that persists through the entire read rather than only the first dozen cycles.
- One sample out of a batch showing a completely different composition profile, which suggests index cross-contamination or sample swap.
- A composition dominated overwhelmingly by one base throughout the read, which can indicate poly-A or poly-G artifacts, or low complexity contamination such as rRNA fragments.
For the expected early-cycle bias, the standard fix is simply to ignore it, because aligners tolerate it. If you want to remove it for downstream tools sensitive to it, trim a fixed number of leading bases.
Per sequence GC content
The theoretical model behind this module assumes a random genomic fragment distribution, which fits whole genome sequencing. RNA-seq breaks that assumption twice over. First, you only sequence expressed transcripts, a biased subset of the genome. Second, PCR amplification during library preparation introduces GC-dependent bias. The result is that RNA-seq GC distributions are commonly shifted, skewed, or wider than the theoretical normal curve, and FastQC may warn or even fail the module on a perfectly usable library.
What matters is shape and consistency. A smooth, roughly bell-shaped curve slightly off from theoretical is fine. A bimodal distribution with two peaks can mean contamination by another organism, since different genomes have different average GC content. A spiky, jagged curve usually means a small number of sequences dominate the library, which connects directly to the overrepresented sequences module.
Per base N content
An N is an ambiguous base call, one where the instrument could not decide between bases. Healthy RNA-seq runs have essentially zero N content across all cycles. Rising N content at later cycles tracks quality decay and is handled by the same trimming. N content high from the very first cycles points at sequencing problems such as focus or phasing failures on the instrument, and those reads are rarely salvageable. If this module fails, look at whether the whole lane is affected and contact the sequencing core.
Sequence Length Distribution
Untrimmed Illumina RNA-seq reads form a flat bar at the exact read length, for example 150 bases, and this module passes trivially. After trimming, the distribution spreads into a left tail of shorter reads, which is expected. Published workflows accept this pattern: quality and adapter trimming with Cutadapt precedes alignment with STAR [2], and post-trim length heterogeneity is normal.
Three patterns deserve investigation. A sharp secondary spike at a fixed short length, such as exactly 35 bases, often represents adapter-only reads that survived because the minimum length filter was set too low. Spikes at multiple lengths can indicate contamination with short RNA species or degraded fragments. And if you requested paired end 2x150 but the file contains 75 base reads, something went wrong at the facility or in your preprocessing, so confirm against the delivery notes.
Sequence Duplication Levels
FastQC counts identical sequences and estimates the fraction of the library represented by duplicates. Here RNA-seq breaks the module's assumptions fundamentally. FastQC was designed with genomic resequencing in mind, where identical reads should be rare. In RNA-seq, a handful of highly expressed genes can contribute an enormous share of all fragments, so tens of thousands of reads legitimately start at exactly the same genomic positions and share exact sequences. High duplication in RNA-seq is usually a signature of expression, not of a problem.
FastQC's own report header acknowledges this, noting that deduplication by sequence is not the right approach for transcriptomic data. Read the module as follows:
- Duplication rising gradually with many distinct sequences partially duplicated: normal for RNA-seq, driven by expression.
- A small number of sequences duplicated hundreds of thousands of times: check the overrepresented sequences module, because that points to rRNA, adapter dimers, or one transcript swamping the library.
- Duplication in one sample wildly higher than its siblings, combined with low total sequences and low complexity: suspect PCR over-amplification during library preparation, meaning too few starting molecules were cycled too many times.
If you plan to remove PCR duplicates for quantitative work, do it with a tool that uses mapping positions or UMIs (unique molecular identifiers, random barcode tags that mark each original molecule), not with sequence-based deduplication.
Overrepresented sequences
FastQC lists sequences that individually exceed roughly 0.1 percent of the total library and attempts to match them against a small built-in contaminant database. For RNA-seq, this module is a gold mine. The most common findings, ranked by how often I see them:
- Ribosomal RNA fragments. The dominant contamination in RNA-seq, especially in total RNA-seq and degraded samples. rRNA sequences share identical matches across many copies, so they appear as massive overrepresented hits.
- Highly expressed endogenous transcripts. In a sample overexpressing a gene, that gene's fragments appear as overrepresented. This is biology, not error. Confirm by BLASTing the sequence against the transcriptome of your organism.
- Poly-A or poly-T stretches. Signatures of read-through into the poly-A tail of mRNA, common when insert sizes are short relative to read length.
- Poly-G or poly-C stretches. An artifact of two-color chemistry on newer Illumina platforms, where dark cycles are called as G, producing long artificial G tails on low-complexity reads.
- Adapter sequences. Read-through from inserts shorter than the read length.
Each finding has a different fix, covered below.
Adapter Content
This module plots cumulative adapter contamination along the read. A clean library stays near zero until late cycles. Growing adapter content toward the 3' end means fragments were shorter than the read length, so the sequencer read into the adapter. Small amounts appearing only in the last few cycles are routine and cost you little. Adapter present from early cycles means a large fraction of your fragments were shorter than expected, which wastes most of the run and usually indicates an overly aggressive fragmentation step or bead-based size selection that removed long inserts.
Adapter content is the module where trimming is least optional. Every published workflow cited here trims before alignment: Cutadapt in the endothelial cell workflow [2], Cutadapt after FastQC and MultiQC in the influenza transcriptome dataset [5], and adapter and quality trimming inside the RNA-QC-Chain pipeline [4].
KMER Content
This module looks for short words (k-mers, sequences of a fixed length such as 7 bases) that are enriched at particular positions beyond expectation. In RNA-seq, the dominant finding is a set of diverse k-mers all enriched specifically in the first 13 or so positions. That is the random hexamer priming signature again, the same phenomenon driving per base sequence content, and it is expected. K-mers enriched across the whole read, or a single k-mer enormously enriched everywhere, behave like an overrepresented sequence and deserve a BLAST search. K-mers matching adapters point back to the adapter module.
The troubleshooting table
This table is the core of practical bioinformatics troubleshooting for FastQC reports. Work down it when a module warns or fails.
| Symptom in report | Likely cause | How to confirm | Fix |
|---|---|---|---|
| Per base quality drops below Q20 only in last 10 to 30 cycles | Normal Illumina decay | Same pattern in all samples in the run | Quality trim 3' ends with Cutadapt or fastp, proceed |
| Quality collapses before the read midpoint | Failed clusters, overloaded lane, degraded library | Compare with sibling samples on MultiQC, check other samples on the same lane | Re-sequence or filter heavily, possibly exclude sample |
| One sample's per tile plot has a dark streak | Localized flow cell problem (bubble, debris) | Check whether other samples sharing the lane show the same tiles | Filter reads from that tile, or accept minor loss |
| Per base sequence content fails, bias confined to first 12 to 13 cycles | Random hexamer priming bias | Bias pattern is identical across all samples and kits | Nothing required, aligners tolerate it, optionally trim first 12 bases |
| Composition biased across the whole read | Low complexity contamination, rRNA, or barcode bleed | Check overrepresented sequences, BLAST top hits, look at GC content module | Filter contaminant sequences, re-prepare library if index bleed |
| GC distribution shifted or bimodal | Contamination by another organism, or rRNA carryover | BLAST overrepresented sequences, run a taxonomic classifier on a read subsample | Filter contaminant reads, adjust enrichment protocol |
| High duplication with many partially duplicated sequences | Expected expression of abundant transcripts | Duplication increases with sequencing depth across samples | Ignore, or deduplicate positionally only if your analysis requires it |
| A few sequences duplicated hundreds of thousands of times | rRNA, adapter dimers, or one dominant transcript | Open the overrepresented sequences list, BLAST the top entries | rRNA: filter with a rRNA reference. Dimers: re-trim and re-size select. Transcript: accept as biology |
| Length distribution spikes at fixed short length | Adapter-only reads surviving trimming | Check adapter content module, inspect the spike length | Raise minimum length after trimming (for example, discard reads under 30 bases) |
| Adapter content rising from early cycles | Library fragments shorter than read length | Compare insert size expectations from the prep protocol | Trim adapters, then discuss fragmentation and size selection with the lab for future preps |
| High N content from early cycles | Instrument sequencing problem (focus, phasing) | Whole lane or whole run affected | Contact sequencing facility, likely re-run |
| One sample is an outlier in every module | Sample swap, degradation, or failed library | Check barcode sequences, library quantification records, RNA integrity metrics from the lab | Trace lab records, most often re-prepare that one library |
Common causes of FastQC problems in RNA-seq, ranked from most common to rarest
1. Expected chemistry-driven bias (most common)
The 3' quality decay, the early-cycle sequence content bias, and expression-driven duplication together account for the majority of yellow and red flags in RNA-seq reports. None of these is an rna seq error on your part. The mechanism for each is understood. Sequencing signal degrades with cycle number because each additional base extends the cluster's synthesized strand with ever-smaller proportional signal differences. Random hexamers bind with position-dependent preference because six-base priming occupancy is not uniform across fragments. Highly expressed genes produce many identical fragments. A report showing exactly these three flags and nothing else, consistently across all samples, describes a successful RNA-seq dataset.
A useful reality check comes from a survey of public data: in one analysis of 25 RNA-seq datasets from published studies, only eight passed FastQC's default filters, yet the datasets still supported meaningful downstream analyses, with the authors issuing a cautionary note about interpretation rather than declaring the data unusable [6]. Default flags are a screening tool, not a verdict.
2. Adapter read-through and short inserts
When the RNA fragments going into the library are shorter than the sequencing read length, the sequencer reads past the insert into the adapter. Small amounts at read ends are cosmetic. Large amounts from early cycles mean the library lost its insert size distribution, usually through over-fragmentation or a size selection step that retained only short molecules. The reads are still trimmable, but a library dominated by adapter is a library that wasted most of its sequencing capacity.
3. Ribosomal RNA contamination
mRNA-seq kits enrich messenger RNA through poly-A selection, and total RNA-seq kits deplete rRNA with capture probes. Neither is perfect. Residual rRNA sequences appear in the report as overrepresented sequences, elevated duplication dominated by a few sequences, and sometimes a GC shift, because rRNA base composition differs from the transcriptome average. Light rRNA carryover costs you a few percent of reads and is acceptable. Heavy carryover, where tens of percent of reads map to rRNA, effectively reduces your sequencing depth and can distort expression quantification, so dedicated QC tools were built to detect and remove it automatically [4].
4. RNA degradation before library preparation
RNA is chemically fragile. Poor handling, repeated freeze-thaw cycles, and slow extraction expose it to RNases (ribonucleases, pervasive enzymes that chew RNA) and hydrolysis, fragmenting transcripts nonrandomly. Severely degraded RNA produces libraries with poor complexity, biased coverage toward transcript 3' ends, low average fragment sizes, and consequently adapter read-through and low diversity. Every flag on the report can look bad at once. This cause is invisible to FastQC itself, which is why the laboratory's RNA integrity metrics recorded at extraction matter as part of your QC evidence chain.
Safety note: RNA extraction commonly uses reagents containing phenol and chloroform, which are corrosive and toxic, and some protocols add beta-mercaptoethanol, which is harmful by inhalation. Perform extraction in a fume hood with nitrile gloves and eye protection, and dispose of waste through your institution's chemical safety program.
5. PCR over-amplification
Library preparation amplifies your adapter-ligated fragments by PCR. If the starting amount of RNA was low, the PCR runs many cycles to reach the required input mass, and duplicate copies of identical original molecules accumulate. Combined with expression-driven duplication, this inflates the duplication module, lowers apparent library complexity, and shows up as an outlier sample on MultiQC. The fix is upstream: more input RNA, fewer PCR cycles, or a low-input kit with UMIs so true duplicates can be identified after alignment.
6. Instrument and flow cell problems (less common)
Per tile failures, high N content from early cycles, and run-wide quality collapse point at the sequencer rather than your library. Bubbles in the loading port, debris in a lane, and focus drift produce characteristic and localized artifacts. These are the facility's problems to diagnose, which is one reason sequencing providers run their own QC before delivering data.
7. Index hopping and barcode bleed (rare on most platforms)
Patterned flow cell chemistries allow a small fraction of reads to carry the wrong sample index. The signature in FastQC is subtle: one sample showing low-level sequence content or GC patterns that resemble its sibling samples, or contamination signals appearing in controls. Severe index bleed is rare but catastrophic for interpretation because it mixes samples at the read level.
8. Cross-species contamination (rare)
Carryover from a previous library prep, a mixed-up sample, or environmental organisms can introduce foreign sequences. The GC module turns bimodal and overrepresented sequences BLAST to an unexpected organism. Dedicated QC pipelines can identify contaminating species and rRNA automatically as part of their workflow [4]. If contamination is widespread rather than incidental, the library needs to be redone.
How to fix the real problems: trimming, filtering, and decisions
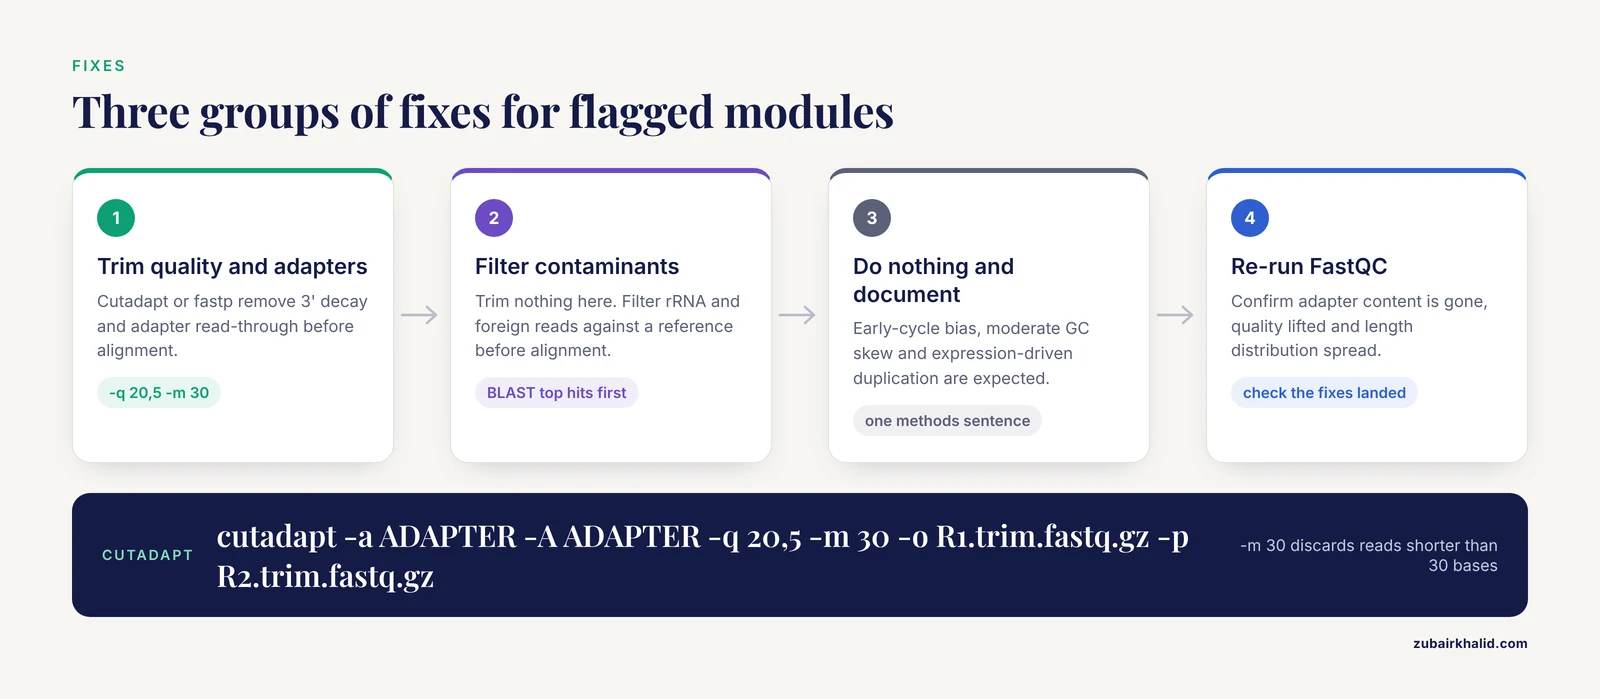
Not every flag needs a fix. The ones that do break into three groups.
Group 1: Trim quality and adapters. This is the universal fix for 3' decay and adapter content. With Cutadapt, a standard paired end command looks like this:
cutadapt -a AGATCGGAAGAGCACACGTCTGAACTCCAGTCA \
         -A AGATCGGAAGAGCGTCGTGTAGGGAAAGAGTGT \
         -q 20,5 -m 30 -o sample_R1.trim.fastq.gz -p sample_R2.trim.fastq.gz \
         sample_R1.fastq.gz sample_R2.fastq.gz
Here -a and -A give the adapter sequences for the R1 and R2 reads of an Illumina TruSeq-style library, -q 20,5 trims low-quality bases from the 3' end with a 5-base window, -m 30 discards reads shorter than 30 bases, and -o and -p name the outputs. The exact adapter string depends on your kit, and your sequencing provider can tell you which adapter their runs use. Alternatively, fastp performs adapter detection, quality trimming, and length filtering in one fast pass for paired end data, and has become the default in many pipelines:
fastp -i sample_R1.fastq.gz -I sample_R2.fastq.gz \
      -o sample_R1.trim.fastq.gz -O sample_R2.trim.fastq.gz \
      -q 20 -l 30 -w 8 -h sample_fastp.html
After trimming, re-run FastQC on the trimmed files. You should see adapter content gone, per base quality lifted, and length distribution spread. Per base sequence content in the first cycles will still show the priming bias, which is correct and expected.
Group 2: Filter contaminants. For rRNA and foreign-sequence contamination, trimming does nothing. Filter reads against an rRNA reference before alignment, or rely on the aligner to assign them to rRNA genes and quantify only exonic gene reads. For heavy contamination, tools designed for the purpose can detect rRNA and contaminating species automatically in one pass [4]. Confirm what the contaminant actually is before filtering, by BLASTing the top overrepresented sequences against the transcriptome or genome of your organism.
Group 3: Do nothing and document it. Early-cycle sequence content bias, moderate GC skew, expression-driven duplication, and late-cycle quality decay all fall here. Write one sentence in your methods or project README stating that these modules flagged as expected for RNA-seq and were not treated. Reviewers and collaborators will ask, and your future self will thank you. Case studies that examine RNA-seq data in depth rather than accepting report flags at face value consistently find that understanding the data beats icon-chasing [7].
A diagnostic sequence you can follow
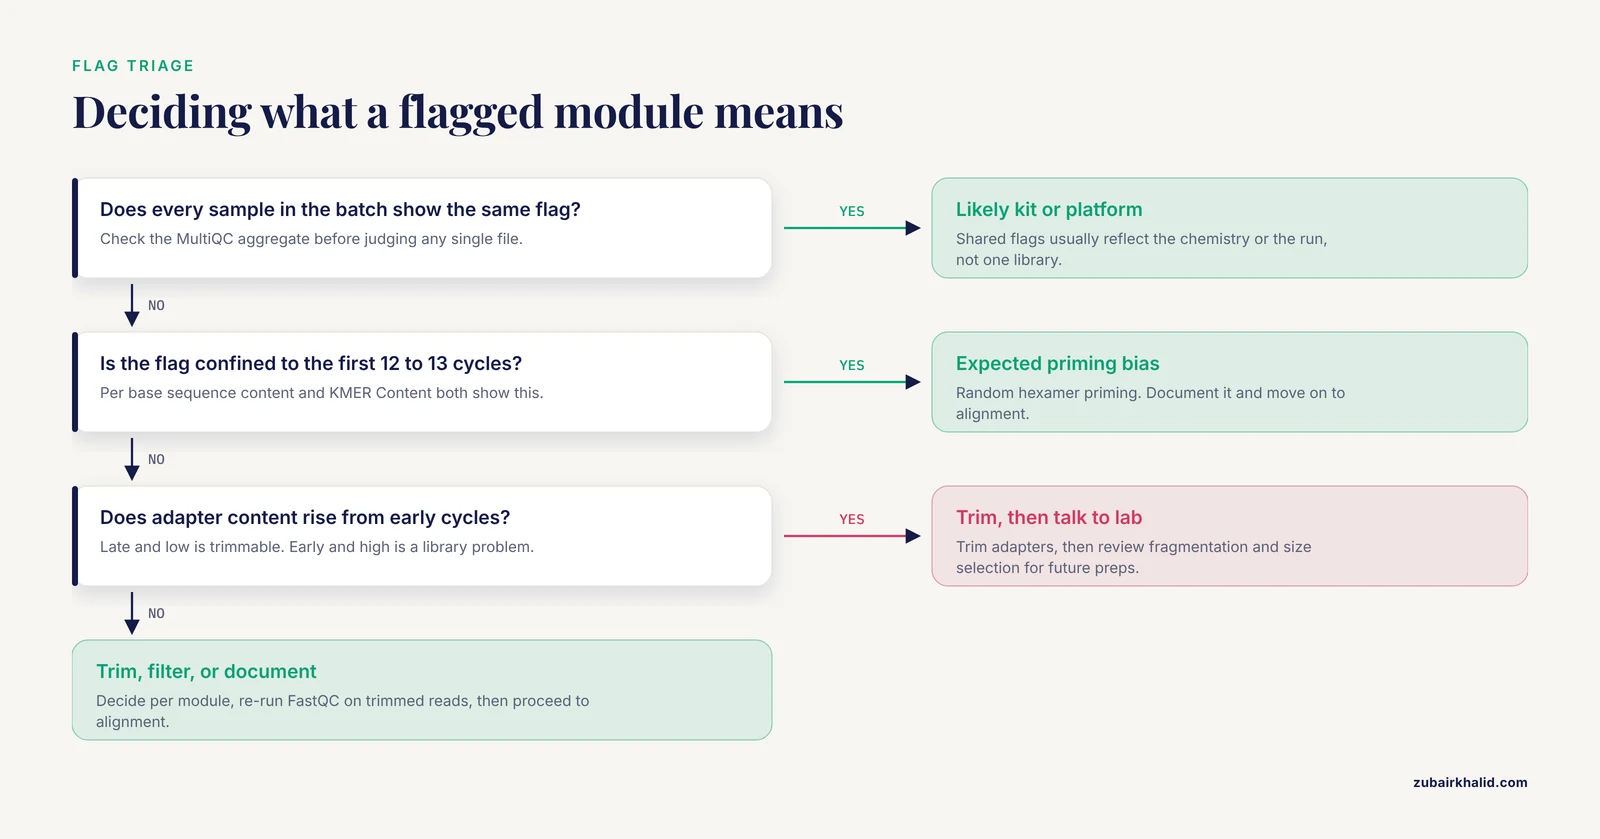
When a report looks wrong, work through this order rather than reacting to the scariest red cross:
- Open MultiQC across all samples in the run, so no module is judged in isolation [3].
- Check Basic Statistics first: correct read counts, correct read length, plausible GC.
- Look at per base sequence quality. Decay only at the 3' end is normal. Early collapse is not.
- Look at adapter content. Late and low is trimmable. Early and high is a library problem.
- Look at per base sequence content. Bias limited to the first dozen cycles is expected. Whole-read bias needs the overrepresented list.
- Open the overrepresented sequences module and BLAST the top three entries. This one step resolves most genuine mysteries.
- Compare the suspicious sample against its siblings. Outlier samples have causes in the lab, not the pipeline.
- Decide per module: trim, filter, or document as expected.
- Trim with Cutadapt or fastp, re-run FastQC, and confirm the fixes landed.
- Proceed to alignment, and layer on alignment-level QC. Published workflows pair FastQC with post-alignment assessment using tools such as Qualimap before quantification [2], and quality control continues through normalization and differential expression rather than ending at the FASTQ [1][8].
Judging reports in batches, not one file at a time
Single-sample interpretation is the weakest form of FastQC analysis. Platforms, lanes, and library prep batches imprint consistent signatures, so the meaningful question is rarely "is this sample good" but "is this sample different from its siblings." IntegrateALL, the clinical RNA-seq pipeline for B-cell precursor acute lymphoblastic leukemia subtyping, runs FASTQC and MULTIQC together as the first stage before STAR alignment and downstream classification [3]. The influenza transcriptome dataset workflow likewise paired FastQC with MultiQC before trimming and quantification [5]. Reproduce that pattern: one MultiQC aggregate report per sequencing batch, stored alongside the raw reports, reviewed before any trimming decision is made.
Common Mistakes and Limitations
- Treating every yellow triangle as a failure. FastQC's thresholds were calibrated on generic sequencing libraries. Several modules fail on healthy RNA-seq data by design of the chemistry, not by error.
- Judging one sample alone. Without the batch context that MultiQC provides, you cannot tell a sample-specific problem from a run-wide one.
- Trimming away the random priming bias in the first 12 bases "to make the report pass." This discards good data to satisfy a module that does not apply to your library type. Aligners handle this bias.
- Using sequence-based deduplication on RNA-seq. Identical sequences arise from expression, not only from PCR duplicates. Position-aware or UMI-based deduplication is the defensible choice.
- Treating FastQC as the whole QC story. FastQC inspects raw reads only. It cannot see mapping rate, rRNA fractions after alignment, 3' coverage bias, or gene body coverage. Add post-alignment QC such as Qualimap before quantification [2], and continue QC into the count and normalization stage where tools examine per-sample data distributions [8].
- Assuming every overrepresented sequence is contamination. The top hit in a tumor or infected sample is frequently a genuinely overexpressed transcript, which is the biological signal you sequenced the library to find.
- Reading the duplication module against genomic expectations. High duplication in RNA-seq usually reflects expression levels, a point the module's own documentation acknowledges for transcriptomic data.
- Ignoring the possibility that a dataset with warnings is still fit for purpose. The analysis of 25 public datasets in which most failed default filters but still supported valid downstream inference is the standing counterexample to icon-based rejection [6].
Prevention practices
- Record RNA integrity and yield at extraction for every sample, before any sequencing, so a bad library can be traced to its input rather than guessed at afterward.
- Run a pilot on one or two libraries before committing a full batch, and review the FastQC report with the sequencing facility before scaling up.
- Aggregate every batch with MultiQC and archive both raw and aggregate reports in the project repository, matching the FastQC-plus-MultiQC pattern used in published pipelines [3][2][5].
- Fix your trimming parameters in a versioned script or workflow file so every sample in a project is treated identically, then note the parameters in your methods. Modern pipelines deliberately separate quality control, trimming, alignment, quantification, and interpretation into documented stages precisely so each step can be reviewed and reproduced [1].
- Re-run FastQC on trimmed reads and expect specific, predictable changes. If trimming does not change what you expected it to change, the diagnosis was wrong, not the command.
- Keep the overrepresented sequences list in the archive even when it looks boring. A year later, when an anomaly appears downstream, that list is frequently the artifact that explains it.
- Plan quantification and interpretation tooling before data arrive, so QC results feed directly into a defined downstream workflow rather than ad hoc analysis. End-to-end interpretation pipelines that take processed RNA-seq data through global, pathway, and gene-level views exist precisely to close that gap [9].
Frequently Asked Questions
What does a red cross in a FastQC module actually mean?
It means the module's default threshold, calibrated on generic sequencing libraries, was exceeded. It does not automatically mean your RNA-seq library failed, and several modules flag expected RNA-seq chemistry. Read the plot itself and compare across samples before reacting to the icon.
Which FastQC modules matter most for RNA-seq?
Per base sequence quality, Adapter Content, Overrepresented sequences, and Basic Statistics carry the most actionable information. Per base sequence content, Per sequence GC content, and Duplication Levels flag patterns that are largely expected for RNA-seq and should be interpreted with library type in mind.
Why does per base sequence content fail on my RNA-seq data?
Random hexamer priming during reverse transcription imposes reproducible nucleotide bias across roughly the first 12 to 13 cycles of every read. This is expected for most mRNA-seq kits, is identical across samples, and does not require correction before standard alignment.
Should I trim my reads before alignment?
Yes for adapter content and 3' quality decay, which is why published workflows place Cutadapt or equivalent trimming between FastQC and STAR alignment. No for the early-cycle priming bias, which trimming does not meaningfully fix and aligners tolerate.
What causes overrepresented sequences in RNA-seq?
The most frequent causes are ribosomal RNA fragments, highly expressed endogenous transcripts, poly-A or poly-G tails, and adapter read-through. BLAST the listed sequences to distinguish contaminant from biology, because the fix differs completely between them.
Can I compare FastQC results across samples?
Yes, and you should. Run FastQC on every sample and aggregate with MultiQC so each module can be viewed across the batch. A flag shared by all samples usually reflects the platform or kit, while a flag isolated to one sample points at that sample's library.
Do low-quality bases affect differential expression results?
They can, indirectly. Poor quality reduces mapping rates and can bias transcript quantification, which propagates into the counts that differential expression tools normalize and model. Trimming adapter and low-quality tails before alignment, as standard workflows do, removes the bulk of this risk.
What Phred quality do I need for RNA-seq?
Aim for the bulk of your bases above Q30, meaning a 0.1 percent base call error rate, which is the practical standard for Illumina short-read output. Quality falling toward Q20 only in the last cycles of long reads is normal and is handled by routine 3' trimming.
Sources
- Advances in RNA-Seq Data Analysis: Towards More Reliable Clinical Translation
- Endothelial Cell RNA-Seq Data: Differential Expression and Functional Enrichment Analyses to Study Phenotypic Switching.
- Integrateall, a Machine Learning Pipeline for Multi-Level Data Extraction from RNA-Seq Profiles Unravels Novel Drivers and Systematic Subtype Classification in B-Cell Precursor ALL
- RNA-QC-chain: comprehensive and fast quality control for RNA-Seq data
- RNA-Seq transcriptome data of human cells infected with influenza A/Puerto Rico/8/1934 (H1N1) virus
- Ancestry patterns inferred from massive RNA-seq data
- Know your RNA-Seq data in depth: a case study using data from early life stress in mouse
- Integrative Differential Expression Analysis for Multiple EXperiments (IDEAMEX): A Web Server Tool for Integrated RNA-Seq Data Analysis
- Searchlight: automated bulk RNA-seq exploration and visualisation using dynamically generated R scripts