How to Choose a High-Throughput Protein Analysis Platform
By Dr. Zubair Khalid, DVM, MS, PhD ·

A high-throughput protein analysis platform is a combined wet-lab and computational system that measures thousands to millions of protein features, such as sequences, binding affinities, structures, or chemical modifications, in parallel rather than one sample at a time. The single most useful rule of thumb when choosing one is this: first decide what you are measuring (sequence, mass, binding, or structure), then decide how many independent samples you truly need, and only then compare instruments and software. Labs that pick a platform before answering those two questions usually end up buying throughput they cannot analyze or sensitivity they do not need.
This guide walks through the main platform families, the criteria that actually decide a purchase or an adoption decision, and the computational layer that turns raw output into results. The comparison draws on published head-to-head evaluations and on documented platforms spanning sequencing, mass spectrometry, fluorescence assays, and web-based structure analysis.
What a High-Throughput Protein Sequence Analysis Platform Actually Does
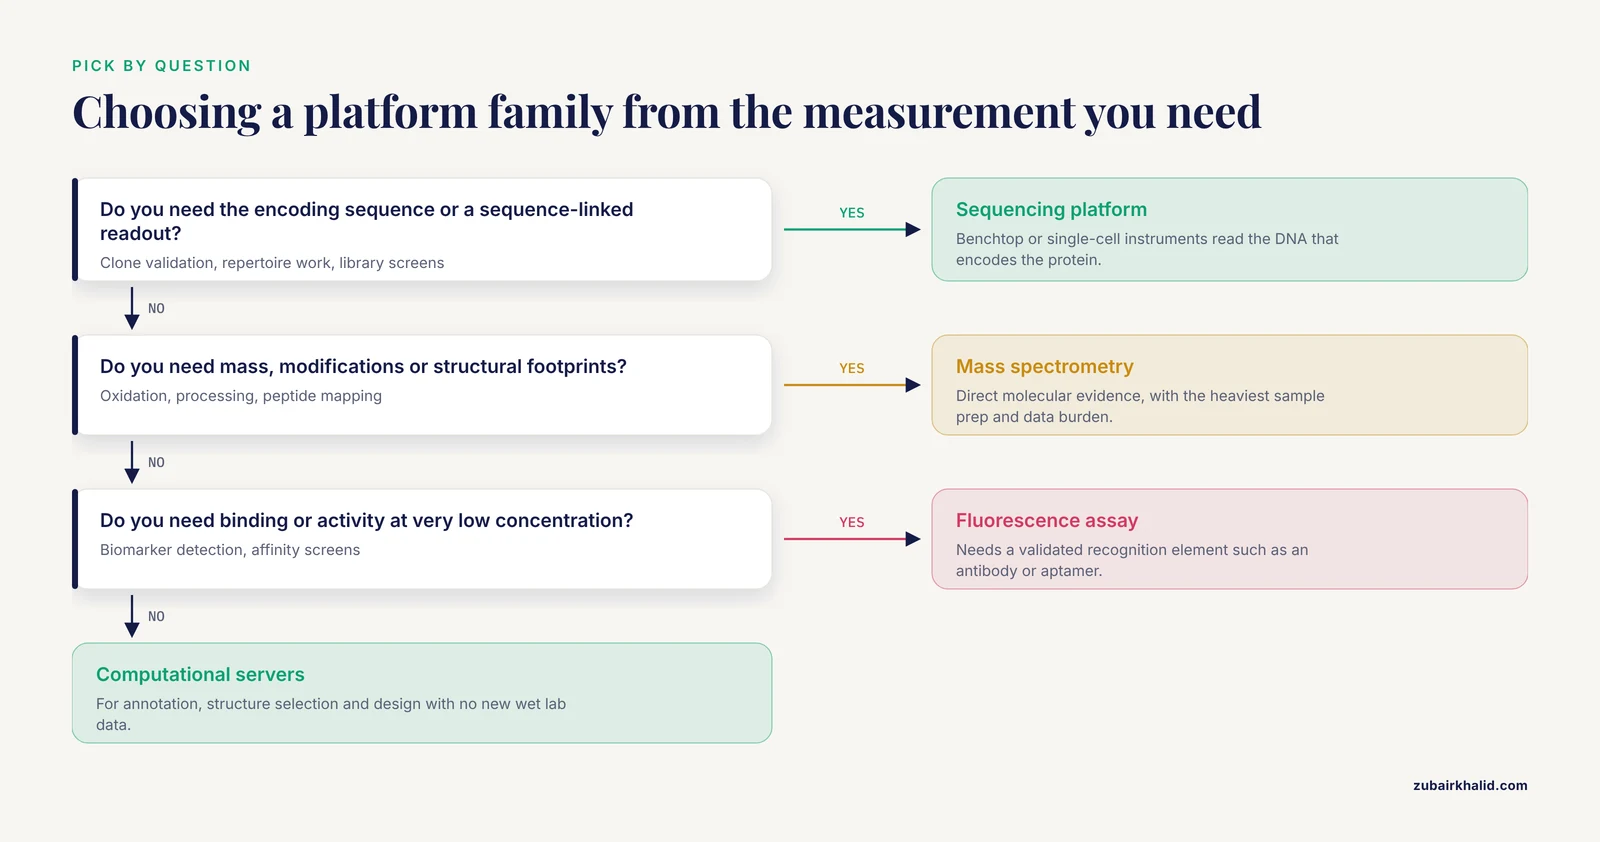
The phrase covers several distinct instrument classes, so precision helps. At one end sit sequencing instruments that read the nucleic acid sequences encoding proteins, which is how modern antibody discovery, clone validation, and variant screening get their primary data. At the other end sit mass spectrometers, fluorescence assay systems, and computational servers that work with protein molecules, protein structures, or protein domain architectures directly.
A high-throughput protein sequence analysis platform in the strict sense is any system that takes many protein-coding sequences or protein-derived signals as input and produces standardized, analyzable output at scale. Three published examples show the range:
- An aptamer-based fluorescent platform built around a 29-base G-quadruplex probe detected the Alzheimer biomarker Aβ42 across a linear range of 0.01 to 100 pg/mL with a limit of detection as low as 3 fg/mL, running in a high-throughput plate format suitable for clinical specimens [1].
- A single-cell sequencing workflow called Antigen Affinity BCR-seq captured relative antibody-antigen affinity for thousands of paired native B-cell receptor sequences in one assay, pairing sequence data with a functional readout in a single run [2].
- A mass spectrometry footprinting platform called AXYS ran in-cell fast photochemical oxidation of proteins on 24-well plates through an automated XY stage, modifying more proteins in less time than the older six-well setup it replaced [3].
None of these is "the best" in any absolute sense. Each solves a different measurement problem at a different scale, which is exactly why the comparison criteria in the next sections matter more than brand names.
The Main High-Throughput Protein Analysis Platform Families
Most of the high-throughput protein sequence analysis platform options available today fall into five families. Understanding what each one measures, and what it cannot measure, prevents the most common mismatch between platform and project.
Sequencing-Based Platforms Applied to Proteins
Next-generation sequencing (NGS), a family of technologies that read millions of DNA fragments in parallel, underlies most large-scale protein sequence work because proteins are encoded by genes. Targeted resequencing of protein-coding genes, antibody repertoire sequencing, and deep screening of engineered protein libraries all depend on it.
Two published platform comparisons show how these instruments are evaluated and how differently they can behave. In a BRCA1 and BRCA2 mutation screening study, a PCR-based multiplexed workflow was run on two sequencers, SOLiD 4 and Ion Torrent PGM, and judged against Sanger sequencing as the reference. Sensitivity was 97.8 percent (95 percent CI 94.7 to 100.0) for SOLiD and 98.9 percent (95 percent CI 96.8 to 100.0) for PGM. SOLiD reached 100.0 percent specificity. PGM correctly identified all three indels in the panel but also produced 68 false-positive indel calls, a pattern typical of platforms with homopolymer-associated error modes. Both platforms scaled well enough that the authors projected reagent costs below 200 US dollars per BRCA test, with only 325 ng of DNA required per patient [4].
A more recent head-to-head compared Illumina MiSeq against MGI DNBSEQ-G99RS on a certified CFTR genotyping panel using 47 routine clinical samples. Variant detection was completely concordant across SNVs, CNVs, and complex alleles. Illumina showed slightly better basecalling quality and more uniform allelic frequencies, while MGI reached a mean depth of roughly 2,793-fold and higher demultiplexing efficiency [5]. The lesson generalizes: modern platforms from reputable manufacturers are all accurate enough for many tasks, and the decision usually turns on error profile, depth, and workflow fit rather than on raw accuracy rankings.
Sequencing platforms also power functional protein screens. A high-throughput aptamer engineering effort repurposed a MiSeq run to profile interactions between three SARS-CoV-2 spike proteins and 11,792 unique aptamer variants in days, identifying a Delta-binding mutant with 4-fold improved affinity and converting an Omicron non-binder into a nanomolar-affinity binder [6]. Swarm-seq applied a sequencing readout to more than five hundred codon-optimized bacterial CsrA homologs expressed in a single host, sorting them into two functional classes and training machine learning models to predict regulatory activity from sequence [7].
Mass Spectrometry Platforms
Mass spectrometry (MS) measures proteins by mass-to-charge ratio, giving direct molecular information that no sequencing readout provides, including post-translational modifications, proteolytic processing, and oxidative footprints of solvent exposure.
Three MS-based platform designs illustrate different throughput strategies. The AXYS platform for in-cell fast photochemical oxidation of proteins (FPOP) automated sample handling on an XY stage and moved from a six-well to a 24-well plate format, expanding both replicate numbers and the types of biological samples that could be analyzed [3]. For serum peptide profiling, a robotic platform enriched peptides on C18-functionalized magnetic beads and acquired spectra on high-resolution MALDI-TOF and ultrahigh-resolution MALDI-FTICR instruments, with an isotopic-distribution quality control parameter used to automatically sort and select the best spectrum from replicate spots [8]. For therapeutic protein characterization, a tandem-column UHPLC peptide mapping workflow running at 700 μL/min above 1,000 bar cut injection-to-injection time from 123 minutes to 12.5 minutes, roughly a 10-fold throughput gain, while holding retention time standard deviation to 0.01 minutes versus 0.34 minutes for the reference method, and resolving 42 of 51 monitored peptide modification sites versus 38 with a single column [9].
MS platforms deliver the richest molecular detail and the heaviest data burden. They also require the most method-specific validation, because ionization efficiency, chromatography, and sample preparation all introduce platform-specific biases.
Fluorescence and Affinity Assay Platforms
Fluorescence-based assays read out binding events or enzymatic activity as light, which plates and imaging systems can capture in parallel across hundreds to hundreds of thousands of wells or features.
The G-quadruplex aptamer platform for Aβ42 is the clearest published example. A rationally trimmed 29-base aptamer binds Aβ42, and thioflavin T acts as a fluorescent mediator whose signal changes when the G-quadruplex structure transforms on binding. The assay remained linear from 0.01 to 100 pg/mL in spiked plasma and serum, combining ultrasensitivity with plate-based throughput [1]. On-chip aptamer screening takes the same logic further, using sequencing instruments as the readout for binding measurements across variant libraries [6].
A design principle from the biosensor literature applies broadly here: high-throughput optical, affinity, and cell-sorting platforms, including SELEX and fluorescence-activated cell sorting, can be used as surrogate assays to explore sequence-function relationships at orders of magnitude larger design space than the final measurement format, with the top candidates then validated on the end-use platform [10]. That decoupling, fast cheap screen first, definitive assay second, is one of the most reliable patterns in high-throughput protein work.
Web Servers and Computational Structure Platforms
Computational platforms analyze protein sequences and structures without new wet-lab data. They range from single-purpose servers to integrated tool collections.
iMolTalk, one of the early interactive structure analysis servers, accepts a four-character Protein Data Bank identifier or an uploaded PDB-format file and extracts sequence from coordinates, maps residues between sequence and structure, searches for contacts with cofactors and substrates, and identifies protein-protein interfaces between chains, returning results as graphics and text ready for further processing [11]. d-Omix takes InterProScan output, the standard TSV or tabular result format from a widely used domain annotation tool, and provides four services built on domain architecture: phylogenetic trees based on domain composition, domain versatility and co-presence graphs, protein similarity by domain architecture alignment, and putative interaction networks from domain-domain interaction data, letting users pick search tools such as hmmpfam or superfamily for a specific analysis [12].
Structure selection is its own bottleneck. PDBminer addresses it by searching both the Protein Data Bank and the AlphaFold Protein Structure Database for structures of input proteins and returning a quality-ranked table that reports coverage against the UniProt sequence, model quality, complex composition, and bound ligands or nucleic acid chains, with parallel execution across cores when available [13]. A broader survey of in silico motif discovery and structural prediction tools frames the core trade-off explicitly: queries vary greatly in size and scope, so the balance among speed, accuracy, and scale must drive tool choice [14]. In silico protein design extends this family, using three-dimensional structure analysis to select amino acid sequences for desired properties, a convergence of computational molecular design and protein sequence analysis that has enabled genuinely artificial proteins [15].
Workflow, Validation, and QC Software
The least glamorous family often determines whether a platform succeeds in production. Automated Clone Evaluation (ACE) was built because molecular assembly of protein expression clones had become routine in high throughput while sequence verification remained manual. ACE represents each clone as a list of multidimensional discrepancy objects describing every difference from the expected reference sequence, including the resulting polypeptide consequences, then compares that list against user-defined acceptance criteria for the number of allowable discrepancies of each type. Because criteria are parameters, the same clone set can be re-evaluated against different standards for different experiments [16]. Quality control software of this kind is what turns raw platform output into defensible results, and the MALDI isotope-distribution QC parameter mentioned earlier is the mass spectrometry analog, an objective value assigned to every spectrum so that replicate selection and contaminant removal can be automated [8].
Side-by-Side Comparison of Platform Families
The table below is the core of this bioinformatics tools comparison. Use it to narrow the field before looking at individual instruments.
| Criterion | NGS-based (targeted, BCR-seq, library screens) | Mass spectrometry (MALDI, LC-MS, FPOP) | Fluorescence and affinity assays | Computational servers and pipelines | QC and workflow software |
|---|---|---|---|---|---|
| Primary measurement | Nucleic acid sequence encoding proteins, or sequence-linked function | Mass, modification state, oxidation footprint, peptide profile | Binding affinity and activity as fluorescent signal | Structure, domains, motifs, interfaces, annotations | Discrepancy detection, spectrum quality, sample routing |
| Typical scale | Thousands to millions of features per run [6] [7] | Hundreds to thousands of features per batch [3] [9] | Thousands of variants on-chip, or full plates [1] [6] | Thousands of proteins per compute run [13] | Whole production batches [16] [8] |
| Standout strength | Pairing sequence with functional readout in one assay [2] | Direct molecular evidence, post-translational detail [8] [9] | Ultrasensitivity, low detection limits [1] | No wet lab required, reproducible, scriptable | Automates judgment calls that would otherwise be manual [16] |
| Main weakness | Indirect (reads DNA or RNA, not the protein itself) [4] | Complex prep, platform-specific bias, heavy data burden [8] | Requires a validated recognition element (antibody, aptamer) [1] | Depends on input data quality and curated databases [13] | Needs carefully specified acceptance criteria [16] |
| Error profile to watch | Platform-specific indel false positives [4] | Isobaric and near-isobaric species, overlapping spectra [8] [9] | Selectivity against matrix interference [1] | Outdated databases, wrong structure choice [13] | Criteria too loose or too strict for the experiment [16] |
| Best fit | Repertoire analysis, variant screening, clone libraries | Biopharma QC, structural footprinting, peptide profiling | Biomarker detection, binding screens, directed evolution front ends | Annotation, structure selection, design | Cores and clinical labs running any of the above at scale |
Read the table by column for a given project type, not by row. A lab whose output is sequences will live in the first column plus the last two. A lab whose output is molecular states of proteins will live in column two plus the last two.
Comparison Criteria That Decide Real Choices
Marketing materials emphasize raw throughput. In practice, six criteria decide which platform is best for a given lab, and they are rarely the ones on the brochure cover.
1. Throughput as You Actually Define It
Throughput means different things on different platforms. For the UHPLC peptide mapping workflow, throughput meant injections per day, improved roughly 10-fold from 123 minutes to 12.5 minutes per injection [9]. For the aptamer on-chip screen, throughput meant variant designs profiled per run, 11,792 across three target proteins in days [6]. For Swarm-seq, it meant homologs assayed per experiment, more than five hundred [7]. Before comparing platforms, write down the number you need: samples per week, variants per round, or residues characterized per project. Then ask each vendor or pipeline maintainer what number they can deliver for your sample type, not their benchmark sample.
2. Sensitivity and Detection Limit
For detection problems, the limit of detection is often the deciding number. The G-quadruplex aptamer platform reached 3 fg/mL for Aβ42, far below what conventional ELISA and mass spectrometry approaches achieve for this analyte in routine use, which is precisely why the authors built it [1]. If your analyte has a published detection range on a candidate platform, compare it against your required working range with your actual matrix (serum, plasma, lysate), because spiked-recovery performance does not always transfer. The Aβ42 assay maintained its linear range in plasma and serum, which is the kind of matrix evidence you want to see before committing [1].
3. Accuracy, Error Profile, and the Reference Standard
Never evaluate accuracy from a platform's own marketing. The standard method, documented in both sequencing comparisons, is to benchmark against an orthogonal reference such as Sanger sequencing. The BRCA study did exactly this and surfaced a finding that per-base quality metrics would have hidden: the PGM platform detected all indels correctly but produced 68 false-positive indel calls [4]. The MiSeq versus DNBSEQ comparison went further, computing concordance across SNVs, CNVs, and complex alleles and finding no false positives, false negatives, or discordant annotations between platforms, while still documenting real differences in basecalling quality, allelic frequency uniformity, depth, and demultiplexing efficiency [5]. When you run your own validation, report sensitivity with confidence intervals, report specificity, and report error types, not just an overall accuracy percentage.
4. Input Requirements and Sample Constraints
Sample availability kills more platform plans than accuracy does. The BRCA workflow needed only 325 ng of DNA per patient and produced similar coverage and accuracy from peripheral blood or buccal wash samples, which made it practical for routine screening [4]. The Seq-Well S3 single-cell platform was designed around paucicellular clinical specimens, and its sample hashing workflow reduces both cost and technical variation while increasing effective throughput, delivering multiomic results from low-input samples in under a week [17]. For mass spectrometry, the move from six-well to 24-well plates in the AXYS system reduced the sample mass required per experiment and expanded the analyzable sample types [3]. Write down your minimum viable input per sample, including matrix and handling constraints, before any platform shortlist exists.
5. Cost Structure
Total cost has three layers: acquisition or access, reagents per sample, and computational infrastructure. The only published cost figure in the platform comparison literature here is the projection from the BRCA study that scale-up could bring reagent cost below 200 US dollars per test, achieved specifically because the PCR-based multiplexed workflow was amenable to scale-up on both sequencers tested [4]. For most other platforms, published evaluations report throughput and performance without prices, so budget planning has to come from vendor quotes and from your own pilot runs. What the published comparisons do support is a cheaper lever: multiplexing and hashing strategies that share lanes or wells across samples cut per-sample cost and technical variation simultaneously, as demonstrated for single-cell multiomics on the Seq-Well S3 platform [17].
6. Data Analysis Burden and the Computational Layer
Every high-throughput platform shifts work from the bench to the pipeline. The scale of that shift is the criterion most often underestimated. Sequence-based screens produce read files that need alignment, variant or count calling, and quality filtering before any biological answer appears. Mass spectrometry produces spectra that need peak picking, identification, and quality sorting, which is why the isotopic-distribution QC parameter was worth a dedicated publication [8]. Structure-focused pipelines need curated inputs, which is the problem PDBminer automates by ranking PDB and AlphaFold structures against a UniProt reference sequence [13].
Plan the computational layer with the same rigor as the instrument. Section 7 of this article covers a concrete toolchain.
High-Throughput Protein Sequence Analysis Platform Options, Examined on Their Own Terms
The following sections give each major option an honest description, including where it fails.
Targeted Amplicon Sequencing on Benchtop Instruments
Benchtop sequencers such as MiSeq and Ion Torrent PGM dominate targeted protein-sequence work because they combine modest cost with fast turnaround. Their documented behavior: in the BRCA comparison, both the SOLiD 4 and the PGM produced sensitivity above 97 percent against Sanger, but their error signatures differed sharply, with SOLiD at 100.0 percent specificity and PGM generating indel false positives [4]. In the CFTR comparison, MiSeq delivered slightly superior basecalling quality while MGI's instrument delivered higher depth and demultiplexing efficiency, with complete variant concordance between them [5]. The practical takeaway is that platform choice among benchtop instruments is a choice of error profile and throughput-per-run, not a choice between accurate and inaccurate.
For protein-oriented applications such as clone validation and antibody repertoire work, benchtop platforms also serve as the readout for entirely non-sequencing assays, as the aptamer screening study demonstrated by repurposing MiSeq chemistry to profile aptamer-spike protein binding across 11,792 variants [6]. If your platform can carry a nonstandard readout, it becomes two platforms.
Single-Cell and Barcoded Sequencing Platforms
When the measurement must be per-cell rather than per-bulk-sample, platforms like Seq-Well S3 dominate. The published protocol combines antibody-oligonucleotide staining for surface protein quantification, sample hashing for multiplexing, optional SMART-seq2 bulk libraries for genetic demultiplexing, and a matched computational pipeline, all built from readily available reagents and standard equipment [17]. This family is the right answer when cell-to-cell heterogeneity in protein expression is the question. It is the wrong answer when bulk characterization suffices, because per-cell resolution costs orders of magnitude more per unit of information.
Affinity Sequencing Platforms
AAB-seq solves a specific bottleneck in antibody discovery: jointly capturing antigen-binding affinity and paired heavy-light-chain sequences at scale. Dual-labeled antigens and DNA-barcoded anti-light-chain antibodies compute an AAB score proportional to binding strength for thousands of paired native BCR sequences in one assay. Integrated with direct cloning, it retrieves affinity-guided antibodies without de novo gene synthesis. Validation against ovalbumin and the SARS-CoV-2 receptor binding domain showed AAB scores correlating strongly with ELISA results, and the workflow surfaced novel SARS-CoV-2 neutralizing antibodies with potent effector functions [2]. This is the archetype of a platform whose value is integration: it merges two measurements that previously required two separate workflows.
Mass Spectrometry Workflows
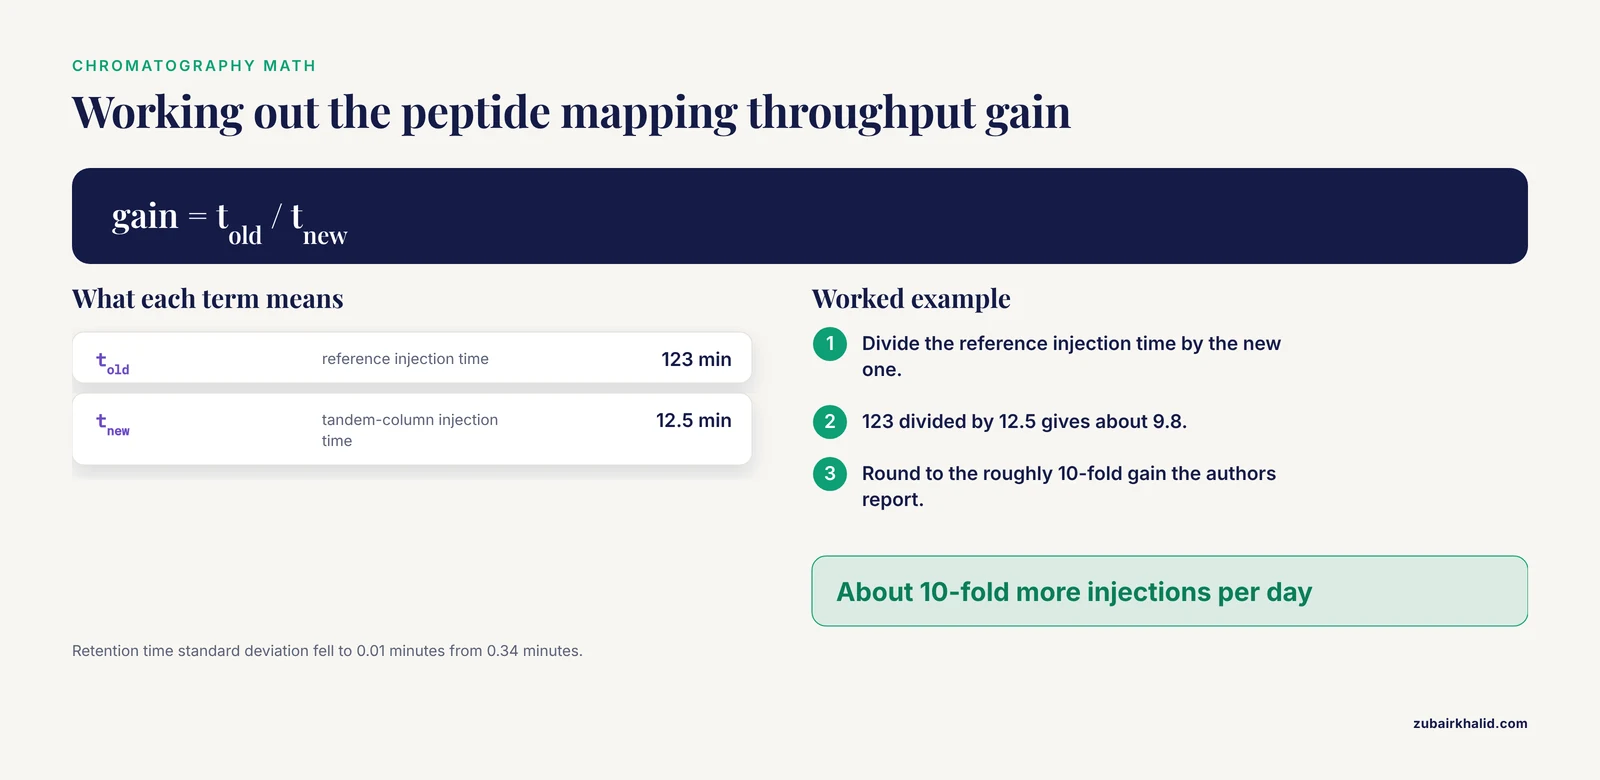
For direct protein molecular analysis, the three published designs map a decision tree. If you need structural information in living cells, in-cell FPOP on the automated AXYS platform is the documented high-throughput route, and its 24-well format expands both replicates and sample types versus the earlier PIXY setup [3]. If you need clinical peptide profiling at scale, the MALDI robotic workflow with isotopic-distribution QC sorts thousands of spectra objectively and removes contaminated or peptide-poor spectra before statistics [8]. If you need site-resolved modification data on therapeutic proteins, the tandem-column UHPLC workflow delivers a 10-fold injection throughput gain with tighter retention time control and more resolved modification sites per run [9]. These are not interchangeable. Choose by the molecular question, then by throughput.
Fluorescent Plate and On-Chip Assays
The G-quadruplex aptamer platform demonstrates what this family does best: ultrasensitive detection with simple instrumentation. Thioflavin T fluorescence reports aptamer structural transformation on Aβ42 binding, the assay is linear over four orders of magnitude of concentration, and detection reaches 3 fg/mL, with validated performance in plasma and serum [1]. The limitation is inherent to the family: every analyte needs its own validated recognition element. Building that element is the bottleneck the on-chip engineering platforms attack, using sequencing readouts to evolve aptamers against new targets in days [6].
Domain and Structure Analysis Servers
For purely computational analysis, the options divide by question. For domain architecture across a protein set, d-Omix consumes standard InterProScan files and produces phylogenies, domain graphs, architecture alignments, and interaction networks, with the option to run alternative search engines such as hmmpfam for a specific analysis [12]. For structure-level questions on a single protein, iMolTalk extracts sequences from coordinates, maps sequence positions onto structure, finds residue contacts and cofactors, and identifies chain interfaces [11]. For choosing which structure to analyze in the first place, PDBminer ranks available PDB and AlphaFold structures by coverage and quality against your UniProt reference [13]. These tools compose well, and composing them is usually more powerful than any single server alone. Their shared limitation is that server-based tools are hard to run at scale, which leads to the local pipeline question below.
Automated Validation and QC Systems
ACE deserves attention from anyone running clone production at scale. Its design insight is that clone acceptance is a policy decision, not a fact. Each clone becomes a list of discrepancy objects with polypeptide consequences, and user-defined acceptance criteria decide the pass or fail boundary. The same clone set can be re-evaluated under different criteria when the downstream experiment changes, for example when a silent mutation is acceptable for one assay and not another [16]. This parameterized approach to QC is worth copying in any high-throughput protein workflow, mass spectrometry included [8].
Pros and Cons of the Main Platform Choices
A candid high-throughput protein sequence analysis platform pros and cons assessment, beyond the table, looks like this.
Sequencing platforms. Pros: unmatched feature count per run, mature ecosystems, functional readouts can be layered on top, published validations give concrete sensitivity and specificity figures to plan against [4] [5]. Cons: they measure nucleic acids, so protein-level phenomena such as modifications, stability, and degradation are invisible, and certain platforms carry indel-prone error profiles that demand platform-aware variant filtering [4].
Mass spectrometry. Pros: direct protein evidence, the only family that reports modification states and structural footprints directly, with documented 10-fold throughput gains available through engineering rather than new instruments [9]. Cons: highest capital and expertise cost, sample-prep sensitivity, and the need for objective QC to separate real signal from spectra contaminated by polymers or overlapping peptides [8].
Fluorescence and affinity assays. Pros: extreme sensitivity (3 fg/mL demonstrated for one analyte [1]), simple readout hardware, plate formats that fit existing lab infrastructure. Cons: one validated recognition element per target, and the development cost of that element is what platforms like the on-chip screen are built to amortize [6].
Computational servers and pipelines. Pros: no wet lab, fully scriptable, free at the point of use for the documented academic servers [11] [12], and increasingly automated for the hardest step, structure selection [13]. Cons: quality ceilings set by input data and databases, web servers that do not scale past a handful of queries, and tool choices that trade speed against accuracy and scale in ways the user must manage deliberately [14].
QC and workflow automation. Pros: converts judgment calls into auditable parameters, re-evaluatable under new criteria without redoing experiments [16]. Cons: only as good as the acceptance criteria specified, and building criteria requires domain expertise that no software supplies.
Building the Computational Layer: A Practical Bioinformatics Tools Comparison
Whatever instrument you choose, the analysis pipeline decides whether its data becomes knowledge. A sensible local toolchain for protein sequence analysis has four layers, and the best bioinformatics software for each layer is stable, well-documented, and scriptable.
Layer 1, sequence ingestion and QC. Raw reads land as FASTQ or FASTA. FastQC or equivalent per-file quality summaries come first, followed by adapter and quality trimming. Do not skip this layer: the false-positive indel problem documented for one benchtop platform [4] is the kind of defect that only disciplined QC surfaces.
Layer 2, annotation and domain analysis. For a proteome-sized FASTA, the standard workhorse is InterProScan, run from the command line in its documented form:
interproscan.sh -i proteins.fasta -f TSV -goterms -paThat single command produces the InterProScan TSV files that downstream tools such as d-Omix consume directly, and d-Omix also lets you substitute alternative search engines such as hmmpfam where a specific analysis warrants it [12]. For targeted searches against curated HMM libraries, HMMER remains the standard:
hmmbuild RRM.hmm RRM_seed.msa
hmmsearch --tblout rrm_hits.tbl RRM.hmm proteome.fasta
Layer 3, structure retrieval and selection. Install PDBminer, which is distributed as an open-source package, point its input at your list of UniProt accessions, and let it rank PDB and AlphaFold structures by coverage and quality, parallelized across available cores [13]. Its output table, reporting coverage against the UniProt sequence along with ligands, complexes, and quality metadata, is the artifact you review before committing a structure to modeling or design work [15].
Layer 4, pipeline management and validation logic. Wrap layers 1 through 3 in a workflow manager so that every run is reproducible from a single entry command. Then encode your acceptance logic the way ACE does, as explicit, parameterized criteria against which each result is judged, so that a re-analysis under stricter or looser criteria never requires re-sequencing [16].
Honest caveat for this layer: web servers are excellent for exploration and terrible for production. iMolTalk illustrates both, offering a wide range of interactive structure analysis tools with user-submittable scripts, ideal for single proteins and unsuitable for a thousand [11]. The documented trade-off among speed, accuracy, and scale applies at the tool-selection level, not just the algorithm level [14]. Anything you will run weekly belongs in a version-controlled local pipeline.
Worked Scenarios
Scenario 1: An antibody discovery group needs affinity-ranked sequences for thousands of clones. The measurement is binding affinity paired with sequence, so the sequencing and affinity assay families converge. AAB-seq delivers both in one assay, with AAB scores that correlate strongly with ELISA across validation targets, and its direct cloning workflow retrieves antibodies without synthesizing genes [2]. Follow the surrogate-assay pattern from the biosensor literature: screen broadly at low cost, then validate top candidates on the definitive assay [10]. The computational layer must handle paired-chain sequence data and score calibration, which is a different pipeline than standard variant calling.
Scenario 2: A molecular diagnostics lab must choose a benchtop sequencer for a gene panel. Follow the published comparison methodology rather than vendor claims. Select a certified panel, run a matched sample set on candidate platforms, call variants with the same software, and compute concordance, sensitivity, and specificity against an orthogonal reference such as Sanger. The two published comparisons did exactly this and revealed that concordance can be perfect while quality metrics still differ, information that matters for downstream thresholds [5]. Sample input requirements, 325 ng per patient in the BRCA workflow [4], belong in the decision matrix alongside accuracy.
Scenario 3: A biologics characterization lab must increase peptide mapping capacity without buying a new mass spectrometer. The documented route is chromatographic engineering: the tandem-column UHPLC workflow raised injection throughput about 10-fold at high flow and pressure while improving retention time precision and resolving more modification sites through dual stationary phases [9]. Pair the new method with automated spectrum QC so that the added spectra volume does not overwhelm manual review, on the model of isotopic-distribution-based spectrum sorting [8].
Scenario 4: A structural biology group must annotate a proteome and pick structures for modeling. Run InterProScan locally over all sequences [12], feed the domain annotation into d-Omix for architecture-level comparisons and interaction networks, then use PDBminer to rank PDB and AlphaFold structures per protein [13]. Reserve interactive servers such as iMolTalk for spot checks on individual proteins of interest [11]. When a design project follows, in silico protein design tools take the selected structure and chosen region as input, with method selection and parameter choice documented as the critical user decisions [15].
Scenario 5: A core facility is drowning in manual clone verification. The ACE model is the fix: encode discrepancies as typed objects with polypeptide consequences, define acceptance criteria per project, and automate the accept, reject, and resequence decisions. The same framework supports re-evaluation when project requirements change, without repeating experiments [16]. The general lesson is that throughput problems in protein science are often process problems wearing an instrument costume.
Common Mistakes and Limitations
Choosing throughput before measurement type. The most expensive error. A sequencing platform cannot tell you whether a protein is oxidized, a mass spectrometer is a poor tool for screening 11,792 binding variants, and a fluorescent assay cannot discover a recognition element for a target you have none for. Match the platform family to the molecular question first [6] [9].
Trusting per-base quality metrics as a proxy for variant accuracy. The PGM platform in the BRCA study passed general quality impressions yet produced 68 false-positive indel calls, visible only against a Sanger reference [4]. Validate against an orthogonal method, with confidence intervals on sensitivity and specificity.
Ignoring error profiles in favor of average accuracy. Two platforms with identical overall accuracy can differ completely in which errors they make. The CFTR comparison found concordant variant detection but measurably different basecalling quality, allelic frequency uniformity, depth, and demultiplexing behavior between Illumina and MGI instruments [5]. Those differences matter differently depending on your variant spectrum.
Skipping matrix validation. A detection limit measured in buffer is not a detection limit in serum. The Aβ42 aptamer platform earned its clinical relevance by demonstrating the same linear range in spiked plasma and serum [1]. Demand matrix-matched performance data before trusting any sensitivity figure.
Underestimating the computational layer. Every gain in wet-lab throughput multiplies the data volume and the number of automated judgment calls. The isotopic-distribution QC parameter exists because manual spectrum review does not scale [8]. Budget pipeline development, storage, and QC engineering as first-class project components.
Treating web servers as production infrastructure. Interactive servers such as iMolTalk and d-Omix are documented, capable tools, but they are built for interactive, query-scale use [11] [12]. Production workloads need local, scripted, version-controlled equivalents.
Letting acceptance criteria freeze. ACE's core design point is that acceptance criteria are parameters, not constants, because the same clone may be acceptable for one experiment and not another [16]. If your QC thresholds are hardcoded, your platform will silently pass results that your next experiment cannot use.
One general limitation. Published platform comparisons evaluate specific sample types, panels, and software versions. Performance on your matrix, your targets, and your pipeline must be confirmed in your own pilot, and individual project decisions, particularly in clinical settings, need review by the appropriate qualified professionals in your organization.
Frequently Asked Questions
What counts as high throughput in protein analysis?
There is no single threshold, because throughput is defined per measurement. Published platforms described as high-throughput range from 24-well plate processing in mass spectrometry footprinting [3] to 11,792 binding variants profiled in a single sequencing-based screen [6]. Define your own required scale in samples or features per week, then evaluate platforms against that number rather than against a universal label.
Which platform gives the most accurate protein sequence data?
Accuracy depends on the reference method and the error type, not the brand. In one published comparison, SOLiD reached 100.0 percent specificity while Ion Torrent PGM reached higher sensitivity but produced 68 false-positive indel calls against a Sanger reference [4]. A later MiSeq versus MGI comparison found complete variant concordance with different quality profiles [5]. Validate candidate platforms against an orthogonal method on your own samples before deciding.
Do I need a sequencer for protein analysis work?
Often, yes, because proteins are characterized through their encoding sequences in most high-throughput workflows, from clone validation to antibody repertoire sequencing to functional screens that use sequencing as the readout [4] [6] [2]. But direct protein questions, such as modification mapping or oxidative footprinting, belong on mass spectrometry platforms [3] [9], and pure annotation questions need no new data at all, only computational tools [11] [12].
Can web servers replace a local analysis pipeline?
Not for production work. Web servers such as iMolTalk and d-Omix are excellent for interactive, small-scale analysis and support useful exports [11] [12], but large or recurring workloads need scriptable local pipelines so that runs are reproducible, parallelizable, and auditable. Structure selection at scale is a good example, handled by local tools such as PDBminer rather than by hand on a web form [13].
How do I validate a new platform before switching to it?
Run a matched sample set on both the candidate and your current method, analyze both with identical downstream software, and report sensitivity with confidence intervals, specificity, and error types against an orthogonal reference. This is the documented methodology from both published sequencing comparisons [4] [5], and it transfers to any measurement modality, including mass spectrometry and fluorescence assays.
What is the cheapest route to screening thousands of protein variants?
Use a surrogate assay with a cheap readout before committing to the definitive measurement. Published examples include repurposing a benchtop sequencer to profile thousands of aptamer variants against three target proteins in days [6], and the general strategy of decoupling high-throughput front-end screening from the final readout format to expand accessible design space by orders of magnitude [10]. Multiplexing and sample hashing further cut per-sample cost and technical variation in sequencing-based workflows [17].
Sources
- Highly sensitive and specific high-throughput detection of Aβ42 in clinical specimens using a G-quadruplex-structured fluorescent aptamer analysis platform.
- Rapid discovery of monoclonal antibodies via high-throughput single BCR affinity sequencing.
- Improved High-Throughput Platform for In-Cell Fast Photochemical Oxidation of Proteins via an Automated XY Stage (AXYS).
- Development of a next-generation sequencing method for BRCA mutation screening: a comparison between a high-throughput and a benchtop platform.
- Methodological Assessment of High-Throughput Sequencing Platforms: Illumina vs. MGI in Clinical-Grade CFTR Genotyping.
- High-Throughput On-Chip Screening Enables Rapid Adaptation of DNA Aptamers to SARS-CoV-2 Evolution.
- Functional analysis of natural variation in the RNA-binding protein CsrA across the bacterial domain predicts regulatory activity.
- Quality control based on isotopic distributions for high-throughput MALDI-TOF and MALDI-FTICR serum peptide profiling.
- Utilization of Tandem-Column UHPLC for High-Throughput Peptide Mapping of Therapeutic Proteins.
- High-throughput Optical Analysis to Inform Design of Electrochemical Biosensors.
- iMolTalk: an interactive, internet-based protein structure analysis server.
- d-Omix: a mixer of generic protein domain analysis tools.
- PDBminer to Find and Annotate Protein Structures for Computational Analysis.
- In silico protein motif discovery and structural analysis.
- In silico protein design: fitting sequence onto structure.
- A novel approach to sequence validating protein expression clones with automated decision making.
- A scalable, low-cost, sample hashing workflow for multiomic single-cell analysis using the Seq-Well S(3) platform.