How to Interpret Regulatory Build Activity States in Ensembl: A Guide
By Dr. Zubair Khalid, DVM, MS, PhD ·

Ensembl Regulatory Build activity states are cell-type-specific labels, active, repressed, bivalent, inactive, or no data (NA), that Ensembl assigns to each regulatory feature based on the epigenetic marks detected for that feature in that cell type. Interpreting these states correctly tells you whether a promoter, enhancer, or other regulatory region appears switched on, actively silenced, poised between the two, never used, or simply never measured in the cells you care about.
A list of genomic coordinates carries no biological meaning until it is placed in cellular context, and context is exactly what activity states provide. Epigenetic marks are chemical modifications added to DNA or to histones, the proteins that package DNA into chromatin, and they change gene activity without changing the DNA sequence itself. The Ensembl Regulatory Build integrates processed epigenetic datasets from many cell types into a single annotation layer, and its 2015 redesign was built specifically to identify regulatory regions of interest and highlight their activity across disparate epigenetic datasets [1]. That layer keeps expanding, with recent releases reporting improved regulatory annotation for human, mouse, and agricultural species [2]. If you are prioritizing variants from a genome-wide association study, annotating differentially expressed genes, or trying to understand why a gene is on in one tissue and off in another, activity states are the fastest first read on regulatory context. They are also among the most misread annotations in Ensembl, because NA looks like inactivity and inactive looks like proven nonfunction. This guide covers what the states mean, how they are assigned, how to read them in the browser and programmatically, and where interpretation most often goes wrong.
What the Ensembl Regulatory Build Is
Ensembl is an open platform that integrates publicly available genomics data across the tree of life, with more than 4,800 eukaryotic and more than 31,300 prokaryotic genomes represented as of the 2025 release [2]. Within that platform, the Regulatory Build is the annotation layer that describes regulatory DNA. It divides selected genomes into regulatory features, which are segments of DNA with an annotated regulatory role, and assigns each feature to a small set of classes: promoters, enhancers, open chromatin regions, CTCF binding sites, and transcription factor binding sites.
Each class has a concrete meaning. A promoter sits near a transcription start site, the position where RNA polymerase begins copying DNA into RNA. An enhancer acts at a distance and tends to show strong cell-type specificity. An open chromatin region is a stretch of DNA measured to be physically accessible rather than packed away. CTCF is an architectural DNA-binding protein that organizes chromatin into loops, and a transcription factor binding site is a short region where a specific regulatory protein was measured to attach. Every regulatory feature carries a stable identifier beginning with ENSR, which is how you will see features referenced in the browser, in export files, and in variant annotation output.
The build is evidence based. Ensembl does not predict regulatory regions from sequence motifs alone. The pipeline starts from processed epigenetic datasets, chiefly ChIP-seq, chromatin immunoprecipitation followed by sequencing, which maps where a marked histone or a DNA-binding protein sits across the genome, and DNase-seq, which maps open chromatin by sequencing the sites cut by the DNase I enzyme. Public datasets from large consortia and individual studies are processed, integrated, and segmented into features.
Activity states sit on top of this structure. A regulatory feature answers the question "what kind of region is this?" The activity states answer "is this region used in this particular cell type?" Because the underlying marks are measured per cell type, states are always reported per cell type, never for the genome as a whole.
Assemblies matter as well. Current human annotation sits on GRCh38, the major human reference assembly, while Ensembl maintains a dedicated mirror for the older GRCh37 assembly at grch37.ensembl.org [1]. Regulatory coordinates are assembly specific, so a feature's position on GRCh38 will not match its position on GRCh37.
The Five Ensembl Regulatory Build Activity States Explained
The table summarizes the five states, the evidence behind each, and the misreading that causes the most trouble downstream.
| State | Typical epigenetic basis | Plain-language reading | Most common misreading |
|---|---|---|---|
| Active | Activating marks present (H3K4me3 at promoters, H3K4me1 with H3K27ac at enhancers), usually with open chromatin, and no H3K27me3 | The region carries the chromatin signature of being used in this cell type | Proof that the region drives one specific gene or trait |
| Repressed | H3K27me3 present, activating marks absent | Polycomb-associated silencing is engaged at this region in this cell type | The region is permanently disabled |
| Bivalent | An activating mark and H3K27me3 both present | The region is poised, with opposing systems engaged at once | The region is half active |
| Inactive | Neither activating nor repressive marks detected | No evidence of use in this cell type | Proof the region is nonfunctional |
| NA | No relevant data for that cell type | The cell type was not measured | The same thing as inactive |
Active
An active state means the activating marks that define the feature's class were detected in that cell type and the repressive mark was not. For a promoter, the defining mark is H3K4me3, trimethylation of lysine 4 on histone H3, which clusters at the transcription start sites of genes being transcribed. For an enhancer, the defining marks are H3K4me1, monomethylation of the same lysine, often together with H3K27ac, acetylation of lysine 27 on histone H3. Open chromatin data supports the call. In practice, an active promoter state is a strong hint that the nearby gene is expressed in that cell type, and an active enhancer state means the element is likely functionally engaged. What an active state does not tell you is which gene an enhancer regulates, or in which direction the effect runs. Assigning enhancer targets requires additional evidence such as coexpression across samples or chromatin conformation data.
Repressed
A repressed state means H3K27me3, trimethylation of lysine 27 on histone H3, was detected without activating marks. H3K27me3 is written by Polycomb complexes, gene-silencing systems that maintain stable repression of genes outside the tissues where they belong. Repressed states are typical at developmental regulator genes in differentiated cells, where a cell keeps alternative fate programs locked. Repressed does not mean destroyed or permanently disabled. Polycomb repression is dynamic and can be lifted during differentiation or reprogramming, which is precisely why the state is reported per cell type rather than as a permanent verdict.
Bivalent
A bivalent state means both an activating mark and H3K27me3 were detected at the same feature in the same cell type. The classic example is a promoter carrying both H3K4me3 and H3K27me3 in embryonic stem cells, where developmental genes are held ready for later activation. Bivalent does not mean the region functions at half strength. It means two opposing regulatory systems are engaged at the same stretch of chromatin, and the outcome depends on which system wins as the cell differentiates. Treat bivalent features as context-dependent, and expect their states to resolve toward active or repressed in more committed cell types.
Inactive
An inactive state means neither activating nor repressive marks were detected in that cell type. Read it as "no evidence of use," not as "proof of nonfunction." Every assay has a detection limit, replicate agreement varies between datasets, and a feature can carry real but low-level activity that falls below the threshold used for classification. Inactive is a working conclusion drawn from the data Ensembl had, not a definitive measurement of a silent region.
NA (No Data)
NA means the cell type has no usable data for the marks needed to classify the feature. It is the single most misread state, because a table full of NA can look like a table full of silence. Absence of measurement is not absence of activity. When a cell type you care about shows NA, the honest next step is to find epigenetic data for a close surrogate cell type, or to process raw data yourself, rather than to conclude that the region does nothing.
How Ensembl Assigns Activity States, Step by Step
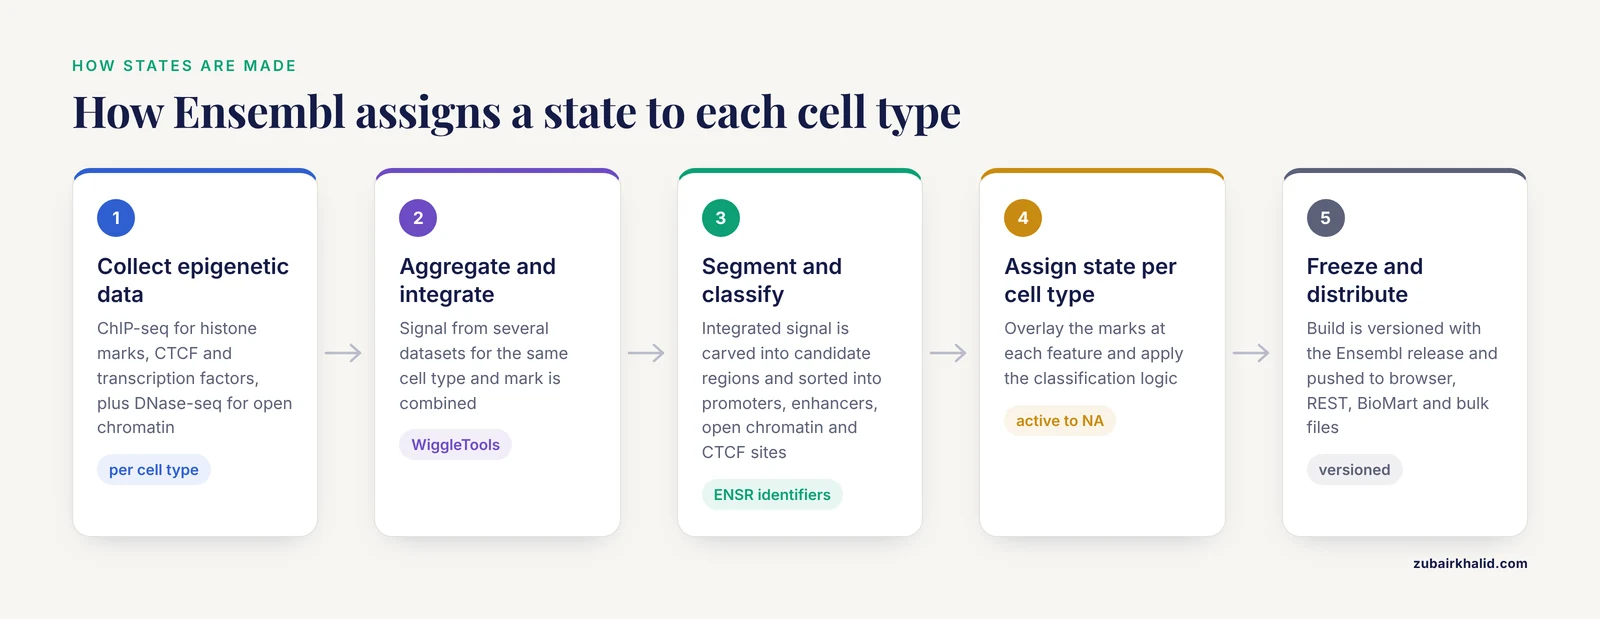
Understanding the assignment pipeline explains both the strengths and the blind spots of the annotation.
- Collect and process epigenetic datasets per cell type. The pipeline ingests ChIP-seq data for histone marks (H3K4me3, H3K4me1, H3K27ac, H3K27me3), for CTCF, and for transcription factors, plus DNase-seq data for open chromatin. Raw reads are aligned to the reference assembly and converted to genome-wide signal tracks.
- Aggregate and integrate. Where several datasets exist for the same cell type and mark, signal is combined. For summarizing very large collections of datasets and viewing them as single tracks, Ensembl introduced the WiggleTools package [1].
- Segment the genome and assign classes. The integrated signal is carved into candidate regulatory regions, which are then classified. Promoters are anchored to transcription start sites, enhancers to enhancer-like mark patterns, open chromatin regions to DNase peaks, and CTCF binding sites to CTCF signal.
- Assign a state per cell type. For each cell type with data, the pipeline overlays the marks at each feature and applies the classification logic. An activating mark present with no H3K27me3 gives active. H3K27me3 without activating marks gives repressed. Both together give bivalent. Neither gives inactive. For promoters the activating mark is H3K4me3, and for enhancers it is H3K4me1 together with H3K27ac in recent builds. Open chromatin and CTCF features are active where their supporting signal is present. Cell types with no relevant data get NA.
- Freeze, identify, and distribute. Features receive ENSR identifiers, the build is versioned alongside the Ensembl release, and the states are pushed to the genome browser, the REST API, BioMart, and bulk export files.
One caveat belongs here. The exact mark combinations have been refined between build versions as data and methods improved. Treat the logic above as the stable core, and check the regulatory build documentation for the specific release you are using before writing scripts that depend on precise rules.
Reading Activity States in the Ensembl Genome Browser: A Practical Tutorial
The steps below answer the practical question of how to interpret regulatory build activity states in Ensembl from a standing start. They also serve as a short Ensembl genome browser tutorial for the regulation layer in general. Ensembl maintains an extensive training program for deeper instruction, reachable through its training pages [2].
Step 1: Find your locus
Go to ensembl.org, type a gene symbol such as BRCA1 into the search box, and choose the human result. Open the Location tab. BRCA1 sits at 17:43,044,295-43,125,482 in GRCh38. Zoom to a window of a few hundred kilobases (kb, one kilobase is 1,000 DNA bases) or less, because regulatory features are dense around promoters and become unreadable at whole-chromosome scale.
Step 2: Turn on the Regulatory Build track
Open the configuration menu, labeled "Configure this page" on the classic site, and find the Regulation section. Enable the Regulatory Build track. Where the menu offers them, add supporting tracks such as DNase or specific histone marks for a cell type of interest. In the standard color scheme, active features are drawn in green, repressed in red, bivalent in yellow, and inactive in grey, while cell types with no data are left blank.
Step 3: Open a feature and read its activity table
Click any regulatory feature box. A popup appears with the feature class, the ENSR identifier, and a link to the full feature page. The feature page carries the information that matters: the class, the coordinates, and an activity table listing every profiled cell type with its state. This table is where interpretation actually happens, so spend your time here rather than on the track overview.
Step 4: Compare states across cell types
Scan the table for specificity. A promoter active in immune-derived cell lines and inactive in fibroblasts points to tissue-restricted regulation. A promoter active across every profiled cell type suggests housekeeping behavior. An enhancer active only in a disease-relevant cell type is a prioritization signal for any variant found inside it. While scanning, note which cell types are NA, because the gaps define the limits of what you can conclude.
Step 5: Record, export, and check the assembly
Export the feature or region from the page menus, and record three things in your notebook or script: the assembly (GRCh38 or GRCh37), the Ensembl release number, and the regulatory build version if one is given. Coordinates differ between assemblies, and Ensembl keeps the older GRCh37 assembly on a dedicated site for reproducibility with older studies [1]. The new Ensembl site, currently in beta, is progressively replacing the classic interface and will change menu names while keeping the underlying annotation [2], so anchor your notes to release numbers rather than to screenshots.
Getting Activity States Programmatically
REST API
The Ensembl REST server, which lets programs written in any language query Ensembl databases, moved to full service in the 2015 release [1]. The overlap endpoint returns regulatory features for a genomic region:
curl -H "Content-Type:application/json" \
  "https://rest.ensembl.org/overlap/region/human/7:140424943-140462325?feature=regulatory_feature"
This chromosome 7 interval is the documented example in the official REST documentation. The response reports each overlapping regulatory feature with its ENSR identifier, its class, and its activity annotation. Check the endpoint documentation for the exact response schema before writing a parser, because fields are refined between releases.
BioMart and biomaRt
BioMart, the web-based query interface, exposes regulatory features with cell-type and activity attributes under its regulation-focused mart. The biomaRt R package queries the same marts from R and is a standard route in published workflows. For example, a study of sex-biased gene regulation in the human and macaque brain used biomaRt to acquire orthologous genes from the Ensembl BioMart service before analyzing transcriptional regulation [3]. A discovery-first script avoids guessing dataset names:
library(biomaRt)
funcgen <- useMart(biomart = "ENSEMBL_MART_FUNCGEN", host = "www.ensembl.org")
listDatasets(funcgen)
Pick the human regulatory features dataset from the output, connect to it with a second useMart call, then run listAttributes() to find the activity and cell type columns before pulling data with getBM(). Confirm the mart name with listMarts() if the connection fails, since mart names shift between releases.
Bulk downloads
The Ensembl FTP site carries regulatory build exports, including a GFF3 file of regulatory features for the current human release. GFF3 is a tab-delimited annotation format with one feature per line, which loads directly into standard genomics tooling. Download the file together with its README, which documents the attribute layout, and keep the file name in your records, because it encodes the species, assembly, and build.
Variant Effect Predictor
The Variant Effect Predictor (VEP) annotates variants with predicted consequences and, in its regulatory mode, reports overlaps with regulatory build features, adding the standardized consequence term regulatory_region_variant when a variant falls inside a regulatory region. VEP has been progressively expanded across recent releases [2]. This is the practical bridge between a variant call set and activity states, because VEP output names the ENSR features a variant touches, which you can then look up per cell type.
A Worked Example: FKBP5 Variant Prioritization
FKBP5 encodes a regulator of stress-response signaling and recurs as a candidate in psychiatric genetics. One recent study genotyped eight FKBP5 polymorphisms in 347 individuals with bipolar disorder and reported that rs755658 was associated with insomnia symptoms in the subgroup with a documented stressor before the first episode, with p = 0.03 and a Benjamini-Hochberg adjusted p of 0.22 against a 0.25 threshold. The team annotated the variants functionally with Ensembl VEP together with RegulomeDB, HaploReg, and SNPnexus [4].
Here is how activity states extend that workflow.
- Locate FKBP5 on chromosome 6 and open the region in the Location view.
- Enable the Regulatory Build track and identify the promoter features over the gene plus any enhancers nearby.
- Open each feature and read the activity table. For a stress-response hypothesis, the informative entries are the profiled cell types that model immune or neural biology.
- Prioritize variants inside features that are active in the relevant cell types, and deprioritize variants in features that are inactive or NA across the panel.
- Re-run VEP with regulatory annotation enabled so the variant report names the overlapping ENSR features directly.
Two cautions apply. First, activity states describe chromatin, not causation. The FKBP5 association above is a statistical result, and an active enhancer nearby is a hypothesis generator, not a mechanism. Second, the study's own annotation predicted effects on gene expression and transcription factor binding [4], which is exactly the kind of claim that needs the tissue dimension activity states add, and also the kind of claim that should never rest on states alone.
Where Activity States Fit in Larger Research Workflows
Differential expression follow-up. Published studies routinely anchor their feature sets in Ensembl annotation. An osteoarthritis cartilage study identified 5,053 robustly expressed long noncoding RNAs (lncRNAs, RNA transcripts that do not code for proteins) annotated in the GENCODE and Ensembl databases, of which 191 were significantly differentially expressed between lesioned and preserved tissue [5]. Checking promoter activity states for those 191 in profiled cartilage-relevant cell types is a natural next step wherever such data exist.
Reproducibility through release pinning. A heart failure study cross-referenced its transcripts to Ensembl release 73 on the GRCh37 assembly and reported 105 differentially expressed lncRNAs [6]. Pinning the release and assembly is what makes regulatory lookups reproducible years later, because states change as the build evolves.
Annotation scale. Regulatory layers stack on already complex gene models. Ensembl v109 (2023) carries roughly 252,798 distinct RNA isoform annotations across 62,710 gene bodies [7], so a promoter state applies to a gene that may produce many transcripts, and promoter activity does not resolve which isoform is being regulated.
Cross-database workflows. A study of GC content (the proportion of G and C bases) and expression in chicken downloaded coding sequences, complete mRNAs, and 5' UTR sequences from Ensembl and identified CpG islands (GC-rich regions frequently found near promoters) using the UCSC Genome Browser's table tools [8]. Combining Ensembl regulatory annotation with sequence composition and other browsers is standard practice, and CpG island status is itself a clue worth reading alongside activity states.
Promoter-level functional work. A chicken LECT2 study retrieved amino acid sequences from Ensembl across species and then tested transcription factor involvement experimentally with inhibitors of the transcription factors NFκB and AP-1 [9]. Activity states sit at the start of pipelines like that one, pointing at which regulatory regions and factors deserve bench follow-up.
Species Coverage and Build Availability
Human has the deepest regulatory annotation, mouse follows closely, and recent Ensembl releases report improved regulatory annotation extending to agricultural species [2]. Coverage narrows quickly outside these groups because activity states require epigenetic datasets, and most species have none. For plants, researchers commonly work through Ensembl Plants, as in a study that identified 35 members of the maize Snf2 chromatin-remodeling gene family from the Ensembl Plants database [10]. For parasitic worms, WormBase ParaSite provides genomes and annotation for more than 100 helminth species, developed in collaboration with Ensembl Genomes and released three to six times per year [11]. The practical rule is simple. Before interpreting activity states, confirm that the species has a regulatory build and that the cell types you need are profiled. Where they are not, the states do not exist, and no interpretation should be forced onto the gap.
Common Mistakes and Limitations
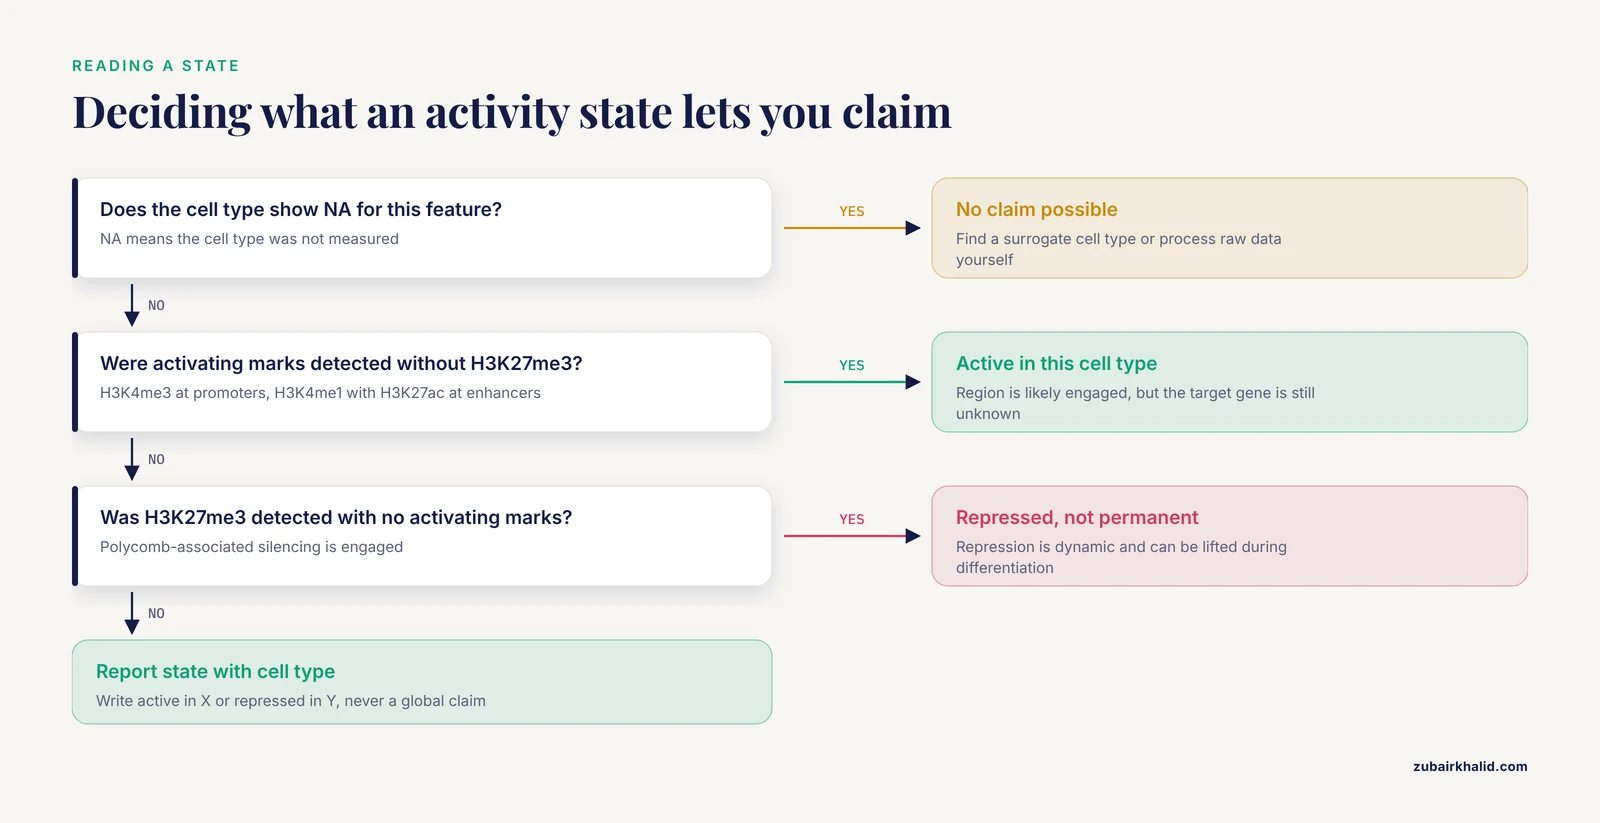
Most errors in Ensembl regulatory build activity states interpretation trace back to a handful of habits.
- Reading NA as inactive. NA means unmeasured. A cell type with no data tells you nothing about the region, and treating NA rows as silent rows will quietly corrupt any downstream prioritization.
- Reading inactive as proven nonfunction. Inactive means no marks were detected, within the limits of the assays and thresholds used. Low-level or condition-specific activity can escape detection.
- Dropping the cell type from the claim. "This enhancer is active" is an incomplete sentence. States exist per cell type, so every claim should read "active in X" or "repressed in Y."
- Assigning enhancer targets from states alone. Activity describes the chromatin at the feature, not the gene it contacts or the direction of its effect. Target assignment needs coexpression, chromatin conformation, or perturbation evidence.
- Mixing assemblies. GRCh38 and GRCh37 coordinates differ, and features are assembly specific. Confirm the assembly before joining regulatory data with variant or gene coordinates from another source [1].
- Ignoring release drift. Features can change class or state between builds as data accumulate and rules are refined. Record the release number with every analysis, as reproducible studies do [6].
- Overreading bivalent. Bivalent means both mark systems are engaged, not that the region is functioning at half strength. Expect bivalent states at developmental genes in pluripotent and early differentiating cells.
- Treating the build as a complete catalog. The build contains only regions supported by the integrated data. Unprofiled cell types, unmeasured marks, and unprocessed tissues are absent by construction, not because nothing is there.
Quick Review
- There are five states: active, repressed, bivalent, inactive, and NA.
- States are always per cell type, never global.
- The mark logic: H3K4me3 defines active promoters, H3K4me1 with H3K27ac defines active enhancers, H3K27me3 marks repression, both together give bivalent, neither gives inactive, and no data gives NA.
- NA is the most dangerous state to misread, because it means unmeasured, not silent.
- Record the assembly (GRCh38 or GRCh37) and the Ensembl release number every time.
- Access routes: the browser, the REST API, BioMart and biomaRt, FTP GFF3 exports, and VEP regulatory annotation.
- Coverage is species- and cell-type-limited, deepest for human, and absent where no epigenetic data exist.
Frequently Asked Questions
Each answer below opens with the direct response, starting with the question people ask first about what the states actually mean.
What does an NA activity state mean in Ensembl?
NA means no epigenetic data were available for that cell type, so the feature could not be classified. It is not evidence of inactivity, and it should not be treated as silence in any downstream analysis.
What is the difference between inactive and repressed?
Repressed means the repressive mark H3K27me3 was detected, indicating engaged Polycomb-associated silencing. Inactive means neither activating nor repressive marks were detected, so there is no positive evidence of either use or silencing.
Which cell types does the Ensembl Regulatory Build cover?
The build covers cell types with public epigenetic datasets processed by Ensembl, largely well-characterized cell lines and primary cells. Open any regulatory feature page to see the exact list of cell types and the state assigned to each.
How do I download activity states in bulk?
Use the regulatory build GFF3 export on the Ensembl FTP site, query the regulation mart through BioMart or biomaRt, or pull specific regions through the REST overlap endpoint. Record the release number with every download so results stay reproducible.
Are activity states available for species other than human and mouse?
Human has the deepest coverage, mouse follows, and regulatory annotation is expanding to agricultural species. Most other species, including many plants and parasites served through Ensembl Plants and Ensembl Genomes collaborations, lack epigenetic data, so no activity states exist for them.
Why did activity states change between Ensembl releases?
The build is updated as new datasets and refined classification methods are integrated, so individual features can change class or state over time. Pin the assembly and release number for any analysis you want to reproduce later.
Sources
- Ensembl 2015.
- Ensembl 2025.
- Human-specific protein-coding and lncRNA genes cast sex-biased genes in the brain and their relationships with brain diseases.
- Association of FKBP5 gene polymorphism with insomnia symptoms in the depressive episodes of stress-related bipolar disorder.
- Elucidating Epigenetic Regulation by Identifying Functional cis-Acting Long Noncoding RNAs and Their Targets in Osteoarthritic Articular Cartilage.
- Right ventricular long noncoding RNA expression in human heart failure.
- A bioinformatic survey of RNA isoform diversity and expression across 9 GTEx tissues using long-read sequencing data.
- Impact of GC content on gene expression pattern in chicken.
- Transcriptional regulation of chicken leukocyte cell-derived chemotaxin 2 in response to toll-like receptor 3 stimulation.
- Exploring the Roles of the Swi2/Snf2 Gene Family in Maize Abiotic Stress Responses.
- Using WormBase ParaSite: An Integrated Platform for Exploring Helminth Genomic Data.