Detect Sample Mix-up RNA-seq: Step-by-Step Guide
By Dr. Zubair Khalid, DVM, MS, PhD ·

By the end of this guide you will be able to detect sample mix-up in RNA-seq data at three levels of evidence, confirm a suspected swap with genotype-based fingerprinting, and re-align confirmed swaps so downstream analyses stay valid. You will screen a full cohort with expression correlation, call genotypes from the RNA alignments, score every sample against a genotyping array with Picard, and run DRAMS, a published tool built specifically to detect and re-align mixed-up samples in multi-omics studies [1].
Have the following installed and on hand before you begin:
- samtools and bcftools (any recent HTSlib-based release)
- GATK 4 and Picard
- STAR or HISAT2 alignments already produced, plus featureCounts or another counting tool output
- R 4.x with the edgeR, pheatmap, and data.table packages
- A reference FASTA and the matching gene annotation (GTF)
- Your sample metadata sheet with tissue, batch, sex, and donor ID
- A genotyping array VCF for the same donors, if one exists
- The DRAMS source code from its GitHub repository, https://github.com/Yi-Jiang/DRAMS [1]
Every command below assumes you run it from a working directory that holds your BAM files, count matrix, metadata sheet, and reference files. Illustrative output blocks show the shape of the result, not values from your data.
Why Sample Mix-ups Happen and Why They Matter in RNA-seq
A sample mix-up means the reads or the count matrix labeled for donor A actually come from donor B. The two classic causes are wet-lab swaps during extraction, library construction, or pooling, and dry-lab swaps during renaming, merging, or metadata joining. Both produce the same downstream symptom: the RNA-seq signal no longer belongs to the phenotype or genotype it is paired with.
The consequence is not cosmetic. The DRAMS authors developed their tool precisely because sample mix-ups weaken statistical power and can generate false findings in integrative multi-omics studies [1]. In their application to the PsychENCODE BrainGVEX project, they detected and corrected 201 mix-ups, which was 12.5 percent of all data generated in that study, and correcting those swaps, including 21 that involved racial identity errors, increased the number of QTL findings at FDR below 0.01 by an average of 1.62-fold [1]. A single eQTL or differential expression cohort can absorb a large silent loss of power from a modest number of swapped labels.
RNA-seq adds a wrinkle that pure DNA sequencing does not have. Expression levels differ by tissue, treatment, and batch, so two samples from the same donor can look quite different while two samples from different donors in the same condition can look similar. That is why the reliable approach for a mixed-up sample uses identity markers that do not depend on expression state, primarily genotypes, and uses expression only as a fast first-pass screen.
Signals You Can Use to Detect a Sample Mix-up in RNA-seq
Expression profile similarity
Each donor carries thousands of expressed genes. If you normalize counts, take the log scale, and correlate samples pairwise, true replicate pairs and same-donor pairs across conditions tend to cluster together. A swapped sample shows up as a row of the heatmap that correlates strongly with the wrong group. This signal is cheap to compute and belongs in every first-pass QC.
Expression similarity is not proof. Tissue, RNA quality, and batch can mimic or mask it, so treat it as a screening signal that points you toward the genotype tests in the later steps.
Genotype concordance
RNA-seq reads cover thousands of exonic single nucleotide variants. Calling genotypes from the RNA BAMs and comparing them to a genotyping array, an existing DNA VCF, or a reference panel turns identity checking into a hypothesis test. If sample 01 RNA carries the donor 02 genotypes at hundreds of informative sites, you have found a mix-up. The DRAMS framework is built on exactly this kind of cross-omics data relationship, using a logistic regression model followed by a modified topological sorting algorithm to infer the true sample identities from the relationships among omics layers [1].
Sex markers and other hard markers
Reads mapping to Y-linked genes such as DDX3Y, KDM5D, and RPS4Y1 give a fast binary check. A sample recorded as female donor with thousands of counts in these genes, paired with a male sample that has almost none, is a classic signature of a swapped tube or a swapped row in the metadata. Exclude pseudoautosomal regions on the Y chromosome, because reads there map from both sexes. Mitochondrial heteroplasmy and a handful of highly individual insertion-deletion sites can serve the same role when sex is not informative.
Before You Start: Software and Input Files
Install the command line tools into a clean environment so versions stay reproducible:
conda create -n mixup-check -c bioconda -c conda-forge \
  samtools bcftools gatk4 picard subread
conda activate mixup-check
In R:
install.packages("BiocManager")
BiocManager::install(c("edgeR", "pheatmap", "data.table"))
Download DRAMS from the project repository so you have the reference implementation for the re-alignment step [1]:
git clone https://github.com/Yi-Jiang/DRAMS.gitPrepare these inputs and record each one in a manifest file:
- One coordinate-sorted, indexed BAM per sample from the splice-aware aligner.
- A raw gene count matrix, genes by samples, with matching column names.
- A metadata sheet mapping sample IDs to donor IDs, tissue, sex, and batch.
- A reference FASTA and GTF that exactly match the genome build used for alignment. A build mismatch is itself a common RNA seq error, so check this first if anything downstream looks wrong.
- A VCF of germline genotypes for the same donors, ideally from a genotyping array or matched DNA WGS. If you have none, Step 4 still works in pairwise mode, comparing RNA-derived genotypes between samples.
Step-by-Step: Detect a Sample Mix-up in RNA-seq
Step 1. Reconcile metadata and file names
Most dry-lab swaps are introduced when sample sheet rows and BAM file names get out of sync. Before touching the data, rebuild the mapping from the raw sequencing facility output rather than from a hand-edited spreadsheet:
ls *.bam | sed 's/.bam$//' > bam_names.txt
cut -f1 metadata.tsv > sheet_ids.txt
sort bam_names.txt > b.sorted
sort sheet_ids.txt > s.sorted
diff b.sorted s.sorted
Expected output for a clean set is no diff output at all. If diff prints lines, you have IDs in one file that are absent in the other, which is the first place a swap hides. Fix the sheet, then freeze it and version control it.
Also record library layout, strandedness, and read length per sample, because those protocol variables drive several common errors later, including a low-correlation pattern that looks exactly like a swap but is actually a strandedness mismatch.
Step 2. Screen every pair of samples with expression correlation
This is the fastest way to detect sample mix-up in RNA-seq across a whole cohort, and it costs minutes of compute. The idea is to normalize counts, select the most variable genes, and cluster the samples. Same-donor and same-condition samples should form visible blocks.
library(edgeR)
library(pheatmap)

counts <- read.delim("counts.txt", row.names = 1, check.names = FALSE)
meta   <- read.delim("metadata.tsv", stringsAsFactors = FALSE)

keep <- rowSums(cpm(counts) > 1) >= 3
counts <- counts[keep, colnames(counts) %in% meta$sample_id]

y <- DGEList(counts)
y <- calcNormFactors(y)
logcpm <- cpm(y, log = TRUE, prior.count = 1)

vars <- apply(logcpm, 1, var)
top <- names(sort(vars, decreasing = TRUE))[1:5000]
cor_mat <- cor(logcpm[top, ], method = "pearson")

pheatmap(cor_mat,
         cluster_rows = TRUE,
         cluster_cols = TRUE,
         border_color = NA,
         filename = "sample_correlation_heatmap.pdf")
Expected output is a square heatmap, one row and column per sample. A clean cohort shows a strong diagonal block structure. A swapped pair shows two samples that each sit inside the wrong cluster, often with their highest off-diagonal correlation pointing at each other.
To list the most suspicious pairs numerically:
library(data.table)
pairs <- as.data.frame(as.table(cor_mat))
names(pairs) <- c("sample1", "sample2", "r")
pairs <- pairs[as.character(pairs$sample1) < as.character(pairs$sample2), ]
setorder(pairs, r)
head(pairs, 20)
Illustrative output:
        sample1      sample2      r
 1 Sample_07_r1 Sample_11_r1 0.412
 2 Sample_03_r1 Sample_04_r1 0.558
 3 Sample_09_r2 Sample_09_r1 0.612
As practical tips for interpreting this screen, technical replicates from the same tissue typically land well above 0.9 in Pearson correlation on the top variable genes, biological replicates within a condition cluster lower, and cross-tissue or cross-batch pairs drift lower still. Do not set a single universal cutoff. Instead, look for samples whose correlation pattern contradicts the metadata, for example a replicate pair that correlates with each other no better than with random samples. Those outliers graduate to the genotype tests.
One common failure mode here is comparing samples across different tissues or protocols and concluding the whole cohort is swapped. Brain and liver from the same donor correlate far worse than two replicates from the same tissue. Interpret every correlation against an appropriate within-stratum background.
Step 3. Call genotypes from the RNA-seq alignments
Genotypes survive tissue differences and batch effects, which is what makes them the gold signal for identity. The standard GATK workflow for RNA-seq variant calling splices out N cigar elements first, then calls variants with settings adjusted for spliced RNA data:
samtools index sample_01.Aligned.sortedByCoord.out.bam

gatk SplitNCigarReads \
  -R reference.fa \
  -I sample_01.Aligned.sortedByCoord.out.bam \
  -O sample_01.split.bam

gatk HaplotypeCaller \
  -R reference.fa \
  -I sample_01.split.bam \
  -O sample_01.raw.vcf.gz \
  -dont-use-soft-clipped-bases \
  -stand-call-conf 20 \
  -L exons.interval_list
Key parameters and why they matter:
-Rmust point at the same reference FASTA used during alignment, with a matching.faiand.dictin the same directory. A mismatch produces empty or uninterpretable VCFs.-L exons.interval_listrestricts calling to exonic space, which cuts runtime dramatically and removes intronic calls you cannot trust from spliced reads.-dont-use-soft-clipped-basesavoids calling on the soft-clipped overhangs that aligners produce around splice junctions.-stand-call-confsets the minimum variant calling quality score. The value 20 is the setting documented in the GATK RNA-seq short variant workflow.
Next apply the hard filters from the same GATK RNA-seq workflow, which account for the lower mapping quality and strand-bias behavior of RNA data, then keep only sites that pass:
gatk VariantFiltration \
  -R reference.fa \
  -V sample_01.raw.vcf.gz \
  -O sample_01.filtered.vcf.gz \
  -filter "QD < 2.0" -filter-name QD2 \
  -filter "FS > 60.0" -filter-name FS60 \
  -filter "MQ < 40.0" -filter-name MQ40

bcftools view -f PASS sample_01.filtered.vcf.gz \
  -Oz -o sample_01.pass.vcf.gz
bcftools index -t sample_01.pass.vcf.gz
Run this for every sample in the cohort, then merge into one multi-sample VCF so all samples carry genotypes at a common site list:
bcftools merge -Oz -o rna_genotypes.vcf.gz \
  sample_01.pass.vcf.gz sample_02.pass.vcf.gz
Expect fewer and noisier calls than you would get from DNA sequencing. Allele-specific expression, RNA editing, and uneven coverage mean RNA-derived genotypes carry more error. That is acceptable for identity work, because hundreds of concordant or discordant sites easily overwhelm the noise, but it means you should not use these calls for anything else.
Step 4. Check fingerprints against the genotyping array
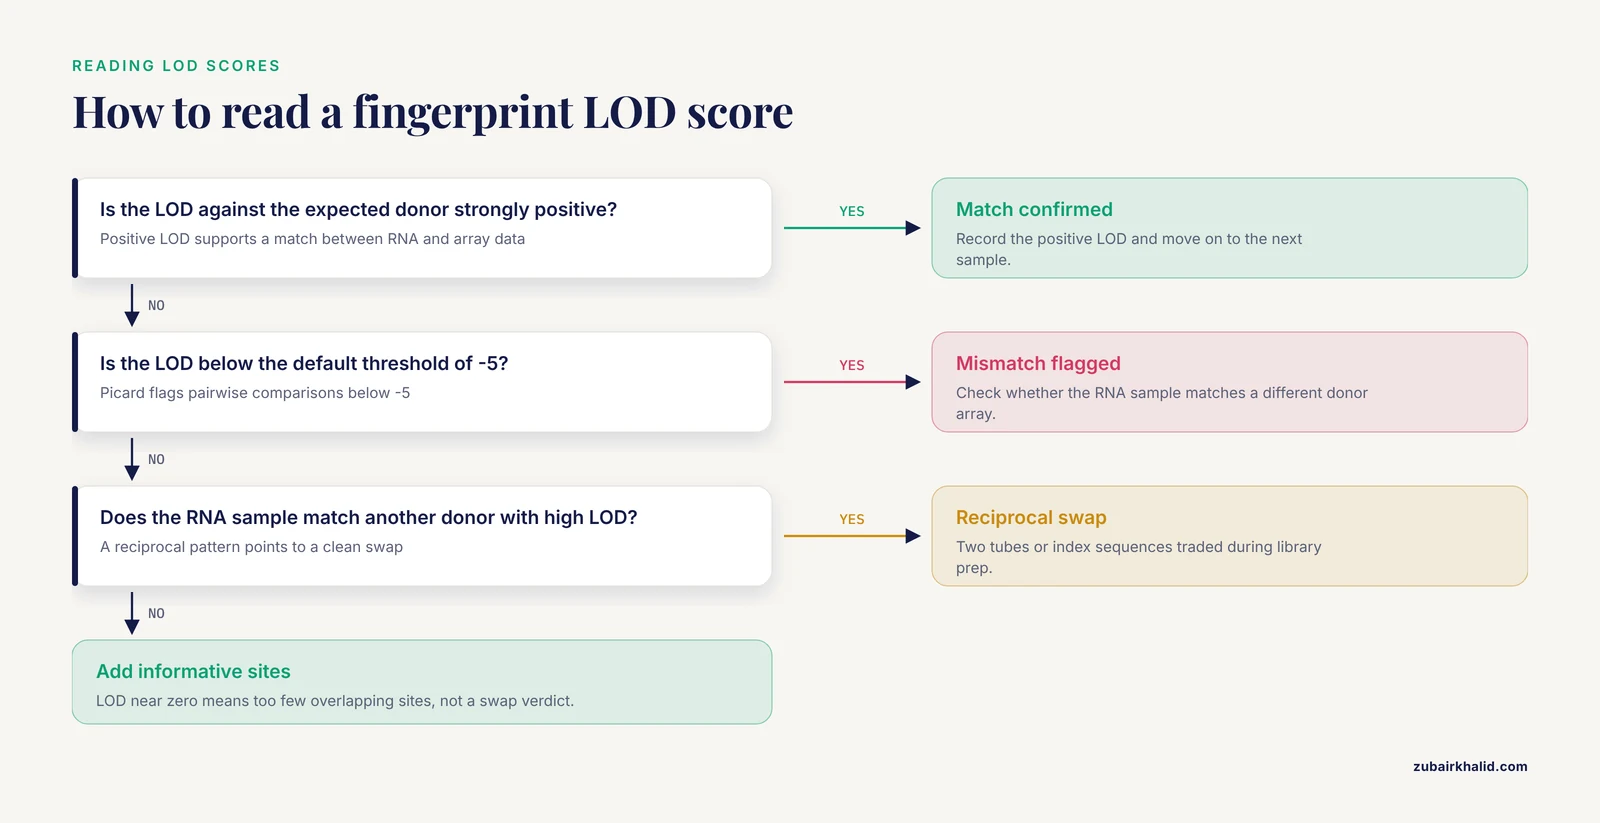
If your donors have array genotypes, compare each RNA-derived genotype set against the corresponding array genotype set with Picard CrosscheckFingerprints. The tool computes a log-odds, or LOD, score for the hypothesis that two datasets come from the same source person versus different people. Positive LOD supports a match, strongly negative LOD supports a mismatch, and Picard flags pairwise comparisons below its default LOD threshold of -5.
picard CrosscheckFingerprints \
  INPUT=rna_genotypes.vcf.gz \
  INPUT=array_genotypes.vcf.gz \
  OUTPUT=crosscheck_metrics.txt \
  EXPECT_ALL_GROUPS_TO_MATCH=false
Key parameters:
INPUTaccepts a VCF with sample genotypes, and you can pass the merged RNA VCF and the array VCF together so every RNA sample is crosschecked against every array sample in one run.EXPECT_ALL_GROUPS_TO_MATCH=falselets the run finish and report all pairwise comparisons even when it finds mismatches. Setting it to true aborts at the first failure, which is useful as a pass or fail gate but hides the full swap pattern.LOD_THRESHOLDoverrides the default -5 cutoff if you want stricter or looser flagging.
Illustrative output table:
SOURCE          TARGET            LOD_SCORE   LOD_THRESHOLD
Sample_01_RNA   Donor_01_ARRAY     41.7       -5.0
Sample_01_RNA   Donor_02_ARRAY    -37.2       -5.0
Sample_02_RNA   Donor_02_ARRAY     44.9       -5.0
Sample_03_RNA   Donor_04_ARRAY    -28.6       -5.0
Sample_03_RNA   Donor_03_ARRAY     39.1       -5.0
Read this as a bipartite assignment problem. In the illustrative block above, the RNA sample for donor 01 matches the array of donor 02 and matches nothing else, and donor 03 RNA matches donor 04. That pattern is a clean reciprocal swap, most often two tubes or two index sequences traded during library preparation. LOD scores near zero mean uninformative data, usually too few overlapping sites, and need more depth or more sites rather than a swap verdict.
A practical tip when no array exists: run CrosscheckFingerprints on the merged RNA VCF alone. RNA samples from the same donor will match each other with high LOD, so a replicates-across-batches design gives you an internal fingerprint reference even without external genotypes.
Step 5. Run sex-marker checks as a fast cross-check
Sex checks cost seconds and catch the single-sample swaps that pairwise expression screens can miss. First, get raw mapping density on the Y chromosome from the aligner index stats:
samtools idxstats sample_01.bam | awk '$1 ~ /chrY/'Illustrative output for a sample annotated as male:
chrY 57227415 83611 2455Then compute counts specifically in well-annotated Y-linked body genes, excluding the pseudoautosomal regions:
featureCounts \
  -a y_gene_body.gtf \
  -O \
  -o y_counts.txt \
  sample_01.bam sample_02.bam sample_03.bam
Build the Y GTF by extracting gene records for DDX3Y, KDM5D, RPS4Y1, USP9Y, and similar loci, with gene bodies trimmed to avoid the pseudoautosomal boundary. A sample whose recorded sex disagrees with the Y-gene read counts, with a change of several orders of magnitude between the two clusters, is either mislabeled or swapped. Resolve the disagreement with the genotype evidence from Step 4 before touching anything.
Step 6. Re-align confirmed mix-ups with DRAMS
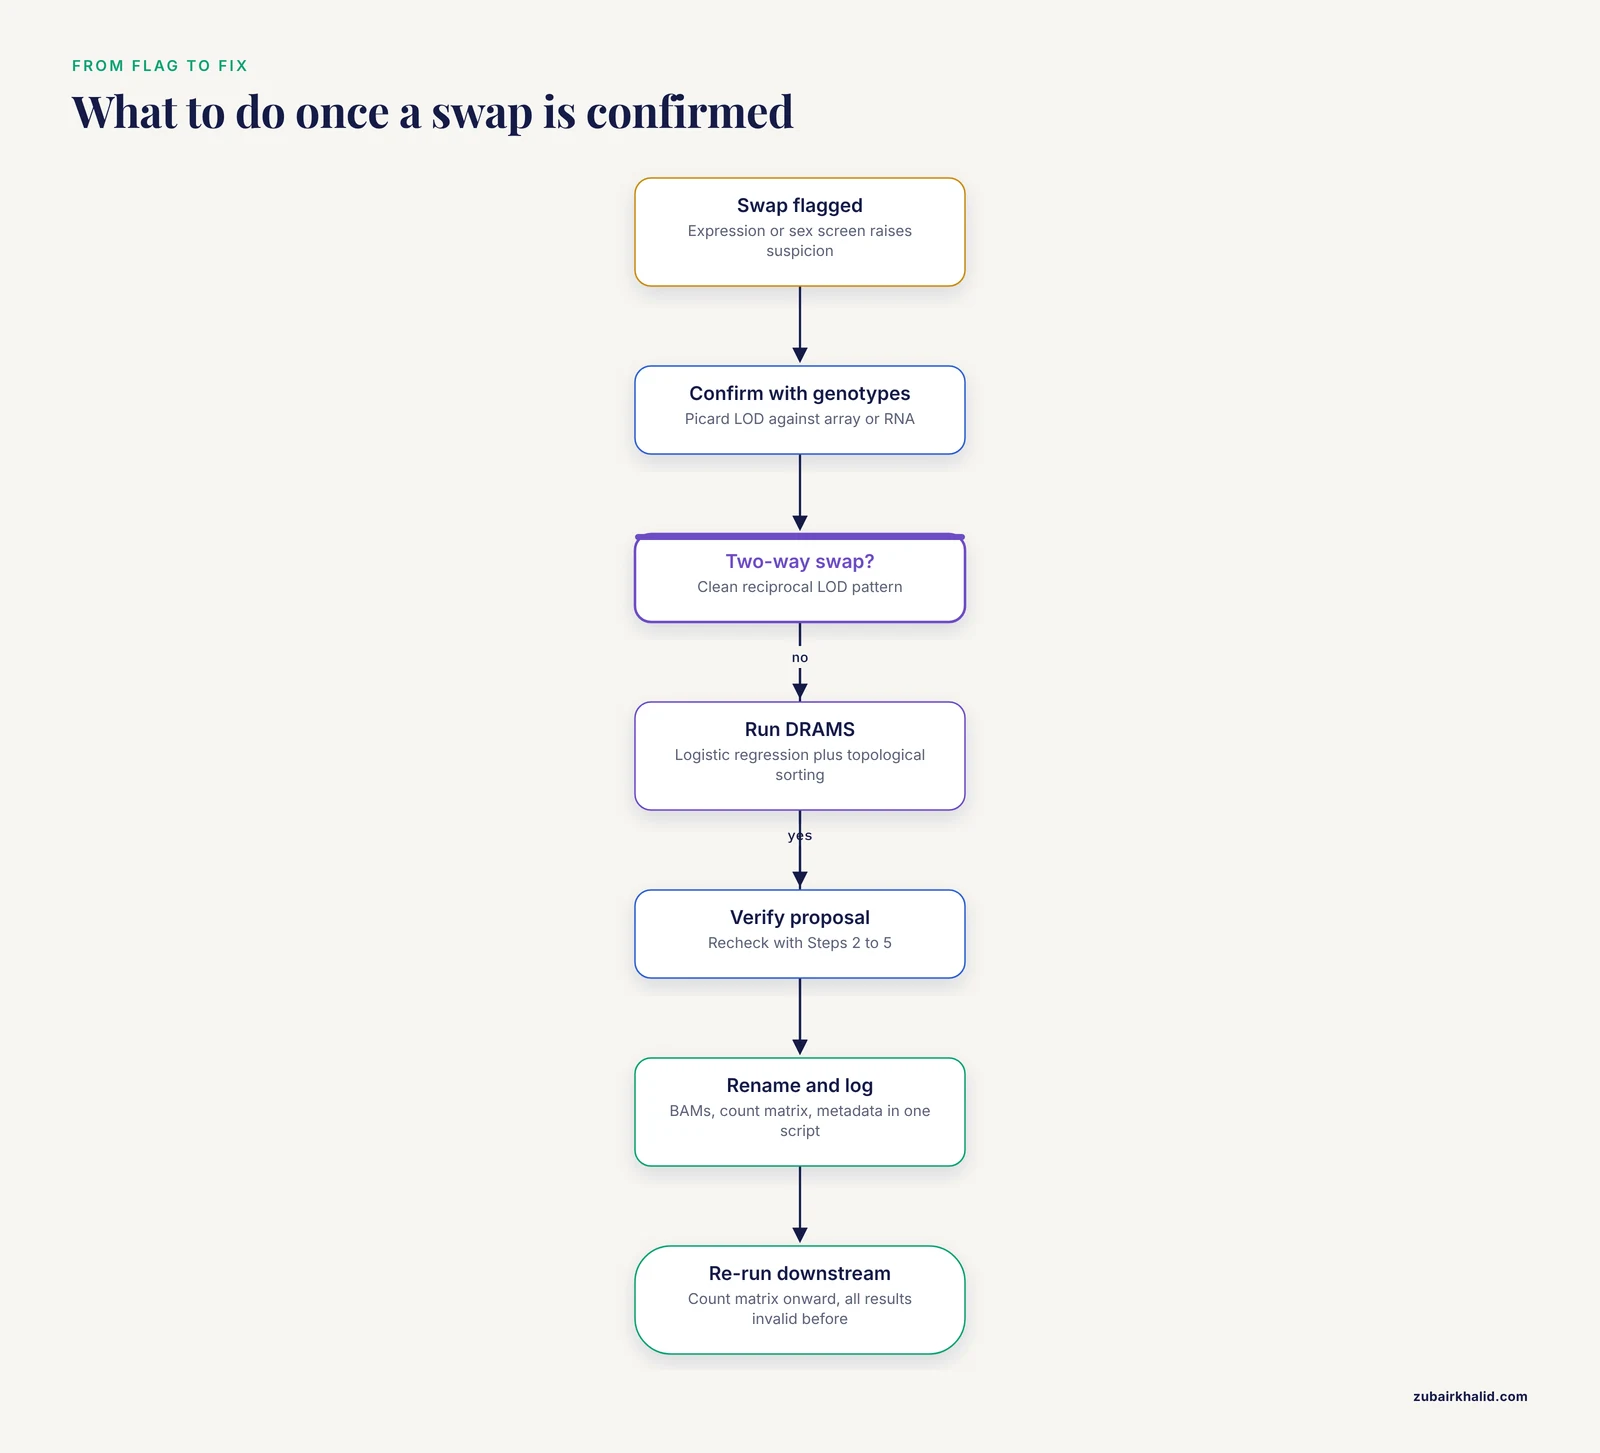
Once screening flags swaps, the question shifts from whether a mix-up exists to which samples belong to which donor, and pairwise scores alone cannot always resolve a tangled graph of multi-way swaps. DRAMS addresses this directly. It scores the relationships between omics data layers with a logistic regression model and then applies a modified topological sorting algorithm to infer the most likely true identities for each data object [1].
The tool was designed for integrative studies that hold several data types per donor, such as genotype, DNA methylation, RNA-seq, and miRNA expression. Its documented behavior is that performance improves as more omics types are available and as the fraction of mixed-up samples shrinks [1], so feed it every data layer your project has.
To run it, clone the repository, place your matrices in the input layout the repository README specifies, and follow the documented run procedure for the logistic regression scoring and the topological sorting stages [1]:
git clone https://github.com/Yi-Jiang/DRAMS.git
cd DRAMS
Inputs you should prepare for DRAMS, following the repository documentation:
- One expression or genotype matrix per omics type, samples by features, with consistent sample identifiers.
- A sample annotation file that records the current, possibly wrong, labels.
- Any external reference panel you want to use for group checks, which is how the BrainGVEX analysis re-assigned the misidentified racial group memberships against the 1000 Genomes panel [1].
Outputs take the form of pairwise similarity scores across omics layers, a detected swap structure, and a proposed re-alignment of each data object to its true sample identity. Treat the proposed re-alignment as a strong recommendation that you verify with the direct checks in Steps 2 through 5 before renaming files in your pipeline.
Step 7. Re-run QC and document the correction
After applying any re-alignment, repeat the expression heatmap from Step 2 and the fingerprint check from Step 4 on the corrected dataset. A clean result shows cluster structure that matches the metadata and positive LOD scores on every expected donor pair. Then do three things:
- Write a correction log that names every affected sample, its old and new identity, the evidence, and the date, and store it beside the metadata sheet.
- Re-run your downstream steps from the count matrix onward, because every differential expression, eQTL, and co-expression result computed before the correction is invalid for the affected samples.
- Report the swap pattern to the sequencing facility. Recurrent swaps concentrated in one batch, one plate, or one index set point to a fixable process error upstream of your pipeline.
Key Tools and Metrics at a Glance
| Signal | Tool | Input | What a mix-up looks like | Practical note |
|---|---|---|---|---|
| , - | , - | , - | , - | , - |
| Expression correlation | edgeR plus pheatmap in R | Gene count matrix, metadata | Sample clusters with the wrong group, outlier off-diagonal correlations | Fast first pass, not proof, sensitive to tissue and batch |
| RNA-derived genotypes | GATK HaplotypeCaller on split BAMs | Coordinate-sorted RNA BAMs, reference FASTA, exon intervals | Genotypes match the wrong donor | Use GATK RNA-seq hard filters, expect noisier calls than DNA |
| Fingerprint LOD | Picard CrosscheckFingerprints | RNA VCF plus array VCF, or RNA VCF alone | Strongly negative LOD against the expected match | LOD near zero means too few informative sites, not a verdict |
| Sex markers | samtools idxstats, featureCounts on Y-gene GTF | BAM files, Y-gene annotation | Recorded sex contradicts Y-gene counts | Exclude pseudoautosomal regions |
| Multi-omics re-alignment | DRAMS | Multiple omics matrices, sample annotation | Logistic regression plus topological sorting infers true IDs | More omics types and fewer swaps improve performance |
Common Errors and Exact Fixes
Could not load the index from samtools or bcftools. The BAM or VCF has no index file, or the index is stale after the file changed. Run samtools index file.bam or bcftools index -t file.vcf.gz and rerun the command.
GATK fails on the reference dictionary. HaplotypeCaller exits with a reference validation error when the .dict or .fai is missing or mismatched. Regenerate both with samtools faidx reference.fa and gatk CreateSequenceDictionary -R reference.fa, and confirm the contig names match the BAM header exactly, including the chr prefix convention.
File is not coordinate sorted during SplitNCigarReads. The aligner output was never sorted, or a downstream step reordered it by name. Run samtools sort -o sorted.bam unsorted.bam followed by samtools index, and feed the sorted, indexed file forward.
cannot allocate vector of size in R. The count matrix is large and the correlation step materializes a dense square matrix. Subsample to the top several thousand variable genes, as in the Step 2 code, or compute correlations in blocks with data.table rather than loading the full matrix of pairwise values.
Object of type closure is not subsettable in R. You used a function name as a variable, most often by naming a data frame df after calling something that uses df, or by calling a variable c. Rename the object and rerun the block.
Picard CrosscheckFingerprints reports everything near zero LOD. This is not a software error, it is an RNA seq error pattern caused by too few overlapping informative sites between the RNA-derived calls and the reference genotypes. Merge more samples to widen the site list, relax the exon interval to include UTRs, or switch the reference to a denser SNP source. High expression bias at any single locus is normal, so judge on the aggregate LOD rather than any site.
Common Mistakes and Limitations
- Relying on expression alone. A heatmap is a screen, not a verdict. Tissue identity, RNA integrity, strandedness mismatches, and batch effects all reshape expression correlations, so any swap call should rest on genotype evidence or a joint multi-omics model such as DRAMS [1].
- Applying one universal correlation cutoff across tissues. Cross-tissue correlations from the same donor can sit below same-tissue correlations from different donors. Always interpret against a within-stratum background.
- Treating an RNA genotyping pipeline as if it were DNA genotyping. RNA-derived genotypes carry allele-specific expression bias and RNA-editing artifacts. They are excellent for identity checks at hundreds of sites and poor for precision genotyping of individual loci.
- Forgetting the pseudoautosomal regions in sex checks. PAR1 and PAR2 recombine with the X chromosome and carry reads in both sexes, so an untrimmed Y-gene interval list produces false female-to-male calls.
- Fixing labels in the spreadsheet but not in the BAM headers and count matrix. A half-applied correction creates a new, harder-to-detect inconsistency. Rebuild the count matrix and rename read groups in one scripted step, then rerun QC.
- Assuming a strong duplicate-looking correlation means contamination rather than a swap. Contamination, usually from index hopping, shows as a mixture, with heterozygote allele fractions shifted away from their expected 0.5 and 1.0 values. A clean swap shows the full genotype set of the other donor. Estimate allele fractions at heterozygous array sites to separate the two.
- Not re-running downstream analyses after correction. Correcting the sample sheet without re-running the pipeline leaves published or archived results anchored to the wrong pairing, which is the exact failure mode that motivated DRAMS in the first place [1].
- Skipping the written correction log. Undocumented manual fixes become indistinguishable from new errors the next time anyone audits the cohort.
These checks screen and resolve label errors at the dataset level. Ambiguous or stubborn cases, for example low-depth RNA samples with no matching genotype data, benefit from review by an experienced bioinformatician working directly with the sequencing facility records.
Frequently Asked Questions
How common are sample mix-ups in RNA-seq studies?
They occur at rates high enough to warrant routine screening in large projects. The published multi-omics application that motivated DRAMS found a double-digit percentage of generated data affected, which shows the problem is not rare or hypothetical in real consortia [1].
What is the fastest way to screen for a mix-up?
Compute pairwise Pearson correlations on log CPM values of the top several thousand variable genes and inspect the cluster structure. Samples that cluster with the wrong metadata group, or replicate pairs that correlate no better than unrelated samples, move on to genotype testing.
Can I detect a mix-up without genotyping data?
Yes. Expression correlation, sex-marker counts, and pairwise fingerprint checks between RNA samples themselves all work without an array. Confidence rises sharply once any external genotype source exists, because genotype concordance is the most direct identity evidence.
Which software flags a swap between two samples?
Picard CrosscheckFingerprints reports a pairwise LOD score for every RNA sample against every reference sample, and a strongly negative LOD against the expected match is the flag. For multi-way swaps across several omics layers, DRAMS infers the full re-alignment [1].
Is RNA-seq variant calling accurate enough for identity checks?
Yes, for identity purposes. Allele-specific expression and filtering noise lower per-site accuracy relative to DNA sequencing, but agreement or disagreement across hundreds of independent sites is overwhelming evidence either way.
What should I do once a mix-up is confirmed?
Document the evidence, rename the affected data objects consistently across BAMs, count matrices, and metadata, notify the sequencing facility about the batch pattern, and re-run every downstream analysis that included the affected samples.
Can DRAMS correct the labels automatically?
It detects swaps and proposes a re-alignment of each data object to its inferred true identity using a logistic regression model followed by modified topological sorting [1]. Verify the proposed assignments with direct genotype checks before committing them to your sample sheet.
How do I prevent mix-ups in future sequencing runs?
Keep the sample sheet version controlled and generated from the facility manifest, include at least one cross-batch replicate per donor as an internal fingerprint, run the expression and sex-marker screens as standard QC gates before any analysis, and reconcile file names against raw facility output rather than hand-edited lists.