How to Check Disk Space with df for Bioinformatics
By Dr. Zubair Khalid, DVM, MS, PhD ·
By the end of this guide you will be able to check disk space on any Linux server with the df command, read every column of its output correctly, find which filesystem holds your sequencing data, verify that a filesystem has enough inodes before a run, script a preflight capacity check for your pipelines, and avoid the classic mistakes that cause bioinformatics runs to fail partway through a 40-hour alignment. You need a Linux or macOS terminal, a user account on the machine or cluster where you run analyses, and no additional software. Everything shown here uses tools that ship with every major Linux distribution.
Checking disk space is one of the first habits to build in linux for bioinformatics, because storage failures are quiet until they are expensive. A full scratch disk in hour 30 of an RNA-seq workflow does not produce a helpful error message. It produces truncated BAM files, corrupted intermediate outputs, and a rerun that costs another two days of compute.
Why Disk Space Runs Out Fast in Bioinformatics Workflows
Modern genomics pipelines multiply data. One Illumina flow cell of paired-end reads can generate hundreds of gigabytes of FASTQ files. Aligners such as BWA-MEM or STAR write BAM or CRAM files that are often several times the size of the input reads. Variant callers, sorting steps, and temporary index structures each add their own copies. A single human whole-genome analysis routinely touches several terabytes of intermediate and final files before anything is compressed or archived.
This is not a small-lab problem. Large shared infrastructures feel the same pressure at a different scale. The Italian Grid Infrastructure, which serves bioinformatics among other scientific communities, provides about 17 petabytes of disk space and 9 petabytes of tape capacity spread over more than 50 sites, and its operators note that storage and computing needs increase as instruments become more powerful [1]. The pattern holds at every scale: as sequencers and instruments improve, the storage footprint of routine analyses grows with them.
Workflow design choices also affect disk use. A comparison of five genotyping-by-sequencing analysis pipelines on soybean data found that pipelines vary widely in how they handle large variant datasets, and the authors built their recommended workflow around parallelization and automation with widely used genomics tools [2]. Pipelines that automate cleanly tend to also manage intermediate files deliberately, which keeps disk pressure predictable. Pipelines that leave every intermediate on disk do not.
The df command is the standard tool for seeing the state of that storage. Before learning how to read its output, it helps to define the terms it uses.
What df Reports and How to Read It
df stands for "disk free." It reports, for each mounted filesystem, how much space the filesystem holds, how much is used, and how much remains available to ordinary users.
Three terms matter here:
- Filesystem. The storage volume itself, identified by a device name such as
/dev/sda1, a network path such asnas01:/export/data, or a virtual name such astmpfs. - Mount point. The directory where that filesystem appears in the directory tree, such as
/,/home, or/scratch. When you write to/scratch/run1/aligned.bam, that file lands on whichever filesystem is mounted at/scratch. - Inode. A filesystem record that describes a single file or directory. Space and inodes are tracked separately. A filesystem can be full of inodes while showing plenty of free bytes, which happens when a workflow writes millions of small files such as per-sample chunk files or sharded indexes.
Running df -h produces output like this:
$ df -h
Filesystem      Size  Used Avail Use% Mounted on
/dev/sda1       200G   47G  143G  25% /
tmpfs            32G     0   32G   0% /dev/shm
/dev/sdb1       4.0T  3.7T  320G  93% /scratch
nas01:/export    20T   14T  6.0T  70% /data
Reading this example: the root filesystem has 143 GB free, the scratch disk is 93 percent full and is the one to watch, and /data is a network filesystem with 6 TB free. The -h flag means human-readable, so sizes print in gigabytes and terabytes rather than raw one-kilobyte blocks.
Step-by-Step: Checking Disk Space with df for Bioinformatics

This walkthrough covers the commands you will use daily on a workstation or head node. Follow it in order the first time, then use the pieces you need.
Step 1. Run df with human-readable units
$ df -hThe -h flag converts block counts into units you can reason about. Without it, every number appears in 1K blocks, which makes a 4 TB scratch disk look like the number 4294967296. Use -h in interactive work nearly always. On macOS, the same flag works and prints binary-based units, so numbers may differ slightly from Linux systems with the same hardware.
Step 2. Target the filesystem that holds your working directory
df without a path lists every mounted filesystem. Most of the time you care about one. Run it with a path and df reports the filesystem that contains that path:
$ cd /scratch/myproject
$ df -h .
Filesystem      Size  Used Avail Use% Mounted on
/dev/sdb1       4.0T  3.7T  320G  93% /scratch
This answers the question that actually matters: not "how full is the machine" but "how full is the disk that will receive my next 500 GB of BAM files." Running df -h . inside the directory where a pipeline writes is the single most useful habit in this guide. Do the same for /tmp if your pipeline stages temporary files there, and for your output directory if it differs from your working directory.
Step 3. Filter out pseudo-filesystems
A default df listing on a modern system includes dozens of entries that are not real storage: tmpfs entries for runtime memory-backed filesystems, udev for device nodes, squashfs for container images, and overlay filesystems inside containers. To see only real storage, exclude the known noise:
$ df -h -x tmpfs -x devtmpfs -x squashfs -x overlay
Filesystem      Size  Used Avail Use% Mounted on
/dev/sda1       200G   47G  143G  25% /
/dev/sdb1       4.0T  3.7T  320G  93% /scratch
nas01:/export    20T   14T  6.0T  70% /data
The -x flag excludes a filesystem type. Its counterpart -t includes only a given type, so df -h -t nfs lists only NFS mounts, which is useful on a cluster where you want to see the shared storage at a glance.
Step 4. Identify filesystem types with df -T
Filesystem type changes how you interpret the numbers. Ext4 and XFS are local Linux filesystems. NFS is network storage. Lustre and GPFS (also called Spectrum Scale) are parallel filesystems common on high-performance clusters. ZFS and Btrfs support snapshots, which consume hidden space. Show types alongside sizes:
$ df -hT
Filesystem     Type      Size  Used Avail Use% Mounted on
/dev/sda1      ext4      200G   47G  143G  25% /
/dev/sdb1      xfs       4.0T  3.7T  320G  93% /scratch
nas01:/export  nfs       20T   14T  6.0T  70% /data
store:/proj    lustre    100T  61T   39T  61% /proj
This matters for two reasons. Network and parallel filesystems can hang the df command if the server is unreachable, a problem covered in the mistakes section. And snapshot-capable filesystems can show free space that disappears as snapshots accumulate, so their Used column can grow even when you delete files.
Step 5. Check inodes with df -i
Bytes are only half the story. Check inodes before any workflow that creates many small files:
$ df -i /scratch
Filesystem      Inodes   IUsed   IFree IUse% Mounted on
/dev/sdb1      268435456 982104 267453352    1% /scratch
If IUse% approaches 100 percent, the filesystem cannot create new files no matter how many bytes are free. You will see the error No space left on device even though df -h shows terabytes available. This is one of the most confusing failures in linux commands bioinformatics work, and df -i is the one-line diagnosis. Workflows that trigger it include single-cell pipelines that shard objects across thousands of files, sharded genome indexes, and tools that write per-read or per-chunk output.
Step 6. Check scratch, network, and home separately
On a typical cluster, three filesystems matter and they fill at different rates:
- Home directory (often
/home/username): small, frequently under a quota, meant for scripts and notes, not data. - Scratch (
/scratchor/local): large, fast, sometimes purged automatically after a set number of days. - Project or archive storage (
/data,/proj, NFS or Lustre): large, slower, meant for results you keep.
Check all three before starting a run:
$ df -h /home /scratch /dataIf your institution imposes quotas, df on a quota-backed filesystem usually reports the quota as the Size value, which is the number that governs whether your next write succeeds. Quota tools such as quota -s or lfs quota give per-user detail that df alone cannot.
Step 7. Preflight a pipeline run programmatically
Wrap the check in a small script so every run verifies capacity before it starts. The following fragment extracts the available bytes on the filesystem holding a given directory and fails early if the free space is below a threshold:
#!/usr/bin/env bash
set -euo pipefail

TARGET="/scratch/myproject"
MIN_GB=500

avail_kb=$(df -Pk "$TARGET" | awk 'NR==2 {print $4}')
avail_gb=$((avail_kb / 1024 / 1024))

if [ "$avail_gb" -lt "$MIN_GB" ]; then
    echo "Abort: only ${avail_gb} GB free on ${TARGET}, need ${MIN_GB} GB" >&2
    exit 1
fi

echo "Preflight OK: ${avail_gb} GB free on ${TARGET}"
Notes on the flags: -P forces the POSIX output format so columns are stable across Linux, BSD, and macOS, which makes parsing reliable. awk picks the fourth field (Avail) from the second line. The threshold is a plain integer in gigabytes, easy to adjust per pipeline. Store the script next to your pipeline and call it from the workflow manager or at the top of your wrapper script. A daily cron entry running the same check and mailing you on a low threshold catches slow leaks, such as log accumulation, before they stop a run.
Key df Options at a Glance
| Option | What it does | When to use it in bioinformatics |
|---|---|---|
-h | Human-readable sizes (K, M, G, T) | Every interactive check |
-T | Show filesystem type (ext4, xfs, nfs, lustre) | Distinguishing local scratch from network storage |
-i | Report inode usage instead of bytes | Before workflows that write many small files |
-x TYPE | Exclude a filesystem type | Filtering tmpfs and container noise |
-t TYPE | Show only a filesystem type | Listing only NFS or only local disks |
-P | POSIX-stable output format | Parsing df inside scripts |
-l | Local filesystems only | Avoiding hangs from unreachable network mounts |
| path argument | Report only the filesystem containing path | Checking the disk your pipeline writes to |
Pairing df with du to Find What Is Eating Space
df tells you that a filesystem is full. du (disk usage) tells you which directories hold the bytes. The two disagree at times, and knowing why is part of reading them correctly. First find the filesystem, then descend into it:
$ df -h /scratch
$ du -h -d 1 /scratch | sort -h
15G    /scratch/refs
210G   /scratch/old_runs
3.4T   /scratch/myproject
The -d 1 flag limits du to one level of subdirectories, and sort -h sorts human-readable sizes correctly so 900G sorts below 3.4T. Drill down level by level into the largest directory. Add -exclude patterns if some directories are on other mounts and would be double counted, or run du -x to stay on one filesystem.
Two tools make this faster in practice. ncdu provides an interactive, navigable version of the same analysis and is worth installing on any server you administer. On files that were deleted but are still held open by a running process, du cannot see them but they still consume space, a case covered in the mistakes section.
A practical tip for capacity estimation: before starting a large download or transfer, sum the expected footprint of all file types the pipeline will write, not just the input. A useful working habit is to sketch the files per sample, multiply by sample count, and double the result for intermediates. The df-based preflight script above then enforces that estimate mechanically.
Planning ahead pays off beyond a single run. Work that builds persistent resources, such as reference databases and query indexes for large datasets stored on disk, adds fixed capacity requirements on top of per-run intermediates. Index structures for large on-disk datasets are a recognized engineering problem, and space-efficient index design is an active research area precisely because these structures can dominate storage budgets. Capacity planning studies for large scientific databases likewise treat disk space requirements as a first-class design parameter that must be estimated before deployment [3]. Treat your reference indexes and databases as line items in the same budget.
Scratch Disks, Secondary Storage, and Multi-Disk Servers
Many bioinformatics servers separate the system disk from one or more large data disks, and pipelines are usually tuned to use a designated scratch directory on the large disk. Checking df -h / alone can look healthy while scratch is at 100 percent. Always check each mount your pipeline touches, which is why Steps 2 and 6 target specific paths rather than listing everything once.
The pattern of splitting working state from bulk storage has research pedigree. Work on verifying large state spaces describes an approach that uses secondary hard disks to store model information while main memory holds the working set, reducing the memory that a computation needs at any moment [4]. Related work on implicit state space enumeration explicitly tackles overcoming memory and disk limitations when a computation outgrows RAM [5]. Bioinformatics tools do the same thing in their own way: sorters such as samtools sort and sambamba sort spill sorted chunks to temporary files, and splice-aware aligners build large index structures on disk before alignment. When you configure those temporary directories, check the disk behind them with df -h, not just the output directory. A sorter whose temp directory sits on a nearly full small filesystem will fail even when the output disk is empty.
On servers with multiple data disks or hardware RAID, capacity and performance interact. Research on heterogeneous disk arrays shows that balancing capacity utilization and disk bandwidth across devices, while grouping data with similar requirements, yields better allocation of space and throughput than naive placement. You do not need to manage RAID levels yourself to benefit from the underlying idea: keep hot intermediates on the fastest local scratch, keep cold results on slower archive storage, and check both with df on their own schedules.
Disk Health Beyond Capacity
Free space is necessary but not sufficient. A disk can report healthy numbers in df while heading toward mechanical failure. Storage reliability research using the public Backblaze dataset of drive characteristics shows that a small set of SMART attributes can flag drives likely to fail soon, and that machine learning methods, with random forest performing best among the tested models, can predict individual disk failures from those attributes [6]. You cannot change SMART behavior from inside your pipeline, but on servers you administer, watching SMART data alongside df catches the failure mode that capacity monitoring never sees: a drive that fills normally and then dies.
For shared institutional storage, capacity is managed for you, but the habit of checking before large writes still applies, because shared filesystems fill from many directions at once. The 17 petabytes of disk capacity cited for a national grid infrastructure is consumed by thousands of concurrent users, and individual quotas or project allocations are enforced at the directory level rather than the device level.
Common Mistakes and Limitations
Reading Use% as free space for you. The Use% column counts blocks reserved for the root user, which is typically 5 percent on ext4 filesystems. A disk showing 100 percent Use% with nonzero Avail still has room, but only root can write it. Conversely, a disk at 95 percent Use% may have less room for you than the Avail column suggests once reserved blocks are subtracted. When in doubt, trust the Avail column for your own writes, and remember that as a non-root user on a shared server, Avail is an upper bound shared with every other user.
Trusting tmpfs numbers. /dev/shm and other tmpfs mounts report huge sizes because tmpfs sizes are conventions, not physical disks. tmpfs consumes RAM. Writing large intermediates to tmpfs is a legitimate performance trick, but check free -g alongside df -h /dev/shm, because filling tmpfs can drive the machine into memory pressure and trigger the kernel out-of-memory killer, which kills your pipeline's largest process without warning.
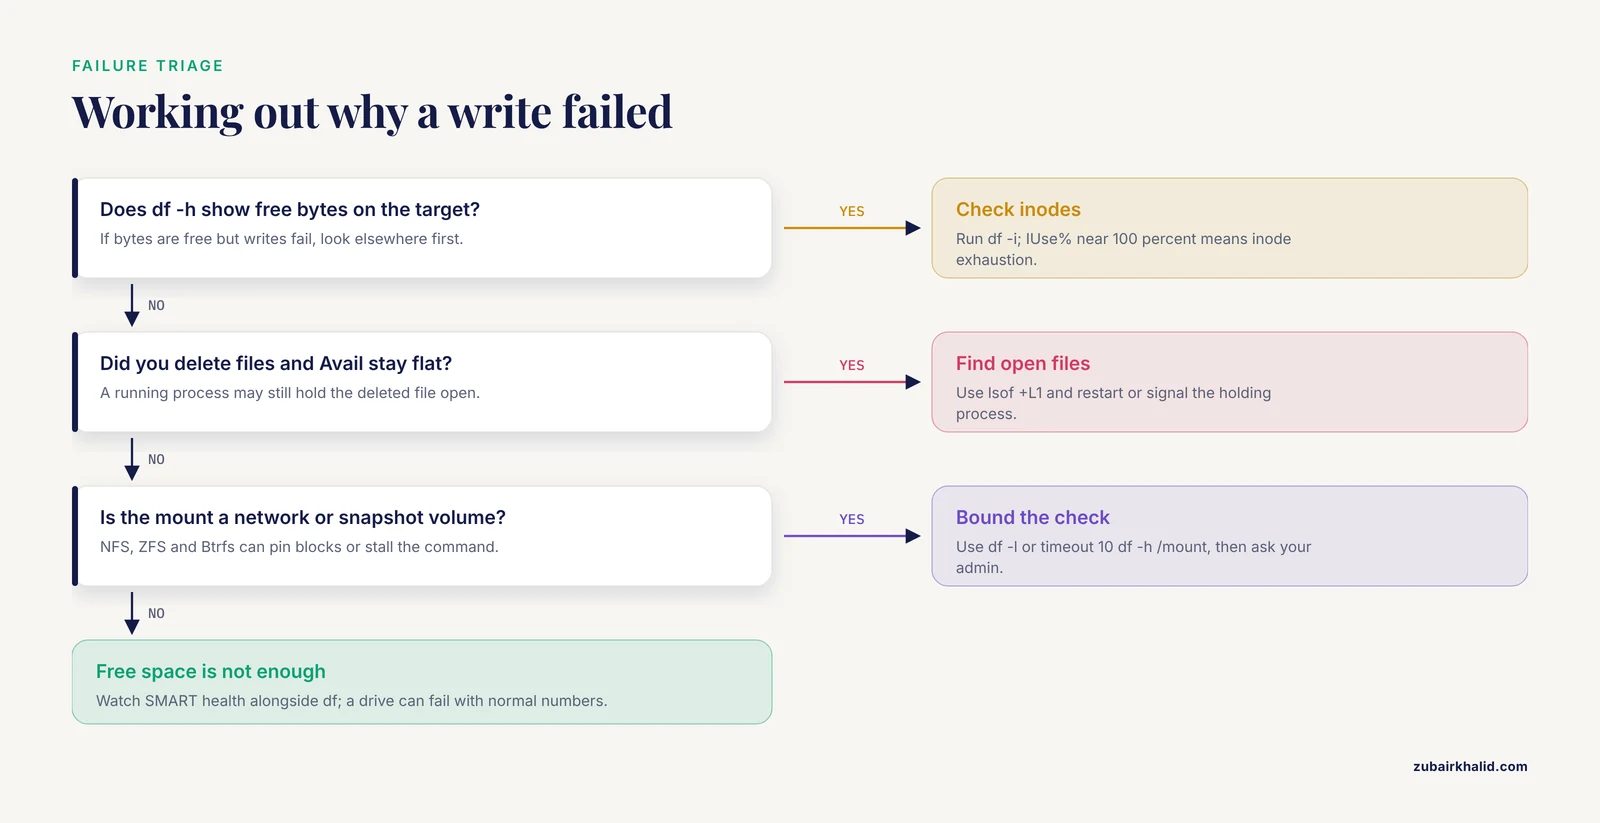
Assuming df reflects deleted files immediately. Space is freed when the last process holding a deleted file closes it. If a pipeline deleted a 200 GB intermediate while a running alignment still holds it open, df continues to report the space as used. Find these with lsof +L1 and restart or signal the holding process. This is the classic explanation for "I deleted files and df did not change."
Letting df hang on a stale network mount. If an NFS server becomes unreachable, df can block indefinitely while trying to contact it, which freezes your shell. Use df -h -l to list local filesystems only, or wrap network checks in the timeout command, for example timeout 10 df -h /data, so a dead mount cannot stall a script.
Confusing inode exhaustion with disk full. Both produce No space left on device. Check df -i when df -h shows free bytes. The fix differs completely: deleting large files does not help, you must delete or consolidate many small files, or archive them into a tar archive.
Ignoring snapshot and quota effects. On ZFS, Btrfs, and some enterprise NFS servers, deleting files may not raise Avail because snapshots still pin the blocks. On quota-backed volumes, Size is your quota, not the device size. Neither case is visible from df alone, so ask your system administrator how the storage behaves if numbers behave strangely.
Checking once at the start and never again. A preflight check verifies capacity at hour zero. A 40-hour run can outgrow a healthy 60 percent-full scratch disk, especially on shared systems where other users write concurrently. For long runs, have the pipeline log df output at each major step, or run a periodic cron check with a mail alert on a threshold. The cost of a failed check is minutes, and the cost of a failed 40-hour run is a weekend.
Treating capacity as the only failure mode. Disk faults and controller problems take disks out of service without warning. Storage research shows that drive-failure prediction from SMART attributes is practical and that forecasting likely lost storage capacity supports proactive reservation of replacement space. On personal workstations, the practical takeaway is simpler: keep the only copy of nothing on one disk, and verify results exist and are nonempty before deleting intermediates.
Frequently Asked Questions
What does df actually measure in Linux?
df reports free space on mounted filesystems by consulting the filesystem metadata itself, showing total size, used space, available space, use percentage, and mount point for each volume.
Why do df and du show different numbers for the same disk?
They differ because df counts the whole filesystem including reserved blocks, open-but-deleted files, and metadata, while du only counts files it can walk in the directories you name, so mounts, deleted-but-open files, and permissions create gaps between the two numbers.
How much free space should I keep before starting a sequencing analysis?
There is no universal threshold, but a conservative practice is to confirm at least twice your estimated total intermediate and output footprint is free on the target filesystem, and to enforce that estimate with a scripted df check before each run.
What does "No space left on device" mean when df shows free space?
It usually means inode exhaustion, where the filesystem has free bytes but no free inodes, so check df -i and delete or consolidate large numbers of small files.
Can df hang or freeze on a cluster?
Yes, if an NFS or other network mount is unreachable, df can block indefinitely on it, so use df -l for local filesystems or timeout 10 df -h /mount to bound the wait.
Does df work on macOS and in containers?
It works on macOS with the same flags, though sizes print in binary units, and inside containers df typically shows the overlay filesystem, which reports the host disk rather than a container-specific volume.
How do I monitor disk space automatically during long pipelines?
Run the df preflight script from the workflow before it starts, log df output at each major step, and add a cron job that checks a threshold and mails you when free space drops below a limit you set.
Should I worry about disk health and not just disk space?
Yes, because a failing drive can report normal free space right up to failure, so on servers you administer, review SMART health data alongside df and keep a second copy of anything irreplaceable.
Sources
- IGI grid services for the bioinformatics community
- A comparison of genotyping-by-sequencing analysis methods on low-coverage crop datasets shows advantages of a new workflow, GB-eaSy
- Disk space and load time requirements for eye movement biometric databases
- Machine Learning and Disk-based Methods for Qualitative Verification of Markov Decision Processes
- Large implicit state space enumeration: overcoming memory and disk limitations
- Data Mining Methods Application for Increasing the Data Storage Systems Fault-Tolerance