Bioinformatics Tutorial vs. Real-World Analysis: What's Different
By Dr. Zubair Khalid, DVM, MS, PhD ·
A bioinformatics tutorial gives you a clean dataset, a fixed sequence of steps, and a known correct answer, while real-world analysis gives you messy data, ambiguous questions, and no answer key. The rule of thumb is simple. Use tutorials to learn tools, syntax, and concepts. Switch to real-world habits the moment you own a question, a dataset, and a deadline, because the skills that make a tutorial run smoothly are different from the skills that make an analysis survive review, reuse, and scrutiny.
This article explains the difference between bioinformatics tutorial and real world analysis in concrete terms, using published tutorials and training platforms as anchors. The goal is not to dismiss tutorials. Tutorials are the fastest on-ramp into the field, and recent training platforms have narrowed the gap between guided exercises and genuine research practice [1][2]. The goal is to tell you exactly where the gap sits, so you can close it deliberately instead of discovering it mid-project.
What a Bioinformatics Tutorial Is
A tutorial is a curated, worked example with three fixed properties. The data are clean or pre-cleaned, the analysis path is predetermined, and the expected output is known in advance. These properties are not flaws. They are what make a tutorial useful for teaching.
Modern bioinformatics tutorials come in several formats, and it helps to see the range before comparing them to real work.
Interactive code tutorials. Graphery is a web server that teaches biological network algorithms through interactive Python code that runs directly on real biological networks, with no account required, and it accepts contributions from both computational and biological researchers [3]. You read a concept, execute the code, modify it, and see what changes. The feedback loop is immediate.
No-code visual tutorials. An online survival analysis tutorial built around Orange Data Mining, a free visual analytics platform, covers censoring, Kaplan-Meier curves, group comparisons, and biomarker discovery through real datasets in four pedagogical units, designed for 2 to 3 hours of learning and tested with over 120 participants [1]. This format removes programming as a barrier so learners can focus on statistical concepts like censoring and time-to-event outcomes.
Guided platform training suites. The Multi-Interface Galaxy Hands-on Training Suite (MIGHTS) teaches single-cell RNA sequencing analysis through parallel methods, one using a graphical interface with buttons and one using code, with interoperable materials that let learners move between environments [2]. This design deliberately separates learning to analyze data from learning to code, which the authors identify as the core difficulty for bench biologists and clinicians facing a steep learning curve [2].
Classroom curricula. PUMA is a microbiome curriculum for undergraduates that focuses on data analysis, visualization, and statistical reasoning using web-based and graphical tools, explicitly chosen to avoid the steep command line learning curve that blocks novice researchers [4]. The curriculum also surfaces a real-world problem in miniature: upstream and downstream tools often use different data formats, and making them compatible can require custom scripts or hours of manual work [4].
Method tutorials bundled with new tools. Many method papers ship with a tutorial to make the method usable. MetaMapR, a tool for metabolomic network analysis, includes installation instructions, tutorials, and application examples alongside the software [5]. PENSA, a Python package for comparing biomolecular conformational ensembles, provides featurization and systematic comparison of feature distributions across simulation conditions [6]. A tutorial for propensity score weighting under violations of the positivity assumption ships with an R package called ChiPS and walks through two real case studies [7].
End-to-end pipeline walkthroughs. A tutorial chapter on RNA-RNA interaction prediction with deep learning covers the full arc from raw sequences through dataset curation, negative sampling, feature engineering, model selection, training, evaluation, and interpretability, and it emphasizes workflow management, containerization, version-controlled datasets, and FAIR-compliant pipelines [8].
Notice what all of these have in common. Someone has already made the hard decisions for you. The dataset is chosen, the parameters are set, the expected plots exist, and the interpretation is written down. That is the product you are buying when you work through a tutorial, and it is exactly what disappears in real-world analysis.
What Real-World Analysis Is
Real-world analysis is an investigation where you, not the tutorial author, are responsible for every decision from raw data to final claim. The differences fall into five areas.
You define the question. In a tutorial, the question is given. In a real project, a collaborator asks whether a treatment changes a biomarker, whether patients in one cohort survive longer, or whether two molecular signatures overlap, and part of your job is turning that into something a dataset can answer. A tutorial on electronic health records (EHR) based real-world evidence describes an integrated pipeline of four modules covering data harmonization, cohort construction with computational phenotyping, and causal modeling with noisy data, and the authors note that the critical variables required to assess a treatment and outcome relationship are challenging to extract even from highly granular EHR data [9]. Translating a clinical question into extractable variables is a design problem, not a coding problem, and no tutorial solves it for you.
You assemble the data. Tutorial data arrives as a single matrix. Real data arrives as fragments. A real-world metabolomics experiment produces sparse, disconnected networks when analysts rely on pathway knowledge alone, which is precisely why MetaMapR integrates enzymatic transformations, structural similarity, mass spectral similarity, and empirical associations to connect metabolites even when annotations are unknown [5]. The tutorial version of a metabolite network looks dense and interpretable. The real version starts fragmented, and connecting it is analysis work.
You manage scale and heterogeneity. Multi-study integration illustrates this sharply. A tutorial on Bayesian multi-study factor analysis evaluates seven advanced models, including Perturbed Factor Analysis, Subspace Factor Analysis, and Bayesian Combinatorial Multi-study Factor Analysis, against benchmark approaches that pool data naively or analyze each study separately [10]. The entire reason these models exist is that real data from multiple studies contains shared biological signal mixed with study-specific variability, and deciding how to handle that mixture changes your results. A tutorial dataset has one study, one batch, one set of assumptions.
You own reproducibility. In a tutorial, someone else ensured the code runs. In real work, reproducibility is a deliverable. The RNA-RNA interaction tutorial makes this explicit by recommending workflow management, containerization, version-controlled datasets, and FAIR-compliant pipelines so results can be shared and reused [8]. Those recommendations exist because the default state of a real analysis is unrepeatable. Six months later, the package version changed, the raw files moved, and the notebook that "worked" no longer does.
You answer to reviewers and collaborators. Real analyses are read by people who did not run the code. A statistician will ask which estimand you targeted. A biologist will ask what a cluster means. A reviewer will ask why your cohort includes patients it should exclude. Tutorials rarely simulate this scrutiny, which is arguably their biggest gap.
Side-by-Side Comparison
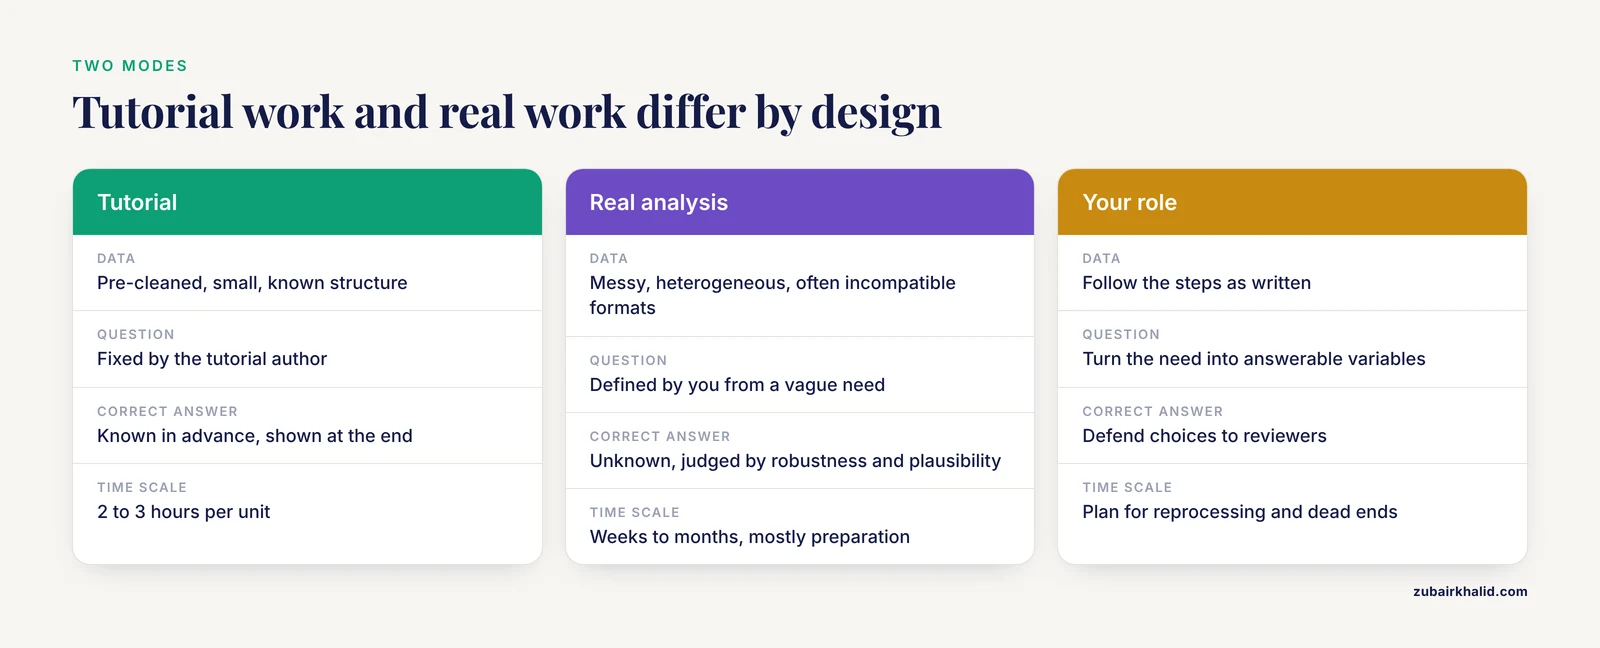
The table below is the core of the comparison. Each row is a decision you will actually face.
| Dimension | Bioinformatics tutorial | Real-world analysis |
|---|---|---|
| Data | Pre-cleaned, small enough to run on a laptop, known structure | Messy, heterogeneous, possibly in multiple incompatible formats that require custom scripts to integrate [4] |
| Question | Fixed by the tutorial author | Defined by you from a collaborator's vague or evolving need |
| Steps | Linear and predetermined | Iterative, with dead ends, reprocessing, and revisited choices |
| Correct answer | Known in advance, shown at the end | Unknown. Consistency, robustness, and biological plausibility are the checks |
| Environment | Pre-configured, often hosted for you | You build and maintain it. Workflow managers, containers, and version control are the standard defense [8] |
| Statistical choices | The method is chosen for you and assumptions hold | You choose the estimand and method, and assumptions may fail. Positivity violations in propensity score analysis can make conventional estimands unidentifiable, requiring shifted targets like the weighted average treatment effect [7] |
| Time scale | 2 to 3 hours for a well-designed unit [1] | Weeks to months, with the majority spent on data preparation |
| Feedback | Immediate, unambiguous (your plot matches the tutorial plot) | Delayed, contested (collaborators, reviewers, replication attempts) |
| Failure mode | You misread a step. Easy to fix | Silent failure. The pipeline runs, the results look plausible, and they are wrong |
| Learning value | Tools, syntax, concepts, vocabulary | Judgment, debugging, data forensics, communication, reproducibility |
| Cost of error | Low. Rerun the cell | High. A wrong cohort definition invalidates everything downstream [9] |
Read the table column by column, not row by row. The tutorial column describes a teaching instrument. The real-world column describes a professional practice. The difference between bioinformatics tutorial and real world analysis is not that one is easy and one is hard. It is that the difficulty changes type, from following instructions to making and defending decisions.
The Differences That Decide Real Choices
Some gaps between tutorials and real work matter more than others. These four decide whether an analysis holds up.
Data reality and the preprocessing iceberg
Tutorials compress preprocessing into one step or skip it entirely. Real analyses spend most of their time there. Three published examples show what the real version looks like.
First, format incompatibility. In the microbiome education context, tools for upstream and downstream analyses frequently use different data formats, which forces custom scripts or hours of manual compatibility work [4]. In a real project, this problem appears on day one, across every tool in your pipeline, multiplied by every dataset you add.
Second, variable extraction. EHR data contains rich structured and unstructured information, including diagnosis codes, clinical notes, and images, yet extracting the variables needed to estimate a treatment and outcome relationship reliably is the central challenge, which is why the published pipeline dedicates its first module to harmonization using natural language processing to map RCT design variables onto EHR features [9]. The tutorial version of a clinical dataset has a clean exposure column. The real version requires deciding what a diagnosis code means, which notes to parse, and which patients to believe.
Third, cohort construction. The same EHR pipeline devotes an entire module to identifying patient cohorts using advanced phenotyping algorithms [9]. In a tutorial, the cohort is a filtered table. In a real study, it is an arguable scientific claim that reviewers will probe.
The practical lesson is not that preprocessing is boring. It is that preprocessing decisions are analysis decisions, and they deserve the same documentation and justification as your final model.
Statistical judgment under broken assumptions
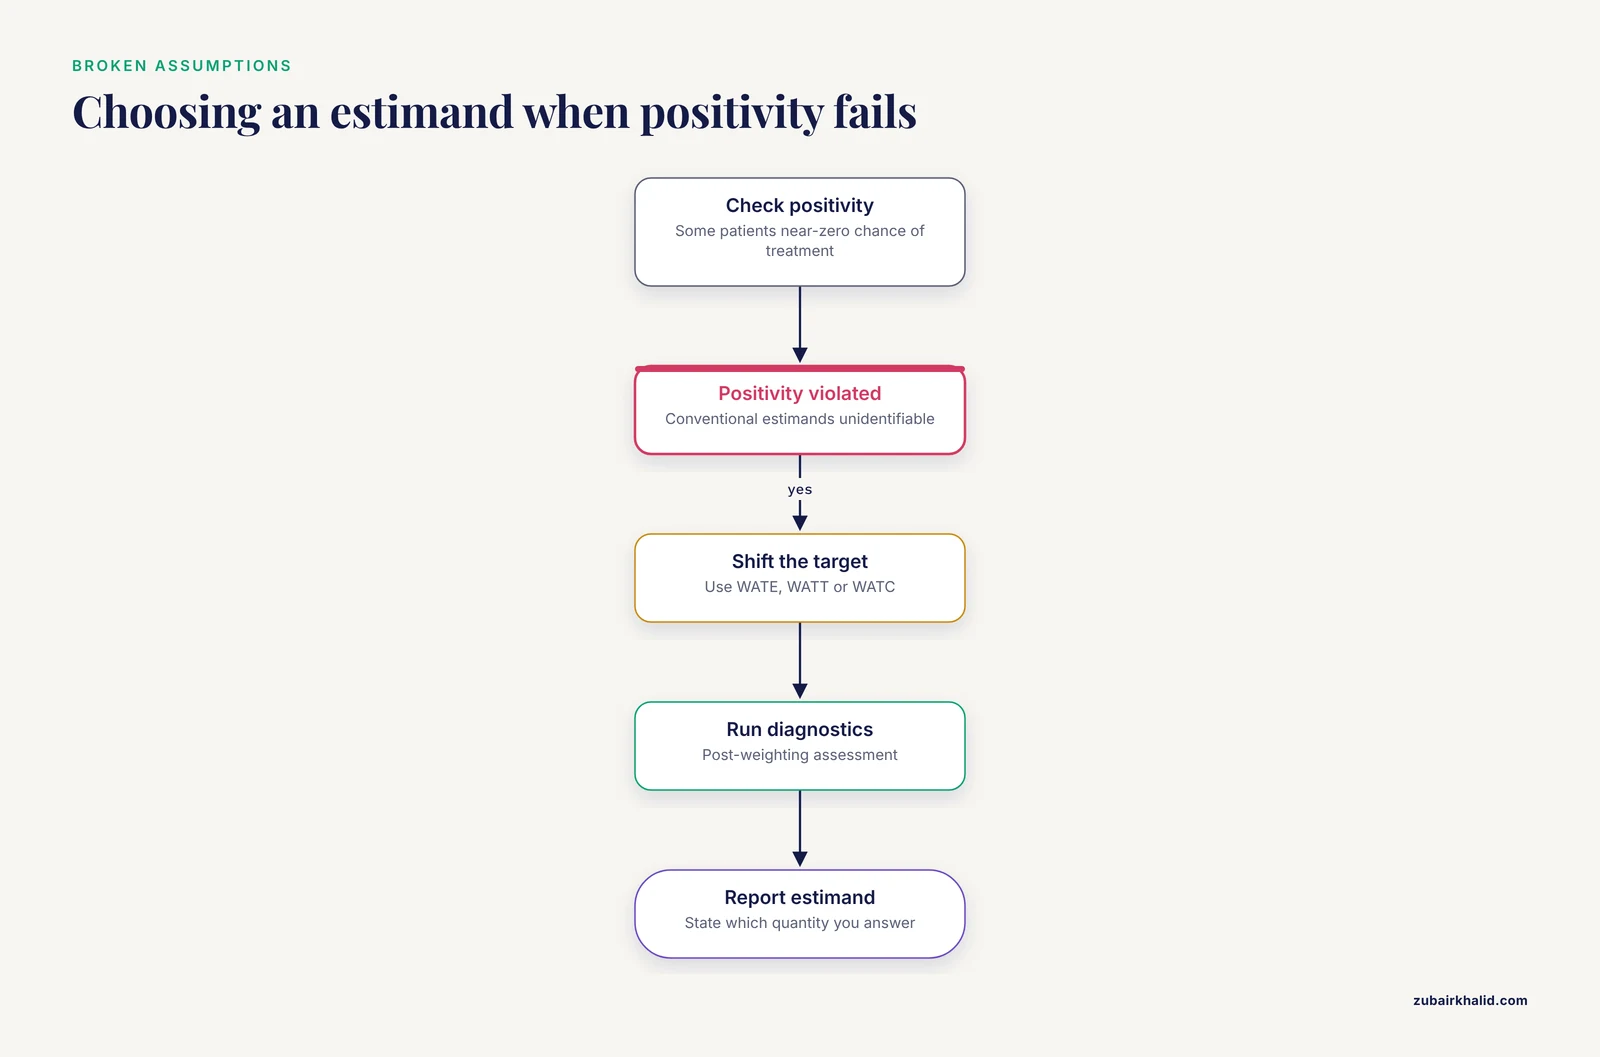
Tutorials teach methods where the assumptions hold, because that is how you learn what a method does. Real data violates assumptions regularly, and the response requires judgment that only practice builds.
The propensity score literature offers the clearest worked contrast. Under standard conditions, you estimate an average treatment effect (ATE), the average treatment effect on the treated (ATT), or the average treatment effect on the controls (ATC). Violations of the positivity assumption, meaning some patients have zero or near-zero probability of receiving one treatment, can render all three conventional estimands unidentifiable. The tutorial response is to shift the inferential focus to weighted counterparts, the weighted ATE (WATE), weighted ATT (WATT), and weighted ATC (WATC), which preserve internal validity while answering a question your data can actually support, and then to run post-weighting diagnostic assessments [7]. Notice the sequence. The analyst first diagnosed the problem, then chose among estimands, then verified the fix. A tutorial that only showed you the code for propensity score weighting would never teach the diagnosis step, yet the diagnosis is the hard part.
Multi-study settings add a second layer. When integrating high-dimensional data across studies, pooling naively lets study-specific variability contaminate the shared signal, while analyzing each study separately wastes statistical power. The seven Bayesian factor models surveyed in the method tutorial exist precisely because that tradeoff has no single right answer, and the tutorial evaluates them through extensive simulations measuring computational efficiency and accuracy of loading estimation [10]. In real work, you would run a similar comparison, justify your choice in writing, and accept that a reviewer may prefer a different model.
Reproducibility as a design constraint
The deepest cultural difference is that tutorials treat reproducibility as given, while real-world analysis treats it as something you engineer. The deep learning pipeline tutorial is explicit about the toolkit: workflow management for the analysis graph, containerization so the software environment travels with the code, version-controlled datasets so the inputs are pinned, and FAIR-compliant pipelines so others can find, access, and reuse the work [8].
Galaxy-based training addresses the same problem from the opposite direction. MIGHTS notes that iterative analyses lacking reinstantiation, coupled with unstandardized pipelines, have made effective single-cell training a moving target, and it responds by emphasizing real-world data analysis, critical thinking, and FAIR data principles for validating results [2]. In other words, the training platform had to adopt real-world reproducibility practices to stay usable, which tells you something about where tutorials and real work are converging.
The habit to build is simple. Every decision that affects a result, including parameter values, filter thresholds, package versions, and cohort definitions, should exist in a file that another person could execute. If you cannot hand your analysis to a colleague and have them regenerate your figures, it is not finished.
Communication across disciplines
The final difference is human. MIGHTS was designed to bridge what the authors call the biologist-programmer gap, emphasizing interdisciplinary communication for effective learning at all levels [2]. That emphasis reflects a real-world condition. Most bioinformaticians work with collaborators who do not code, and most collaborators work with analysts who do not know the biology. Real analysis includes translating between those worlds. A tutorial never asks you to explain to a clinician why removing a batch effect changed the patient rankings, but a real project will.
When to Use a Bioinformatics Tutorial
Given the gaps above, tutorials have specific, well-defined uses. Use a bioinformatics tutorial when any of the following is true.
- You are learning a tool from zero. Before you can make judgment calls in Galaxy, Orange, R, or Python, you need the mechanical basics. A structured hands-on tutorial that integrates video lectures, literature, quizzes, and practical exercises, organized into progressive units, is the fastest way to build them [1].
- You need to evaluate whether a method fits your problem. Method tutorials bundled with new software, like MetaMapR for metabolomic networks [5] or PENSA for conformational ensemble comparison [6], let you test a method on a worked example before committing real data and compute. If the method tutorial's output looks nothing like your question, that is a cheap discovery.
- You are crossing a skills boundary. If you are a biologist approaching single-cell analysis or a clinician approaching EHR data, a training suite that offers the same analysis through both a graphical interface and code lets you learn the analysis logic first and the syntax second [2]. This is the single best use of tutorial time for cross-disciplinary learners.
- You are adopting a complex pipeline for the first time. An end-to-end tutorial for a deep learning pipeline, covering dataset curation, negative sampling, model selection, and evaluation, teaches the vocabulary and the order of operations you will need before your own project can succeed [8].
- You need a shared reference with a collaborator. Tutorials with case studies, like the comprehensive tutorial and multiple case studies accompanying PheMIME, a web app for phenome-wide multimorbidity analysis across three large EHR systems [11], give a team a common worked example to discuss before applying the tool to their own institution's data.
- You are teaching. Classroom-scale tutorials like PUMA exist because novice researchers cannot absorb command line fluency and ecological reasoning at the same time, and the curriculum choice of web-based tools reflects that tradeoff deliberately [4].
The common thread is that tutorials transfer procedure and vocabulary. If what you need is a procedure or a vocabulary, a tutorial is the right tool and the fastest one available.
When You Have Moved Past Tutorials
The transition out of tutorials is a skill in itself, and it has recognizable milestones.
You stop trusting running code. In a tutorial, code that runs is correct. In real work, code that runs is merely a hypothesis. The shift happens when you start writing checks into your pipeline: count records at each step, verify that join keys match, plot distributions before and after filtering, and confirm that your cohort sizes match the numbers you expect before any model runs.
You start designing before coding. Real projects begin with a plan for the data you will need, the variables you must extract, and the analyses that will answer the question. The EHR real-world evidence framework treats this as a formal pipeline with modules for harmonization, phenotyping, and causal modeling with noisy data [9]. You do not need that exact architecture, but you need the same discipline: decide the analysis design first, then engineer the data to support it.
You adopt infrastructure deliberately. At some point, ad hoc scripts stop being enough. The standard stack, as the deep learning tutorial frames it, is workflow management, containerization, version-controlled data, and FAIR-compliant packaging [8]. Adopt these when a project is worth reproducing, which for real research is nearly always.
You compare methods instead of adopting the first one that runs. In a tutorial, the method arrives with the notebook. In real work, choosing among seven Bayesian factor models, or between pooling and per-study analysis, is part of the analysis [10]. Build the habit of running a benchmark or a sensitivity analysis, even a small one, before you commit.
You document for a hostile reader. Write your methods section as you go, not after. Assume the reader will ask why each filter exists and what happens without it. The propensity score tutorial's structure, which moves from choosing a primary target estimand to implementing the estimator to running post-weighting diagnostics, is a good template for that written defense [7].
None of these milestones require leaving tutorials behind permanently. Working analysts return to tutorials constantly when learning new packages. The difference is posture. Early on, a tutorial is the analysis. Later, a tutorial is reference material for one component of an analysis you design and defend.
Worked Scenarios
Three scenarios show how the two modes interact in practice.
Scenario 1. Learning single-cell analysis, then running a real study. A bench biologist wants to analyze a single-cell RNA sequencing dataset from her lab. She starts with MIGHTS, working through the analysis in the Galaxy graphical interface, then repeats the same steps in code using the interoperable materials [2]. The tutorial gave her the standard workflow and the vocabulary. Her real dataset then presents problems the tutorial never did: cells cluster by sequencing batch rather than by cell type, some samples have far fewer cells than the tutorial's, and she must decide and justify her filtering thresholds. Those problems are real analysis, and she is now equipped to face them because the tutorial consumed zero of her debugging energy on setup. This is the intended division of labor, and the MIGHTS authors designed for exactly this transition [2].
Scenario 2. From a survival analysis course to a clinical cohort. A student completes the Orange-based survival tutorial in a single afternoon, learning censoring, Kaplan-Meier curves, and group comparisons on curated real datasets [1]. His thesis project then hands him a registry extract with missing follow-up times, inconsistent date formats, and a censoring pattern that depends on treatment, which threatens the validity of a naive Kaplan-Meier comparison. The tutorial taught him what censoring means. Only real data taught him that censoring can be informative, and that the fix is a modeling decision he must document and defend. The tutorial was still the necessary first step. It was simply not the last one.
Scenario 3. Integrating multi-study genomic data. A postdoc needs to combine expression data from three studies. A naive approach pools everything. After reading the multi-study factor analysis tutorial and its simulation results on computational efficiency and loading accuracy, she runs two candidate models, one that models shared factors with study-specific loadings and one simpler benchmark, and reports both [10]. The tutorial did not make the choice for her. It made her capable of making the choice with evidence, which is the real-world skill.
Common Mistakes and Limitations
These are the specific errors that people make at the tutorial-to-real-world boundary, in rough order of how much damage they cause.
Treating tutorial parameters as defaults. Filter thresholds, normalization choices, and model hyperparameters in a tutorial were tuned for that tutorial's dataset. Carrying them to a different dataset without justification is the most common silent failure in applied bioinformatics. In single-cell analysis, unstandardized pipelines are a recognized reason that training results do not transfer between projects [2].
Believing the clean dataset. Tutorials use data where the assumptions hold. Real data violates positivity in observational treatment comparisons, breaks format compatibility between tools, and hides ambiguous variables inside free text and images [4][7][9]. If your first run on real data looks as clean as the tutorial, suspect a bug before celebrating.
Confusing reproducible-looking output with reproducible analysis. A figure can be regenerated while the analysis behind it cannot. If your raw inputs are unversioned and your environment is unmanaged, your figure is decorative. Containers and workflow management exist because this failure is universal, not rare [8].
Skipping the estimand conversation. Analysts frequently run a default method and report its default quantity without asking what question it answers. The propensity score literature shows why this matters: when positivity fails, the ATE is not just hard to estimate, it is unidentifiable, and the honest answer requires a different target estimand entirely [7]. Ask what quantity you want before you ask what package computes it.
Letting the tutorial replace domain knowledge. Interactive code tutorials make execution effortless, which can create the illusion of understanding. Graphery's design counters this by pairing every executable snippet with the underlying graph concept [3]. Pair every tutorial you run with a written explanation, in your own words, of why each step exists.
Underestimating communication time. Real analysis includes meetings, figure revisions, and methods write-ups. Plan for them. The interdisciplinary communication emphasis in Galaxy-based training exists because technical results that cannot be explained to the biology side of a project do not get used [2].
One limitation applies to every individual project. A published tutorial, a training platform, and a method paper describe general practice. Your dataset, cohort, and question have specifics that only your own exploratory analysis and, for clinical work, appropriate collaborators and review can adjudicate.
Frequently Asked Questions
What is the main difference between a bioinformatics tutorial and real-world analysis?
A tutorial gives you predetermined data, steps, and answers, while real-world analysis makes you responsible for defining the question, assembling messy data, choosing methods, and defending every decision. Tutorials teach procedure. Real analysis requires judgment.
When should I use a bioinformatics tutorial instead of starting a real project?
Use a tutorial when you are learning a tool from scratch, evaluating whether a method suits your problem, crossing from a GUI to code or the reverse, or adopting a complex pipeline for the first time. Once you own a question and a dataset, real-world practices should take over.
Can a bioinformatics course prepare me for real datasets?
A good course prepares you for the mechanical and conceptual layer, and the best ones now use real data and teach reproducibility practices alongside analysis. No course can prepare you for your specific dataset's quirks, so expect a debugging and design period on your first real project regardless of training.
Why does my code from a tutorial fail on my own data?
Tutorial code assumes the tutorial's data structure, formats, and scale. Your data almost certainly differs in at least one of those, and it may also violate statistical assumptions the tutorial never tested. Debugging that mismatch is a normal part of real analysis, not a sign that you learned wrong.
Do I need to learn to code, or can I use graphical tools like Galaxy?
You can do substantial, publishable analysis without coding, and parallel-interface training suites now teach the same single-cell workflows through both buttons and code. Learning some code eventually expands what you can do and makes you more independent, but it is not a prerequisite for starting.
How do I make a real-world analysis reproducible?
Pin everything that affects a result. Use a workflow manager for the analysis steps, a container for the software environment, version control for code and datasets, and FAIR-compliant packaging for release. These are the standard recommendations in current method tutorials, and they apply to far more than deep learning projects.
Sources
- Online tutorial on survival analysis for biomarker discovery.
- Galaxy as a gateway to bioinformatics: Multi-Interface Galaxy Hands-on Training Suite (MIGHTS) for scRNA-seq.
- Graphery: interactive tutorials for biological network algorithms.
- PUMAA: A Platform for Accessible Microbiome Analysis in the Undergraduate Classroom.
- MetaMapR: pathway independent metabolomic network analysis incorporating unknowns.
- Systematic analysis of biomolecular conformational ensembles with PENSA.
- A Tutorial for Propensity Score Weighting Methods Under Violations of the Positivity Assumption.
- Tutorial: End-to-End Deep Learning Pipeline for RNA-RNA Interaction Prediction.
- Generate Analysis-Ready Data for Real-world Evidence: Tutorial for Harnessing Electronic Health Records With Advanced Informatic Technologies.
- A Tutorial on Bayesian Multi-Study Factor Analysis With Applications in Nutrition and Genomics.
- PheMIME: an interactive web app and knowledge base for phenome-wide, multi-institutional multimorbidity analysis.