Why Your Bioinformatics Tutorial Code Fails on Real Data
By Dr. Zubair Khalid, DVM, MS, PhD ·

Every person who learns bioinformatics hits the same wall. The tutorial notebook runs end to end. You swap in your own counts matrix, your own FASTQ files, your own clinical table, and everything breaks. Errors appear that the tutorial never mentioned, the results look wrong even when no error is thrown, and you cannot tell whether the problem is your data, your code, or your understanding.
The single most likely cause is this: tutorial datasets are small, complete, pre-filtered, and shaped exactly the way the author needed them to be. Your real data is none of those things. Tutorial code carries hidden assumptions about data shape, missingness, identifiers, scale, and quality. Those assumptions were never stated because the tutorial data happened to satisfy all of them. When your data violates even one assumption, the code fails, sometimes loudly with an error message and sometimes silently with a result that is simply wrong.
The first thing to check, before you touch any code, is the shape and content of your data. Print the dimensions, the column types, the number of missing values, and a few sample rows. Compare those against what the tutorial assumed. In most cases, that single comparison tells you which assumption broke. A modern tutorial on Bayesian multi-study factor analysis makes the same point implicitly by spending its opening pages on data structure and study-level variation before any model runs [1]. Good tutorial authors front-load data inspection. Most tutorials skip it, which is exactly why your code fails.
This article walks through the causes of tutorial failure in order of how often they occur, explains the mechanism behind each one, gives you a troubleshooting table, and lays out a diagnostic sequence you can follow on any dataset. It closes with the prevention practices used by professional computational groups and with guidance for anyone who wants to learn bioinformatics past the tutorial stage.
The First Thing to Check: Your Data, Not Your Code
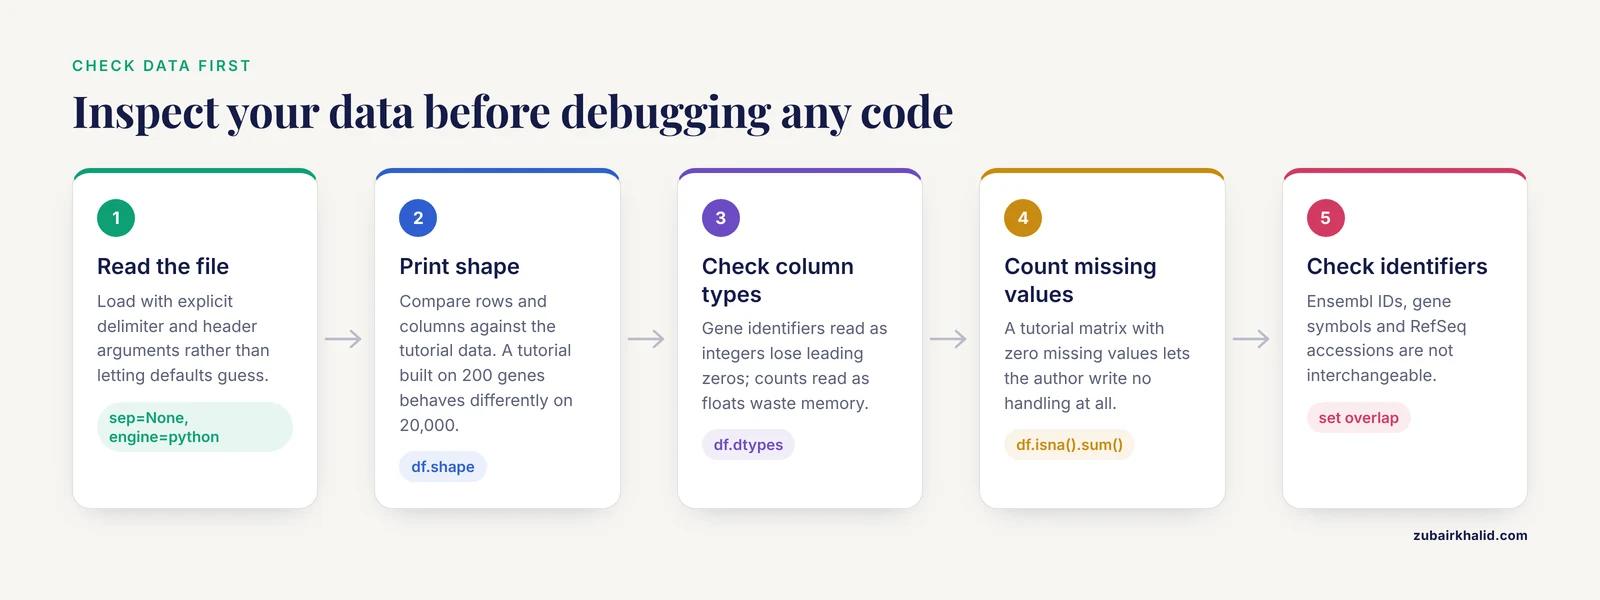
When tutorial code fails on real data, the instinct is to debug the code. Resist that instinct. Debug your data first.
Run this inspection before anything else, using Python with pandas:
import pandas as pd

df = pd.read_csv("your_counts.csv", sep=None, engine="python")
print(df.shape)          # rows and columns
print(df.dtypes)         # column types
print(df.isna().sum())   # missing values per column
print(df.head(3))        # what the data actually looks like
In R, the equivalent check looks like this:
df <- read.csv("your_counts.csv")
dim(df)
str(df)
colSums(is.na(df))
head(df, 3)
Four questions matter at this stage:
- How many rows and columns does your data have, and how does that compare to the tutorial data? A tutorial built on 200 genes will behave very differently on 20,000 genes.
- Are the column types what you expect? Gene identifiers read as integers lose their leading zeros. Counts read as floats waste memory and sometimes break downstream tools.
- How many values are missing, and where? A tutorial matrix with zero missing values lets the author write code with no handling for them at all.
- Do your identifiers match the format the tutorial expects? Ensembl IDs, gene symbols, RefSeq accessions, and protein names are not interchangeable, and mixing them is one of the most common silent failures in applied genomics.
If the tutorial ran in ninety seconds and your data takes ninety minutes, that is also information. Scale changes behavior, which is covered in its own section below.
Why Tutorial Code Fails on Real Data: Causes in Order of Frequency
The failure modes below are ordered from the ones you will meet in your first week to the ones that show up after months of experience. Each section explains the mechanism, the symptom, and the fix.
Cause 1: Data Format and Structure Mismatches
This is the most common cause by a wide margin. Tutorial code is written against one specific file. Every parsing choice, from the delimiter to the presence of a header row to the treatment of comment lines, is hardcoded, even when the tutorial claims to be general.
The classic failures in this category:
- Delimiter confusion. The tutorial uses
read_csv, which assumes commas. Your file is tab separated, or semicolon separated because it was exported from a European spreadsheet locale. pandas and R will read it anyway and hand you a single mangled column, which fails later in a place far from the true cause. - Header rows in unexpected places. Many genomics pipelines produce files with several lines of metadata before the table starts. Feature count matrices, Bowtie2 summary logs, and exporter output from commercial instruments all do this. The tutorial never shows a header argument because its test file had none.
- Indexing conventions. Genomic coordinates are 1-based in most file formats, such as GFF, BED disputes this convention, and VCF, while Python and array-based code is 0-based. Off-by-one coordinate errors produce results that look plausible and are quietly shifted by a single base.
- Row and column orientation. Some tools expect samples as rows and genes as columns. Others expect the transpose. Tutorial code often includes an implicit transpose step, or none, and both fail differently on your data.
- Type coercion. pandas reads a gene symbol like
SEPT1and, depending on settings, may interpret similar looking values as dates or numbers. Identifiers silently corrupted at read time produce downstream join failures that look like missing data problems.
The fix is to never trust a file read. After every read, check shape, types, and sample values. Use explicit arguments for delimiters, headers, and comment characters rather than letting defaults guess. When joining two tables on an identifier, verify the overlap explicitly, for example with len(set(df1.id) & set(df2.id)) in Python, and print the number of matched rows. If a join drops most of your rows, the identifier formats differ, not your biology.
Cause 2: Missing Values and Filtering Assumptions
Tutorial datasets in genomics are almost always pre-filtered. Low count genes were removed. Samples with poor quality metrics were dropped. Missing values were imputed or the rows carrying them were deleted. None of that work appears in the tutorial, because it happened before the tutorial began.
Real data brings all of these problems with it:
- Structural missingness. In RNA-seq, a gene with zero counts in many samples is common and expected. In mass spectrometry proteomics, missingness follows a different pattern, where proteins drop out near the detection limit. Tutorial code written for complete matrices will either crash on
NaNvalues or, worse, silently propagate them. - The filtering step that never happened. Methods such as differential expression analysis assume that genes with almost no reads were removed first. Run the same code on an unfiltered matrix and you get inflated multiple testing burdens, unstable fold changes for near zero counts, and sometimes numerical errors from logarithms of zero.
- Imputation choices with consequences. Many machine learning tutorials call an imputer with default settings and move on. On real data, the choice between mean imputation, k-nearest-neighbor imputation, and model-based approaches changes the result, and in proteomics the wrong choice can invert a finding.
The fix is to reproduce the invisible preprocessing. Read the methods section of the paper behind the tutorial. Ask which rows and columns were removed, at what thresholds, and in what order. If that information is missing, assume your results will differ from the tutorial's results, and say so in any write-up of your own analysis.
Cause 3: Environment and Version Drift
Tutorial code depends on a specific constellation of package versions. Six months later, one dependency updates, an API changes, and the tutorial breaks for everyone. On your machine, the failure has a second layer: your environment differs from the author's in ways that include operating system, compiler versions, and system libraries.
The symptoms range from explicit import errors to subtle behavior changes. A plotting library updates and changes default parameters. A statistics library updates and changes a default correction method. Your numbers differ from the tutorial's numbers with no error anywhere.
The fix has three parts:
- Record what you run. Export your environment explicitly. In conda, write
conda env export > environment.yml. In Python, writepip freeze > requirements.txt. In R, capturesessionInfo()output at the end of every analysis. - Recreate the tutorial environment when comparing results. If the tutorial lists versions, install those versions in a fresh environment. You are trying to reproduce a result first and adapt it second. Mixing both goals in one environment guarantees confusion.
- Pin versions in your own work. Once your adapted pipeline works, freeze it. A modern deep learning tutorial for RNA-RNA interaction prediction puts containerization, version-controlled datasets, and workflow management among its core recommendations, precisely because environment drift destroys reproducibility [2].
Containers, described in more detail in the prevention section, solve this class of failure almost completely, and they are now standard practice in computational biology rather than an optional refinement.
Cause 4: Memory and Scale
Tutorial code written on a laptop against a toy dataset frequently fails on real data for reasons that have nothing to do with correctness. The mechanisms are mechanical:
- Memory exhaustion. A matrix of 20,000 genes by 100 samples fits in memory easily. The same matrix with 10,000 samples, or single-cell data with hundreds of thousands of cells, may not. Pandas operations that duplicate data, such as certain join and apply patterns, multiply memory use by factors of two or more.
- Reading whole files at once. Tutorial code often calls
pd.read_csvon everything. Real VCF files, alignment files, and merged variant tables can exceed available memory. Chunked reading with thechunksizeparameter, or switching to columnar formats such as Parquet, resolves most of these cases without changing analysis logic. - Runtime assumptions. A loop that takes two seconds on 200 genes takes twenty minutes on 20,000. A cross-validation loop that took minutes now takes days. Code that is technically correct becomes practically unusable, and the fix, vectorization or parallelization, changes the code structure.
- Integer and floating point limits. Large count sums can overflow 32-bit integers in some tools. Cumulative floating point operations on very large matrices accumulate rounding error in ways toy data never reveals.
The diagnostic sign of a scale problem is that the code works on a subset of your data and fails, or becomes impractically slow, on the full set. The immediate fix is to subset deliberately. Take 500 genes and 20 samples, confirm correctness, then address performance separately. Conflating correctness debugging with performance debugging is how both take twice as long.
Cause 5: Batch Effects and Study Structure
Once your code runs, the next class of failure is statistical rather than mechanical. Real data carries structure that toy data lacks: samples processed on different days, by different operators, with different reagent lots, or in entirely different studies. These systematic differences are called batch effects. A batch effect is any non-biological source of variation that correlates with groups of samples rather than with the biological question.
Tutorial datasets frequently come from a single cohort processed uniformly, so batch structure is absent and no correction code appears. Apply that code to a multi-study dataset and the dominant signal in your principal component analysis is the processing batch, not the biology.
This problem is serious enough that entire methodological literatures exist around it. A recent tutorial on Bayesian multi-study factor analysis presents seven models built specifically to separate shared biological signal from study-specific variability in integrated high-dimensional data, against benchmark strategies of naive pooling and fully separate analysis [1]. The existence of that methodological range tells you something practical: naive pooling of multi-study data is a known failure mode with known consequences, and the field has built dedicated tools because simple fixes are insufficient.
Practical steps for your own work:
- Plot your data before modeling. A principal component analysis colored by batch date, sequencing lane, or study of origin reveals batch structure in one figure.
- Record metadata exhaustively. Batch effects can only be assessed and corrected when the batch variables are known. A metadata table missing collection date makes the problem invisible rather than absent.
- Match the correction method to the design. Correction approaches differ fundamentally depending on whether batch effects and the biological variable of interest are confounded or balanced. When they are confounded, no computational correction recovers the biology, and this is an experimental design failure that no code can repair.
Cause 6: Data Leakage and Sampling Errors in Machine Learning Tutorials
Machine learning tutorials in bioinformatics introduce a failure mode that is quieter than the others because the code runs perfectly and the reported accuracy looks excellent. The problem is data leakage, which means information from the evaluation set influences the training process, so performance estimates are inflated.
The classic mechanisms in biological machine learning:
- Preprocessing before splitting. Normalizing, scaling, or feature selecting on the full dataset before train-test splitting leaks distributional information from test samples into training. The split must come first, and all fitted transformations must be learned on training data only.
- Near-duplicate samples. Multiple samples from the same patient, same tumor, or same sampling event appearing in both train and test sets. The model memorizes the individual, not the biology. This is common in clinical genomics datasets and rare in tutorial datasets, which are often curated to be independent.
- Improper negative sampling. Tutorials on interaction prediction, including RNA-RNA interaction prediction, depend heavily on how negative examples are generated. The recent end-to-end tutorial on this topic gives dataset curation and negative sampling their own dedicated steps, because careless negative generation produces artificially easy classification problems where the model learns dataset artifacts instead of biology [2].
- Homogeneous benchmarks. Tutorial datasets often come from one source with one measurement protocol. Cross-validation within such a dataset overestimates how the model performs on data from a new lab or platform.
The fix is procedural. Split first, fit preprocessing on training data only, group samples at the split level when samples are related, and whenever possible evaluate on data that is independent by source, not just by row. When a tutorial reports high accuracy and your application of the same model to genuinely new data collapses, leakage is among the first causes to investigate.
Cause 7: Identifier and Reference Mismatches
These failures sit between mechanical and statistical. Your code runs, but row counts drop or annotations look wrong.
- Version mismatches between reference resources. Gene annotation databases update continuously. An Ensembl release 75 identifier may not resolve in a release 110 lookup. Reference genomes differ in contig naming, with chromosomes called
1in one resource andchr1in another, and alignment tools fail or silently drop records over this difference. - Outdated symbol mappings. Gene symbols change over time. A script mapping symbols to annotations fails on the fraction of symbols that were renamed, and the failure looks like missing data rather than a versioning problem.
- Protein, transcript, and gene level confusion. Joining protein-level measurements to gene-level annotations, or transcript-level counts to gene-level summaries, loses rows through many-to-one and one-to-many relationships that tutorial code never confronts because its toy annotation had a clean one-to-one mapping.
The fix is to treat identifier mapping as an explicit, logged analysis step. Record the release version and date of every database you map against. Report how many identifiers mapped and how many did not. If a tutorial silently assumes a mapping that succeeds for every row, verify that assumption on your data before trusting any downstream number.
Cause 8: Rare but Real Failure Modes
A smaller set of causes accounts for the remaining hard-to-diagnose failures.
- File encoding and line endings. Files produced on Windows carry carriage return characters that break line-oriented parsing in Unix tools. Files in encodings other than UTF-8 corrupt gene symbols containing special characters. The symptom is often a single inexplicable trailing character in every identifier.
- Gzip traps. A file can be gzip-compressed but still named
.fastq, or decompressed but named.gz. Tools differ in whether they inspect the content or trust the extension, so the same file works in one tool and fails in another. - Timezone and date parsing. Clinical metadata dates parsed with ambiguous day-month order produce silently shifted timestamps, which matter when you join exposures to outcomes by date.
- Floating point comparisons. Code that filters with exact equality on computed values, such as
pvalue == 0.05, fails on real data where computed values are never exactly representable. The tutorial author wrote it with a toy case where it happened to work. - Concurrency corruption. Running the same intermediate file through two pipeline branches at once, or writing to a shared network location from parallel jobs, corrupts outputs intermittently. The tutorial never mentions file locking because a single-user notebook never encounters the condition.
These are rare individually, but collectively they consume days of debugging time because their symptoms point elsewhere.
Troubleshooting Table: Symptom, Cause, Confirmation, Fix
The table below is the core reference for this article. Work from your symptom inward.
| Symptom | Likely cause | How to confirm | Fix |
|---|---|---|---|
KeyError or column not found on a column that visibly exists | Whitespace in column names, or wrong delimiter producing one merged column | Print df.columns and the raw first bytes of the file | Strip column names, read with explicit delimiter and header arguments |
| Join returns far fewer rows than expected | Identifier format or version mismatch between tables | Compute set overlap of join keys in both tables | Normalize identifier format, confirm database release versions, log match rates |
Error mentions NaN, inf, or shape mismatch | Unhandled missing values, or zero counts entering log transforms | Count missing values per column, check for zeros before log steps | Reproduce the tutorial's invisible filtering, handle or impute deliberately |
| Tutorial took minutes, your run takes hours or dies | Memory or scale limits | Run on a 5 percent subset, watch memory use | Chunk file reads, vectorize, move to a cluster or larger machine |
| Code runs, results look biologically wrong | Batch effects, or preprocessing assumptions violated | PCA colored by batch variables, sample correlation heatmap | Record metadata, apply design-appropriate correction, redesign if confounded |
| Accuracy near tutorial claims on split data, poor on new data | Data leakage or homogeneous benchmarking | Check for related samples across splits, audit preprocessing order | Split first, fit preprocessing on train only, evaluate across sources |
| Package import fails, or numbers differ from tutorial with no error | Environment and version drift | Compare sessionInfo() or pip freeze against tutorial versions | Recreate the tutorial environment, then pin your own |
| Coordinates off by one base after intersecting files | 0-based versus 1-based coordinate confusion | Manually verify one known interval across both files | Convert coordinate systems explicitly, prefer standard tools over manual arithmetic |
| Tool crashes on a file that opens fine elsewhere | Gzip state, encoding, or line ending problems | Run file on the input, check the first and last bytes | Standardize file formats and encodings at pipeline entry points |
| Intermittent corrupted outputs, irreproducible results | Concurrency or write conflicts on shared files | Look for overlapping writes in your workflow logs | Serialize writes, use a workflow manager to enforce dependencies |
A Diagnostic Sequence You Can Follow
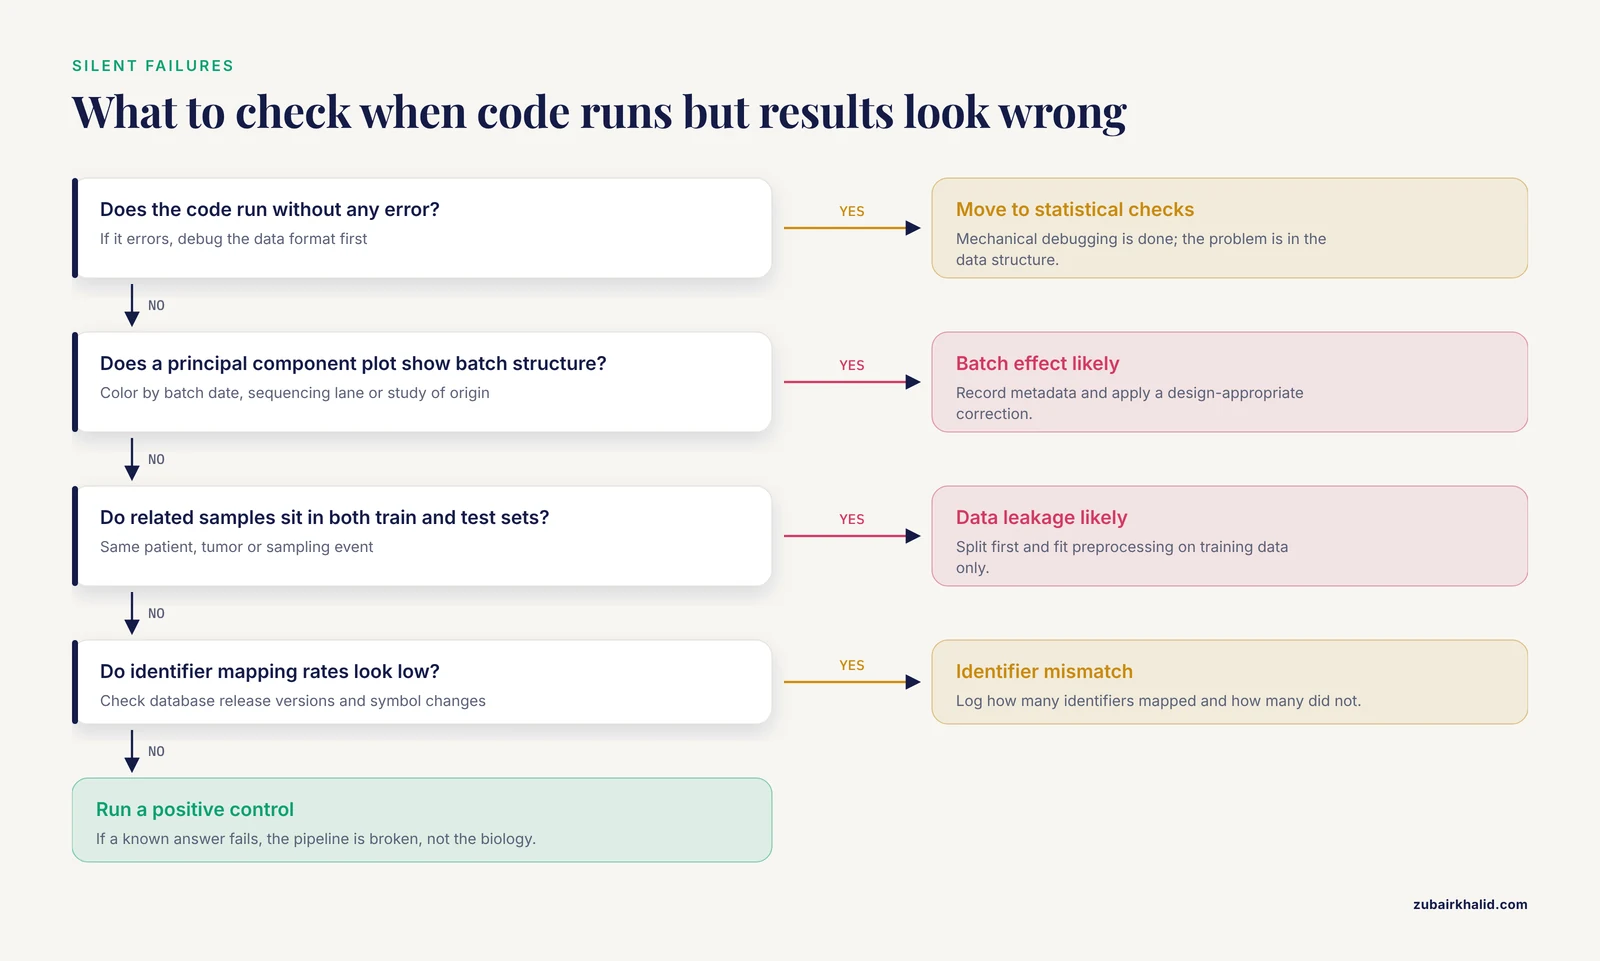
When tutorial code fails on real data, work through this sequence in order. Each step either fixes the problem or narrows the search space.
- Run the tutorial untouched. Reproduce the original result with the original data. If the tutorial itself fails, your problem is environmental, and nothing about your data matters yet.
- Inspect your data before your code. Shape, types, missingness, identifier formats, as described above. Write down the three assumptions the tutorial makes that you can now see.
- Reduce to a minimal case. Subset your data to a small matrix, for example 200 rows and 10 columns, that preserves the failure. Debugging a failing join across 20,000 rows is miserable. Debugging the same failure across 200 rows is fast.
- Recreate the tutorial environment exactly. Install the stated package versions in an isolated environment. If the failure disappears, version drift was the cause. If it persists, your data is implicated.
- Bisect the pipeline. Run the tutorial in stages, saving intermediates. Inspect each intermediate file. The failure lives between the last sane intermediate and the first broken one.
- Check the invisible preprocessing. Read the original paper or the tutorial's repository history. List every filtering, normalization, and imputation step applied before the code you were given.
- Separate errors from wrong results. If the code now runs but produces implausible output, shift from mechanical debugging to statistical checks: batch structure, leakage, identifier mapping rates, and comparison against a known positive control if one exists.
- Record what fixed it. Write the cause and the fix into your own notes. The second time you meet a class of failure, recognition replaces debugging.
Most failures resolve by step 5. The ones that reach step 7 are the failures that teach you the most, because they force you to understand the method rather than the code.
Common Mistakes and Limitations
These are the specific, recurring errors seen in people who are past the beginner stage but still learning.
- Blaming yourself for the tutorial's omissions. Tutorials that skip preprocessing, versioning, and data inspection are incomplete documents, not a measure of your ability. The tutorial on RNA-RNA interaction prediction explicitly structures its chapter around dataset curation, preprocessing, evaluation, and reproducibility, and treats transparent discussion of design choices as part of the deliverable [2]. That structure is the standard to expect, and its absence in other tutorials is a defect of those tutorials.
- Fixing symptoms instead of assumptions. Adding
.dropna()at the point of crash addresses nothing if the missingness pattern itself carries meaning. Ask why the value is missing before deciding what to do with it. - Trusting benchmark numbers attached to tutorials. Reported accuracies in method papers and tutorials are estimates under specific data conditions. Simulations used to compare integrative factor models, for example, evaluate accuracy under conditions the authors chose, and multi-study real data adds structure those simulations may not capture [1]. Treat published numbers as context, not as the performance you should expect.
- Skipping the metadata. Analyses fail silently when sample metadata is incomplete, because batch structure, relatedness, and confounding all live in metadata. Spend the first hour of any project on the metadata table.
- Confusing reproduction with replication. Getting the tutorial's exact numbers with the tutorial's data is reproduction. Getting a valid result on your data is a separate achievement with separate requirements. Do not expect the second from the first.
- Debugging correctness and speed at once. Subset to a small case for correctness. Optimize only after the small case produces verified results.
One limitation belongs to this article as much as to any tutorial. Every dataset is individual, and the diagnostic sequence here identifies causes, not guarantees. Complex analyses still require domain expertise applied to your specific data and question.
A safety note applies to a subset of real data work. Human genomic and clinical data are identifiable even after identifier removal, because genomic sequence itself is inherently identifying. De-identify files before local analysis, store them under institutional access controls, and confirm that your data use agreement covers the analysis you plan before you run it. The hazard in this field is rarely chemical, but it is real.
How to Fix Tutorial Code: Solutions That Work
The solutions below resolve the failures above in a durable way, not a one-off way.
Make data inspection a ritual, not a reaction. Begin every analysis, adapted tutorial or original, with the same inspection script. Over time you will spot format mismatches in seconds because you have seen the same patterns repeatedly.
Recreate before you adapt. The two goals of reproducing the tutorial and adapting it to your data interfere with each other. Complete the reproduction in a clean environment first. Then adapt in a second environment where every change from the baseline is yours and therefore explainable.
Log everything that changes data. Every filter, every join, every imputation, and every identifier mapping should print or save a record of how many rows went in and how many came out. Silent data loss is the root of the most damaging failures, and logging converts silence into signal.
Use isolated, pinned environments. Conda environments, virtual environments, or containers each solve the dependency problem. Containers go further and capture the operating system layer as well. The recommendation to pair containerization with version-controlled datasets and workflow management appears in current computational biology tutorial practice as a package of measures, not as alternatives [2].
Adopt a workflow manager for anything you will run twice. Snakemake, Nextflow, and similar tools enforce explicit dependencies, handle recomputation, and make partial reruns safe. They eliminate the concurrency corruptions and forgotten-step errors that notebooks accumulate.
Version control your data processing, not just your code. Reference database versions, genome build, and annotation releases are part of your methods. Record them alongside code, the way the FAIR principles, which stand for findable, accessible, interoperable, and reusable, treat data and metadata as first-class research outputs.
Compare against a positive control. When results look wrong and no error is raised, run your pipeline on a dataset with a known answer. If the known answer fails, the pipeline is broken. If it passes, the surprise in your real data is biological or structural, and the investigation shifts accordingly.
Learning Bioinformatics Past the Tutorials
If you are working through a bioinformatics course or teaching yourself, the failure patterns in this article are the actual curriculum. The syntax of any language is a small part of the skill. The larger part is the discipline of verifying inputs, reproducing environments, and questioning results that run without errors.
Well-designed tutorials model that discipline, and studying their structure is instructive in itself. The Graphery webserver teaches network algorithms through executable Python code that runs interactively on real biological networks, allowing users to modify code and see effects immediately without an account, and it accepts contributions from both computational and biological researchers [3]. That design choice, running code against real data structures rather than abstractions, is what separates tutorials that transfer to real work from tutorials that only transfer to other tutorials.
The same principle appears across methodological domains. The Bayesian multi-study factor analysis tutorial pairs each method with simulations and benchmark comparisons so readers see not just how code runs but under what conditions each approach succeeds or fails [1]. The RNA-RNA interaction tutorial devotes explicit space to the decisions that determine whether a model generalizes, including negative sampling and evaluation design [2]. Notice what strong tutorials include: data provenance, explicit preprocessing, environment documentation, and honest treatment of failure conditions.
When choosing a bioinformatics course or tutorial series, evaluate it against those criteria before you evaluate the topic. A mediocre topic taught with real data and documented environments will make you a better analyst than an exciting topic taught on a sanitized matrix.
Frequently Asked Questions
Why does my bioinformatics tutorial code work in the tutorial but fail on my data?
Tutorial code encodes unstated assumptions about data shape, completeness, identifiers, and scale that the tutorial dataset satisfies and your data does not. Check your data's dimensions, missing values, and column types against the tutorial's data before debugging anything else.
What is the single most common cause of tutorial code failing on real data?
Format and structure mismatches, especially delimiters, header rows, and identifier formats that differ from the tutorial file. Confirm by printing the parsed shape, column names, and sample rows immediately after reading, and by checking the overlap of join keys between tables.
How do I fix bioinformatics code that runs but gives obviously wrong results?
Move from mechanical debugging to statistical checks. Plot the data colored by batch variables such as date and study origin, verify identifier mapping rates, audit the order of preprocessing relative to any train-test split, and run the pipeline on a dataset with a known answer.
Should I recreate the tutorial's exact software environment?
Yes, when you are trying to reproduce the tutorial's results. Version drift changes behavior silently, and recreating the stated versions in an isolated environment separates problems caused by your data from problems caused by your software. Pin your own versions once your adapted analysis works.
What is data leakage in bioinformatics machine learning?
Data leakage means information from evaluation samples influenced training, usually through preprocessing fitted on the full dataset or related samples appearing in both train and test sets. It inflates accuracy that then collapses on genuinely new data. Split your data first and fit every transformation on training data only.
How do I handle missing values when adapting tutorial code?
First determine why values are missing, because the mechanism matters for genomics and proteomics data. Then reproduce whatever filtering and imputation the tutorial applied before the code you were given, since those steps were usually performed outside the tutorial and are often undocumented.
Do I need a formal bioinformatics course to learn this properly?
No, but structured practice on real data matters more than the format. Interactive resources that run code on real biological datasets, such as executable network algorithm tutorials, and methodological tutorials that document their full pipeline including environment and evaluation, teach the discipline that transfers to your own data regardless of how you access them.
How do I make my adapted analysis reproducible?
Pin software versions or use containers, version control your code and record reference database versions, save metadata exhaustively, log row counts through every processing step, and use a workflow manager for anything you will run more than once. These practices together are the current standard in computational biology.