A Practical Framework for Comparing Bioinformatics Tools
By Dr. Zubair Khalid, DVM, MS, PhD ·

A bioinformatics tools comparison framework is a structured, repeatable procedure for evaluating two or more software tools against the same datasets, the same metrics, and the same execution conditions. Its purpose is to replace anecdote and self-reported performance with evidence you can defend in a methods section, a thesis defense, or a clinical sign-off.
The framework matters because the choice of tool changes results. Hundreds of variant callers, aligners, assemblers, and predictors have been released, and each claims a specific advantage over the others, which leaves analysts without a principled basis for choosing [1]. In metagenomics, the sheer number of tools for sequence processing and functional annotation has created a fragmented methodological domain that makes tool selection and pipeline design genuinely difficult [2]. Without a comparison framework, tool selection defaults to citation counts, habit, or the first result on a search page, and none of those reliably predict performance on your data.
What Is a Bioinformatics Tools Comparison Framework?
A comparison framework is not a piece of software. It is a discipline: a fixed set of questions, datasets, metrics, execution rules, and reporting standards applied identically to every candidate tool. The framework answers one question at a time, for example "which of these five aligners recovers the truest insert size distribution on my read set" rather than the unanswerable "which aligner is best."
The idea appears throughout the bioinformatics literature under different names. The EMBL-EBI Job Dispatcher team built a service framework that exposes mainstream sequence analysis applications through one uniform and consistent interface, explicitly so that novice and expert users can compare and use tools the same way [3]. Community registries such as the Tools and Data Services Registry arose because documentation of bioinformatics resources was fragmented across the web, which left scientists struggling to find, understand, compare, and use the best resources for the task at hand [4]. Benchmark platforms such as PathoBench formalize the same idea for pathogen pipelines, requiring all submissions to report pathogen-specific evaluation metrics against the same datasets so that head-to-head comparison is only ever made on common ground [5].
Terms the Framework Is Often Confused With
| Term | What it actually is | How it differs from a comparison framework |
|---|---|---|
| Comparison framework | A protocol for evaluating multiple tools on equal terms | The subject of this article |
| Pipeline | A fixed chain of tools that processes data end to end | Executes an analysis, does not judge tools against each other |
| Benchmark | A reference dataset plus accepted metrics, such as a truth set | An input to the framework, not the framework itself |
| Benchmark registry | A curated catalog of standard benchmark datasets, as in PathoBench's 26 datasets across 10 human pathogens [5] | Supplies reusable inputs so comparisons stay comparable |
| Resource registry | A catalog of tools and services with structured metadata, such as the community registry that held 1,785 resources as of November 2015 [4] | Helps you build the candidate list, does not measure performance |
| Workflow framework | An execution engine such as Nextflow with container support | Standardizes how tools run, one ingredient inside a comparison framework |
Keeping these distinctions straight prevents a common failure mode, which is announcing a "framework" that is really just a pipeline with a table of runtimes appended.
Why Comparing Bioinformatics Tools Is Hard
Three structural problems make ad hoc comparisons misleading.
The self-reporting problem. Developers publish performance numbers on datasets they chose, with preprocessing they chose, scored by metrics they chose. The PathoBench authors describe the consequence directly: self-reported performance numbers, ad hoc evaluation datasets, and inconsistent metrics make pipeline selection difficult for clinical and public-health researchers [5]. The antimicrobial peptide prediction field reaches the same verdict, noting that studies often rely on heterogeneous datasets and inconsistent evaluation protocols that can produce data leakage and inflated performance estimates [6].
The context-dependence problem. A tool's performance is a property of the tool, the data, and the question jointly. In long-read structural variant calling, some callers perform well on indels while others handle large and complex variants better, so no single caller wins every dataset [1]. In plant Iso-Seq analysis, several tools address different aspects of transcriptome complexity and some are still being refined, which is why a comprehensive summary of available tools and their utility was needed in the first place [7].
The reproducibility problem. Comparisons run on one laptop with one set of library versions cannot be reproduced or extended. The nf-core project was created precisely because software dependencies and execution logic are often tightly coupled to proprietary computing environments, making it difficult or impossible for others to reproduce results [8]. Containerization work in structural bioinformatics makes the same argument, that rapid tool development produces short software lifespans and portability and maintainability problems that containers directly address [9].
A comparison framework is the countermeasure to all three. It fixes the datasets, fixes the metrics, and fixes the execution environment.
The Framework, Step by Step
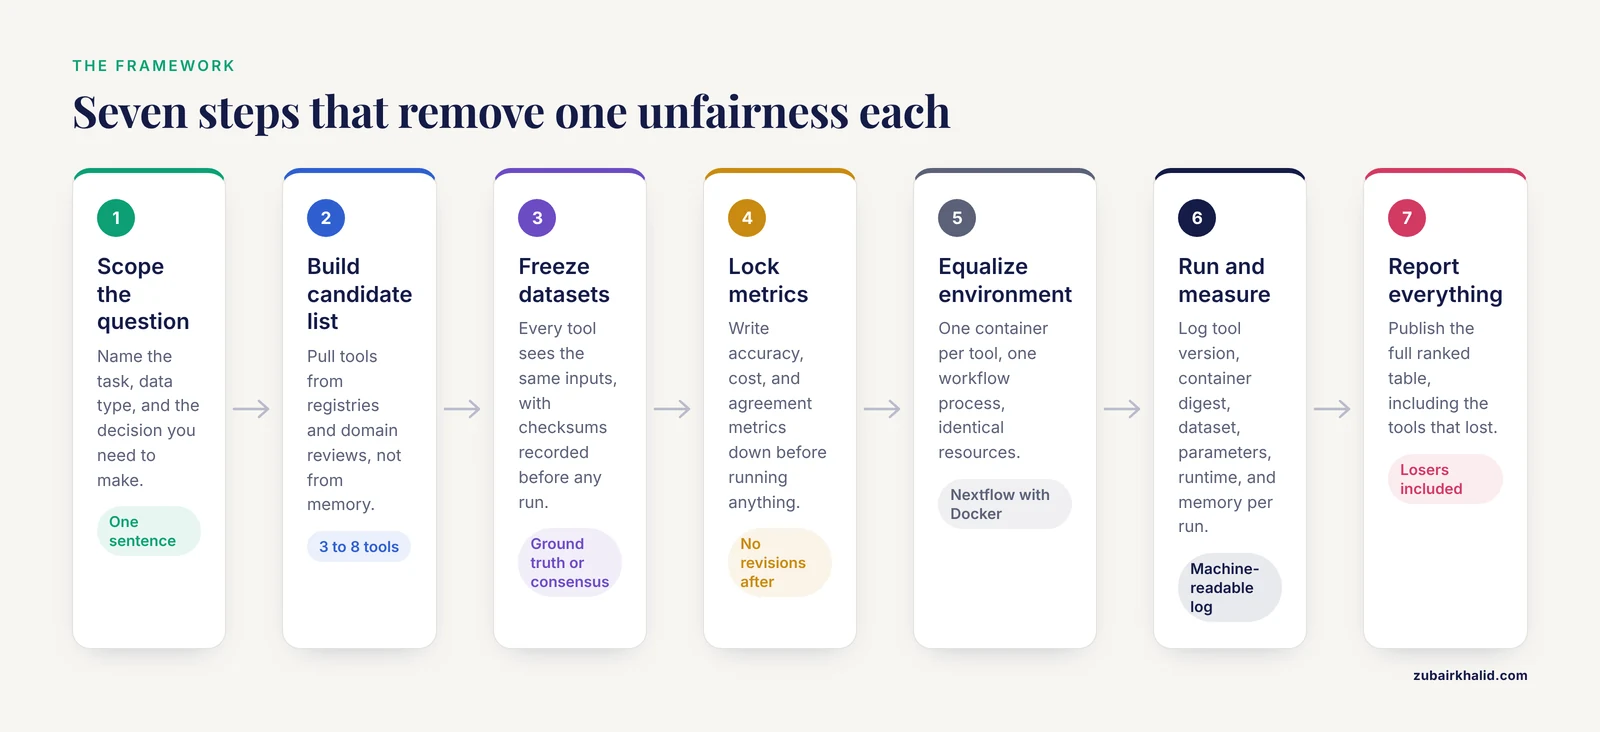
The framework has seven steps. Each step exists to remove one source of unfairness.
Step 1: Define the Question and the Scope
Write a single sentence that names the biological task, the data type, and the decision you need to make. Examples that work well:
- "Which multiple sequence alignment tool handles my 2,000 homologous protein sequences fastest while preserving known catalytic residues."
- "Which structural variant caller maximizes F1 score on long-read human data with 30x coverage."
- "Which low-complexity region detector gives the most useful annotations for downstream phase-separation analyses."
Scope decisions made here include the taxon or organism, the read technology, the approximate sample size, and whether runtime or accuracy is the binding constraint. A framework without a scoped question produces a table of numbers nobody can act on.
Step 2: Build the Candidate List From Registries and Reviews
Do not start from memory. Start from structured sources. The bio.tools registry, a community-driven curation effort supported by ELIXIR, exists to give bioinformatics resources a consistent standard of information so scientists can find and compare them [4]. Domain reviews do the same filtering work within a field, for example the metagenomics review that compares sequence processing and functional annotation tools by performance, computational requirements, and implementation [2], or the Iso-Seq review that summarizes existing tools and presents an integrated pipeline for long-read transcriptome analysis [7].
Apply three inclusion criteria to the candidate list:
- The tool claims to solve your exact task, not a neighboring task.
- The tool is installable in your environment or available as a container or web service.
- The tool is either actively maintained or is the reference standard you are measuring newcomers against.
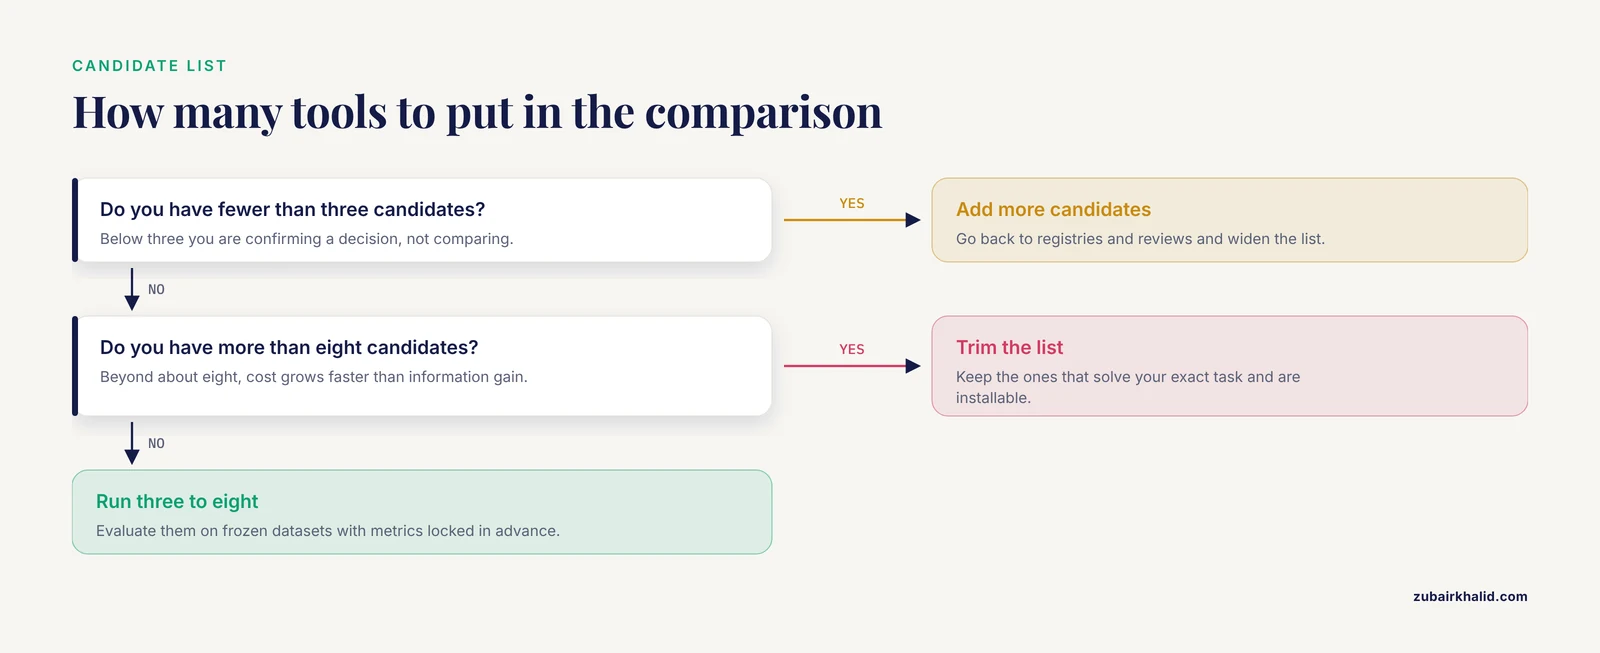
Three to eight candidates is usually the right range. Below three, you are not comparing, you are confirming a decision you already made. Above eight, evaluation cost grows faster than information gain.
Step 3: Fix the Evaluation Datasets
Every tool must see the same inputs, and those inputs should be frozen before any tool runs. Two categories of dataset are required.
Challenge datasets represent the data you actually work with, drawn from your own project or a public study matching your scope. Reference datasets have accepted ground truth. PathoBench demonstrates the pattern at scale, maintaining a curated registry of 26 standard benchmark datasets across 10 human pathogens, each with persistent identifiers and direct download links, plus mandatory dataset attestation so submitters cannot quietly substitute easier data [5]. The antimicrobial peptide evaluation work argues for the same discipline, asking explicitly what evaluation criteria and benchmark resources are needed to enable fair, reproducible, and biologically meaningful assessment [6].
When no truth set exists, construct one and document how. The low-complexity region benchmarking study handled the problem with consensus logic, observing that regions detected by multiple tools tend to be longer, more repetitive, and compositionally purer, which suggests stronger structural or functional relevance [10]. Consensus is not ground truth, but it is a defensible reference when ground truth is unavailable, as long as you say so.
Step 4: Fix the Metrics Before Running Anything
Choose metrics that match the decision, write them down, and do not change them after seeing results. Sensible metric families include:
- Accuracy metrics appropriate to the task, such as precision, recall, and F1 score for detection tasks, or RMSD, TM-score, and lDDT when comparing predicted structures, as used in the TP53 mutational impact framework [11].
- Agreement metrics between tools, such as the Jaccard similarity matrices used in the low-complexity region study, which revealed distinct clustering patterns among algorithms based on shared detection principles [10].
- Cost metrics, meaning runtime, peak memory, and storage, because a tool that wins on accuracy by a fraction of a percentage point while costing tenfold more compute may still be the wrong choice for your lab.
- Usability proxies, including whether the tool emits quality control reports a colleague can read. RLSuite, for example, generates a user-friendly analysis report specifically so results can be shared with non-bioinformatician colleagues [12], which is a real evaluation dimension for tools destined for core facilities.
Step 5: Standardize the Execution Environment
Uncontrolled environments invalidate comparisons. Two mechanisms solve this.
Containers. A container packages all code and dependencies required for the software, limits the effort required for porting and maintenance, and guarantees that every tool runs with the versions the developers intended [9]. Record the image tag for each tool in your write-up.
Workflow engines. Nextflow pipelines inherit the ability to run on most computational infrastructures and have native support for container technologies such as Docker and Singularity [8]. Wrapping each candidate tool in an identical Nextflow process, with identical input handling, identical logging, and identical resource requests, removes the most common source of accidental bias, which is giving your favorite tool more cores or more memory than its competitors.
The web service route is a legitimate alternative. The EMBL-EBI Job Dispatcher framework provides free access to mainstream tools through web applications and RESTful and SOAP-based APIs, integrated into resources such as UniProt, InterPro, ENA, and Ensembl Genomes [13]. Running candidates through one service platform equalizes the environment for you, at the cost of less control over versions and parameters.
Step 6: Run, Measure, and Quantify Agreement
Execute every tool on every dataset under the locked settings, once per tool per dataset, then record outputs and cost metrics in a machine-readable log. A minimal comparison record per run should capture the tool name and version, the container digest, the dataset identifier, the parameter string, runtime, peak memory, and the output file path.
After computing your chosen metrics, compute pairwise agreement between tools on the outputs themselves. The low-complexity region framework did this with residue-centric analyses such as length distribution and coverage percentage, protein-centric analyses such as compositional bias and Shannon entropy, and Jaccard similarity matrices across tools [10]. Agreement structure is diagnostic. Tools that cluster together likely share algorithmic assumptions, and picking one member of a cluster is largely a matter of cost and usability.
Step 7: Interpret, Decide, and Report
Rank candidates on the primary metric, then break ties on cost metrics and usability. Report the full table, including tools that lost. A comparison that only publishes the winner is marketing. State the version numbers, the dataset identifiers, the container digests, and the exact commands, so that a reader can rerun the whole evaluation. If you followed the nf-core conventions of standardized, tested, containerized pipelines [8], the reporting burden is mostly already paid.
Worked Examples From the Literature
Example 1: Sequence Analysis Tools Behind One Interface
The original EMBL-EBI framework exposed sequence similarity search services such as BLAST, FASTA, and InterProScan, and multiple sequence alignment tools such as ClustalW, T-Coffee, and MUSCLE, through one uniform and consistent interface with novel result visualizations [3]. The 2015 update expanded the tool set to Clustal Omega, MAFFT, PSI-Search, and InterProScan 5, added RNA analysis tools and new databases such as Pfam and Rfam, and retired deprecated services so the framework stayed relevant [14]. The 2024 update continued the pattern with a rebuilt website, enhanced visualizations, and improved job management [13]. This is a framework in the service sense: it does not declare one alignment tool best, it equalizes the interface, the databases searched, and the visualization layer so a user can make an informed choice on their own sequences.
Example 2: Choosing a Variant Caller With Meta-Learning
Faced with hundreds of structural variant callers for second- and third-generation sequencing data, researchers built a recommendation system under a meta-learning framework. The system extracts metadata features from a sequencing file and predicts which caller from a state-of-the-art set will perform best, by learning associations between data features and tool performance [1]. Treat this as a comparison framework that has been partially automated: the datasets and metrics were fixed during training, and the framework then maps new data to the tool most likely to win on data shaped like it.
Example 3: Metagenomics Pipeline Selection
The metagenomics review compares tools across sequence processing and functional annotation, evaluating performance, computational software requirements, and implementation, and argues that hybrid approaches, such as merging long-read nanopore data with short-read Illumina data, can recover whole biosynthetic gene clusters and improve assembly of low-abundance genomes [2]. The review is itself an application of the framework: a defined scope, a structured candidate list, and comparative evaluation dimensions stated before conclusions.
Example 4: Proteome-Scale Benchmarking With Consensus
The low-complexity region study benchmarked eight widely used detection methods under multiple parameter settings across the human proteome, in a modular framework covering length distribution, coverage percentage, compositional bias, amino acid composition, and Shannon entropy, with Jaccard similarity matrices tying the results together [10]. The paper is worth reading in full if you are designing your first benchmark, because it shows how to turn an awkward problem, where no truth set exists, into a reproducible consensus analysis.
Example 5: Standardized Evaluation for Prediction Tools
The antimicrobial peptide evaluation work surveys prediction tools, compares the underlying databases on content, redundancy, and experimental metadata, and then critiques evaluation practice, highlighting limitations in dataset construction that lead to leakage and inflated estimates [6]. Its central contribution is a proposed standard evaluation framework, which is exactly the artifact this article is teaching you to build for your own subfield.
Example 6: Community Benchmarking for Pathogen Pipelines
PathoBench evaluated four published Mycobacterium tuberculosis drug-resistance pipelines against the WHO TB mutation catalogue, demonstrating the discriminating power of common datasets and pathogen-specific mandatory metrics [5]. This example shows the end state of a mature framework: the comparison is ongoing, community-driven, and backed by credibility mechanisms including ORCID-linked attribution and administrator verification.
How to Run Your Own Comparison in Practice
The framework collapses into a working checklist. The table below turns the seven steps into the artifacts you should have on disk before you publish or commit to a tool.
| Step | Artifact you produce | Practical tip |
|---|---|---|
| 1. Scope | One-sentence question, in a README | Include the data type and the binding constraint |
| 2. Candidates | Tool list with versions and sources | Pull from registries and recent reviews [4] |
| 3. Datasets | Frozen input files with checksums | Use persistent identifiers where they exist [5] |
| 4. Metrics | A metrics file written before any run | Include one accuracy, one cost, one agreement metric |
| 5. Environment | One container image per tool, one workflow | Nextflow with Docker or Singularity support [8] |
| 6. Runs | A log per run, machine readable | Same resources allocated to every tool |
| 7. Report | Full ranked table plus commands and digests | Publish losers as well as winners |
A few concrete habits make this cheap rather than burdensome. First, write the Nextflow process stub once and instantiate it for each tool, so input handling and logging are literally the same code. Second, run a smoke test on a small dataset with every tool before the full evaluation, because the most common schedule killer is a tool that fails silently on your input format. Third, store raw outputs, not just metrics, so that a reviewer or collaborator can recompute agreement with different metrics later. Fourth, when a tool offers a web service with programmatic access, as the EMBL-EBI framework does through RESTful and SOAP APIs [13], you can script identical requests to several tools and sidestep local installation entirely.
For teams that expect to repeat comparisons as tools update, the recommendation-system approach is instructive. The meta-learning variant caller recommender treats past benchmark results as training data, extracting meta-features and meta-targets so future datasets can be routed to the likely best tool automatically [1]. Any lab with a growing history of internal benchmarks can adopt the same logic at small scale, even with simple regression rather than deep meta-learning.
How Frameworks Are Validated in Practice
A framework is itself a method, so it needs its own evidence. The literature validates comparison frameworks in three ways.
Discriminating power. A useful framework separates tools that actually differ. The PathoBench case study with four tuberculosis drug-resistance pipelines against the WHO mutation catalogue is a direct demonstration that the framework distinguishes performance where ad hoc comparisons had blurred it [5].
Reproducibility by an independent party. A framework passes this test when someone other than the original authors reruns it and reaches the same ranking. Containerized, workflow-wrapped designs make this test routine, which is the core argument of the containerization work in structural bioinformatics [9] and of the nf-core community model, where peer review and automated testing are built into pipeline development [8].
Concordance with biological expectations. When no truth set exists, framework results are checked against biology. The low-complexity region study did this by showing that consensus-detected regions are more repetitive and compositionally purer, which matches what structural biology predicts for functionally relevant segments [10]. The TP53 structural framework validated its comparison pipeline by connecting quantified structural differences, through RMSD and TM-score, to biologically interpretable consequences for DNA-binding function and docking behavior [11].
Misconceptions Students Bring to Tool Comparisons
Misconception: the best tool exists. Tools trade recall against precision, accuracy against runtime, and sensitivity against specificity. In Iso-Seq analysis, different tools address different aspects of transcriptome complexity, from error correction to isoform identification [7]. The deliverable of a comparison is a ranked, contextualized shortlist, not a crown.
Misconception: more tools means a better comparison. Eight candidates evaluated on one frozen dataset with locked metrics beats twenty candidates evaluated loosely. The low-complexity region study compared eight methods and still generated a substantial, reusable result [10]. Depth of control beats breadth of candidates.
Misconception: published benchmarks transfer directly to my data. Published results describe the datasets used, not yours. The metagenomics review exists partly because tool behavior varies with community composition, sequencing technology, and assembly difficulty [2]. Published benchmarks tell you which candidates deserve a spot in your own evaluation, not which one wins on your data.
Misconception: a pipeline is a framework. Running two tools inside the same pipeline and eyeballing the outputs is not a comparison. Without fixed datasets, fixed metrics, and equalized execution, differences you observe are as likely to come from the environment as from the tools.
Misconception: newer means better. Version churn is real, and frameworks that survive, like the EMBL-EBI Job Dispatcher, handle it by adding tools while retiring deprecated services and keeping the interface stable [14], [13]. The framework, not the release notes, is what lets you rationally decide whether to switch.
Common Mistakes and Limitations
These are the errors that most often invalidate comparisons, in rough order of frequency.
- Changing metrics after seeing results. If you discover after running that a different F1 variant flatters your preferred tool, you have abandoned the framework. Lock metrics in Step 4 and treat the temptation to revise as a red flag.
- Unequal resources. Giving one tool 32 threads and another 8 turns a runtime comparison into noise. The workflow-engine solution, one process definition with fixed resource requests, removes the temptation entirely.
- Leaky datasets. In machine-learning-based prediction tools, overlap between training and evaluation data inflates scores. The antimicrobial peptide critique names data leakage and inconsistent protocols as the central threats to fair assessment [6]. If you evaluate learned tools, check for redundancy between the tools' training data and your evaluation set.
- Ignoring version drift. Comparing version 2.3 of one tool against version 1.1 of another, when 2.0 of the second exists, produces stale conclusions. Pin versions, record digests, and date-stamp the comparison.
- Confusing agreement with correctness. Jaccard similarity and other agreement metrics show that tools cluster, not that the cluster is right [10]. Consensus methods improve confidence but are not a substitute for a validated truth set where one exists.
- Overfitting the framework to one dataset. A comparison run on a single sample generalizes no better than a tool trained on a single sample. The PathoBench registry model, with multiple standard datasets per pathogen [5], exists because single-dataset conclusions fail.
- Underreporting. Omitting the tools that lost, the parameters that were tried, or the failures encountered makes the comparison unverifiable. The entire value of the framework is that a skeptical reader can rerun it.
- Individual decision drift. For clinical and diagnostic settings, a framework comparison supports but does not replace local validation against your own instrument, your own sample matrix, and your own regulatory requirements, and diagnostic decisions always require qualified professional review of the specific case.
Quick Review
- A comparison framework fixes the question, the datasets, the metrics, and the execution environment before any tool runs.
- Build the candidate list from structured registries and domain reviews, not from memory,.
- Use datasets with ground truth where they exist, and documented consensus where they do not [5],.
- Containerize every tool and run all candidates through one workflow with identical resources,.
- Report agreement between tools, not only accuracy, because clustering reveals shared algorithmic assumptions [10].
- Publish the full table, including losers, with versions, parameters, and commands, so anyone can rerun the evaluation.
- A published benchmark narrows the candidate list for your own data, it does not decide the winner for you.
Frequently Asked Questions
What is a bioinformatics tools comparison framework?
It is a structured protocol for evaluating multiple tools on the same datasets, with the same metrics, under the same execution conditions. The goal is a reproducible, defensible ranking rather than an opinion.
How do I choose the best bioinformatics software for my project?
Define the exact task and data type, list candidates from registries and reviews, evaluate three to eight of them on your own data with locked metrics, and break ties on runtime, memory, and usability. The "best" tool is the best for your data, your compute budget, and your team.
Is a comparison framework the same thing as a pipeline?
No. A pipeline executes one fixed analysis chain, while a comparison framework is the evaluation protocol you use to decide which tools belong in a pipeline. Workflow engines such as Nextflow standardize pipeline execution and are one ingredient inside a comparison framework [8].
Can I trust published benchmarks instead of running my own?
Use them to build the candidate list and to learn which datasets and metrics are standard in your subfield. Because tool performance depends on the data, published results do not transfer automatically, and communities are increasingly requiring head-to-head evaluation on shared datasets to fix this [5].
How many tools should I include in a comparison?
Three to eight is usually right. Fewer than three is not a comparison, and beyond about eight the evaluation cost usually grows faster than the information gained. Eight methods under multiple parameter settings was enough for a substantial proteome-scale study [10].
What metrics should a good comparison report?
At minimum, one accuracy metric matched to the task, one cost metric such as runtime or peak memory, and one agreement metric such as Jaccard similarity between tool outputs. Agreement structure reveals which tools share assumptions and which are genuinely different approaches [10].
Sources
- Abstract LB502: Too many bioinformatics tools? Machine learning enables automatic recommendation on variant callers for long-read sequencing data
- Bioinformatics pipelines for Metagenomics: A review of data processing and functional annotation approaches
- A new bioinformatics analysis tools framework at EMBL-EBI
- Tools and data services registry: a community effort to document bioinformatics resources
- PathoBench: an open community-driven benchmark registry for pathogen bioinformatics tools
- Antimicrobial Peptide Databases and Prediction Tools: Toward a Standard Evaluation Framework.
- Single-molecule Real-time (SMRT) Isoform Sequencing (Iso-Seq) in Plants: The Status of the Bioinformatics Tools to Unravel the Transcriptome Complexity
- The nf-core framework for community-curated bioinformatics pipelines
- A Containerization Framework for Bioinformatics Software to Advance Scalability, Portability, and Maintainability
- A benchmarking framework for comparative evaluation of low-complexity region detection tools in the human proteome.
- Integrative Framework for TP53 Mutational Impact Assessment and Drug Repurposing Through Structural Bioinformatics
- RLSuite: An Integrative R-Loop Bioinformatics Framework
- The EMBL-EBI Job Dispatcher sequence analysis tools framework in 2024
- The EMBL-EBI bioinformatics web and programmatic tools framework